R16_CVI_SFD_SDD_EndUser_Training
LTE设备实训手册

TD-LTE课程实验手册1.基站开通相关无线参数学习1.1无线公关参数【PLMN】:国家码、网络码,必须与运营商规划一致。
【同步保持超时开关】:如果设置为―使能‖,基站GPS时钟丢失后,在―同步保持超时门限‖时间内基站正常工作,超过门限则闭塞基站下所有小区,防止对其他周围基站造成交叉时隙干扰。
实验室网络无GPS时钟时设置为不使能。
【用户无数据检测定时器】:在定时器时间内如果用户无数据传输则UE转入RRC-ONL Y状态,释放PUCCH资源。
1.2基带资源配置参数【天线端口与天线通道映射关系】:对于8通道的RRU,配置为00001111;表示前四通道映射端口0,后四通道映射端口1。
对于双通道RRU,如果是双通道单天线则配置为0,15,15,15,15,15,15,15;如果使用了双天线,则配置为0,1,15,15,15,15,15,15。
15表示该通道不使用或不存在。
【基带资源参考信号功率】:配置小区的RS发射功率,可以调整该参数控制覆盖范围。
1.3小区配置参数【PLMN】:国家码、网络码,必须与运营商规划一致。
【物理小区识别码(PCI)】:物理小区识别码,按照网络规划填写,确定后不能修改。
【跟踪区码】:跟踪区码TAC,根据规划配置。
【小区支持的天线端口数量】:小区支持的天线端口数,根据RRU类型和天线类型配置;单通道RRU只支持天线端口数1,只能使用单流。
双通道RRU配置为2,支持2X2MIMO。
指示小区当前支持最大天线端口数,发射分集和空间复用只有在多天线端口配置下才有意义。
【频段指示】:根据该小区实际使用频谱资源配置小区上下行载频所在的频段指示和中心频点。
频段指示与频谱范围对应关系:32:2545-2575,33:1900-1920, 34:2010-2025, 35:1850-1910, 36:1930-1990, 37:1910-1930, 38:2570-2620, 39:1880-1920, 40:2300-2400。
CATIA V5 R16_CVI_SFD_SDD_Setup_Training

Catalog management for SR1 Catalog management for SFD/SDD (Material Management)
7. 8. 9.
Point to the catalog using the PRM resource Place the custom section into a design document. Management of the Preferred List via PRM
1
2
2.
3. 4. 5.
5
3
4
PRM XML File
Copyright DASSAULT SYSTEMES 2005
9
1.3 PRM: Molded Conventions – ProjectParameters XML
Molded Conventions:
1. Set of rules governing the placement of the structural components. These rules are defined in MoldedConventions.xml file and are based on the ship axis defined by the ProjectParameters.xml file. Some important parameters in the ProjectParameters.xml file : Positioning Orientation – „Xp‟ for European convention, „Xm‟ for American convention. Management of the Length unit. Management of the Midship and Centerline frames.
Stratix 5700 EtherNet IP 训练工站说明书

Training WorkstationStratix 5700 EtherNet/IP WorkstationCatalog NumberMAJOR COMPONENTSPhoto shows ABT-TDENET5700 unit.Unit Dimensions• Width: 30 in (76 cm)• Height: 21 in (53 cm)• Depth: 13 in (33 cm)• Weight: Approx 45 lb (20 kg)Estimated Lead Time7 weeks. Some items are available for immediate shipment. Please call for availability.220-240V Plug OptionsSee the available document on Literature Library for 220-240V Plug Options for Workstations used in EMEA/AP (GMST10-PP524).Related ProductsThe workstation can be used in conjunction with the following products:• EtherNet/IP Procedures Guide (ABT-N300-TSJ50)• EtherNet/IP Fundamentals and Troubleshooting Lab Book (ABT-CCP180-TLB)• EtherNet/IP Configuration and Troubleshooting Lab Book (ABT-CCP183-TLB)†• Essentials of Industrial Ethernet Networks for an OT Professional Lab Book (ABT-CCP182-TLB)†• Essentials of Industrial Automation for an IT Professional Lab Book (ABT-CCP810-TLB)To use any of the lab books listed above with the ABT-TDENET5700-A workstation, the files provided for use with the PanelView Plus operator terminal will need to be updated.†Additional Hardware Required: The ABT-TD8300 Stratix 8300 workstation (or equivalent hardware) is required to complete some exercises in these lab books.Important Ordering Information*This unit is available with different PanelView Plus operator terminals:• For a unit with a PanelView Plus 6 terminal, order ABT-TDENET5700• For a unit with a PanelView Plus 7 terminal, order ABT-TDENET5700-AAllen-Bradley, CompactLogix, ControlLogix, expanding human possibility, PanelView Plus and Stratix are registered trademarks of Rockwell Automation Inc.Trademarks not belonging to Rockwell Automation are property of their respective companies.Publication GMST10-PP636F-EN-E – February 2020 | Supersedes Publication GMST10-PP636E-EN-E – October 2018Copyright © 2020 Rockwell Automation, Inc. All Rights Reserved. Printed in USA.To be respectful of the environment, Rockwell Automation is transitioning some of its training courses to a paperless format. Students are asked to complete downloads and bring personal devices to these classes. A full list of digital/paperless courses is currently available through your local distributor.。
R16 网络切片身份验证和鉴权流程解析

R16 网络切片身份验证和鉴权流程解析在R16中,新增了一个NSSAA(Network Slice-Specific Authentication and Authorization)的概念,要求服务的PLMN应根据订阅信息对HPLMN的S-NSSAI(Single Network Slice Selection Assistance Information)进行特定网络切片的认证和鉴权。
UE应在5GMM核心网能力的Registration Request消息中指明是否支持NSSAA特性。
如果UE不支持NSSAA特性,且UE请求为这些S-NSSAI中的任何一个进行特定于网络切片的认证和鉴权,则AMF 不会为UE触发此过程,并且它们将被PLMN拒绝。
如果UE支持NSSAA 特性,且UE请求的这些S-NSSAI中的任何一个均要经过特定于网络切片的认证和鉴权,则它们需包括在PLMN的待定NSSAI列表中。
如果UE配置有S-NSSAI(是切片用户),S-NSSAI受制于网络切片特定的认证和授权,则UE存储S-NSSAI和用于网络切片特定认证和鉴权的相应凭证之间的关联。
为了对S-NSSAI执行特定网络切片的认证和鉴权,AMF对S-NSSAI调用基于EAP的网络切片特定鉴权流程。
当S-NSSAI的NSSAA流程启动并正在进行时,AMF将S-NSSAI的NSSAA状态存储为挂起,当NSSAA完成时,S-NSSAI将成为允许的NSSAI或拒绝的S-NSSAI的一部分。
AMF可以随时为支持的UE调用此流程:(1) UE向AMF注册,HPLMN的一个S-NSSAI(该S-NSSAI映射到请求的NSSAI中的一个)需要特定网络切片的身份验证和鉴权,一旦HPLMN S-NSSAI的网络切片特定认证和鉴权成功,AMF可以将请求的NSSAI中的S-NSSAI添加到允许的NSSAI中;(2)特定网络切片的AAA服务器触发对S-NSSAI的UE重新认证和重新鉴权;(3) AMF基于运营商策略或订阅更改,决定为先前鉴权的特定S-NSSAI 发起网络切片特定的认证和鉴权流程。
ICDPPCNEXUS MPC55xx MPC56xx In-Circuit Debugger

ICDPPCNEXUSMPC55xx / MPC56xx In-Circuit DebuggerQuick Start GuideCopyright 2009, P&E Microcomputer Systems, Inc. All rights reserved.Visit us on the web at Document Version HistoryVersion Date Notes1.0 21 Sep 2009 Initial versionCONTENTS1 Introduction (4)1.1 P&E Compatible Hardware (4)2 Getting Started (5)2.1 Connecting to your Target (5)2.2 Reset Script (6)2.3 Loading Data and Debug Information (7)2.4 CPU and Memory Windows (8)3 Debugging (10)3.1 GOTIL command (10)3.1 Stepping through C instructions (11)3.3 Setting and Reaching Breakpoints (12)3.4 Using Code Window Popup Debug Evaluation Hints (13)3.5 Using the Variables Window (15)3.6 Modifying a Variable (16)3.7 Using the Register Interpreter (17)3.8 Adding Register Field Descriptions to the Variables Window (20)1 IntroductionThis document is a step-by-step guide to using the P&E ICDPPCNEXUS in-circuit debugger software, which is compatible with Freescale MPC55xx / MPC56xx processors. This guide covers the most commonly used features of the debugger: loading binary & debug information, accessing CPU registers & memory, stepping code, setting breakpoints, and monitoring variables.1.1 P&E Compatible HardwareThe following lists the P&E hardware compatible with the ICDPPCNEXUS debugger software.P&E Part Number Interface to host PCCABPPCNEXUS Parallel (LPT) portUSB-ML-PPCNEXUS USB 2.0 (Backwards compatible with USB 1.1 ports) Cyclone MAX Serial (RS232) portUSB 1.1 (Upwards compatible with USB 2.0 ports)Ethernet2 Getting Started2.1 Connecting to your TargetUpon starting the debugger, the connection assistant dialog appears:•Use the “Interface” and “Port” drop-down menus to choose the P&E hardware interface connected between the PC and your target board.•The “Target CPU” setting can safely be left at the “Autodetect” setting for most users. If you experience problems connecting, you can try specifying the exact Freescale device that you are connecting to.• A BDM_SPEED parameter between 2 to 4 can typically be used.Processors running at slower clock speeds will require higher values.Click the Connect button, and ICDPPCNEXUS will attempt to contact the processor. Using the default debugger settings, ICDPPCNEXUS will establish communications and reset the processor.After establishing communications, the main debugger screen will appear, and a debugger reset script macro should automatically execute and complete.2.2 Reset ScriptThis section explains the initialization that the debugger, using a reset script macro file, performs on the processor. The user can view and modify all of the macro file's initialization tasks.The processor Boot Assist Module (BAM) would normally initialize the memory of the processor. However, when running the target application from the debugger, the BAM functionality is disabled. To account for this, the debugger must run a script file on reset. The script initializes the memory of the processor similar to the way in which the BAM would initialize the processor.If ICDPPCNEXUS is launched from the Freescale CodeWarrior IDE, the correct reset script file is automatically selected.If ICDPPCNEXUS is launched stand-alone, the reset script file may need to be configured. Several reset script macros are included with the ICDPPCNEXUS debugger and have a .mac extension. For detailed information, you can view each macro file using a simple text editor such as Notepad. The macro contents will contain useful comments, such as which devices are supported by that particular macro.To configure the debugger reset script macro, select the debugger Configuration menu, Automated Script Options dialog, shown here:2.3 Loading Data and Debug InformationIf ICDPPCNEXUS is launched from the Freescale CodeWarrior IDE, your code will automatically be downloaded to the processor.•RAM projects are loaded into the processor’s internal SRAM.•FLASH projects will invoke the CPROGPPCNEXUS Flash programming software to burn the code into the processor’s internal FLASH.The debug information is also automatically loaded from CodeWarrior, which will allow you to debug using your high level source code and variables.If ICDPPCNEXUS is launched stand-alone, you will need to manually download the code and debug information. Launch the Load Dialog by clicking on the High Level Load button on the debugger tool bar:This dialog allows you to specify the binary/debug file and whether to load into RAM or FLASH. Once you are satisfied with your settings, press the “Process Load Command” button to begin the download process. This step will also load the debug information.2.4 CPU and Memory WindowsThe CPU Window displays all CPU core registers, including the Program Counter (PC) and all general purpose registers.•To modify CPU register contents, double-click the register value. You will be prompted for a new value.The Memory Window displays data at any given memory address. It can be used to view RAM contents, FLASH contents, and values of peripheral registers.•To change the memory address, right-click inside the Memory Window and select “Set Base Address”. You will be prompted for a new address to begin displaying data.•To change the contents in memory, double-click the value in memory that you would like to change. You will be prompted for a new value.3 DebuggingThis section outlines the different debugging capabilities available in the ICDPPCNEXUS debugger once the debug information has been loaded.3.1 GOTIL commandAt this point, your source window will show the assembly language startup code generated by the compiler:If you do not need to debug this section and would like to run the processor until the beginning of your “main” function, you can use the “GOTIL” command.•Type “GOTIL main” in the Status window to tell the debugger to run code until it reaches the “main” function of your code.The “GOTIL” command works with any function in your code.3.1 Stepping through C instructionsStep through the initialization code, or any source code, using the high-level language source step command. Use this feature by typing “HSTEP” in the Status window or by clicking the high-level step button on the debugger tool bar:Each time the HSTEP command executes, the debugger will rapidly single step assembly instructions until it encounters the next source instruction, at which point target execution will cease. When the debugger reaches the next source instruction, all visible windows will be updated with data from the board. After reaching the main function, step through several C language instructions. Notice that some instructions will take longer to step through than others because each C instruction may consist of a greater or fewer number of underlying assembly instructions.3.3 Setting and Reaching BreakpointsIn the source code window, there will be a small red dot and a small blue arrow next to each source instruction that has underlying object code. If a large blue arrow appears on a source line, this indicates that the program counter (PC) currently points to this instruction. If a large red stop sign appears on the source line, this indicates that a breakpoint exists on this line.•Set a breakpoint at an instruction by double-clicking the tiny red dot.•To remove a breakpoint, double-click the large red stop sign.Execution will begin in real-time when you issue the HGO command or click the high-level language GO button on the debugger tool bar:If the debugger encounters a breakpoint, execution will stop on this source line. If it does not encounter a breakpoint, target execution will continue until you press a key or use the stop button on the debugger tool bar:•By double clicking the small blue arrow, you will be issuing a GOTIL command to the address of this source line.A GOTIL command will set a single breakpoint at the desired address, and the processor will begin executing code in real-time from the current program counter (PC). When the debugger encounters the GOTIL address, execution stops. If the debugger does not encounter this location, execution continues until you press akey or use the stop button on the debugger tool bar. Note that all user breakpoints are ignored when the GOTIL command is used.You may also double-click the red and blue symbols in the disassembly window. The disassembly window may display an additional symbol, a small, blue "S" enclosed in a box. This indicates that that a source code instruction begins on this disassembly instruction.3.4 Using Code Window Popup Debug Evaluation HintsWhen debugging source code, it is convenient to view the contents of a variable while viewing your source code. The in-circuit debugger has a feature, debug hints, which displays the value of a variable while the mouse cursor is held over the variable name. The hint may be displayed in any of three locations, as shown below.The three locations for the debug hints are the code window title bar, the status window caption bar, and a popup hint that appears over the variable in source code. You can configure the hints to display in any combination.•Set the locations of debug hints in the configuration menu of the debuggerThe information in the popup hint box is similar to the information displayed in the variables window.The information includes the variable name (i), value ($1), and type (signed long).3.5 Using the Variables WindowThe variables window displays the current value of application variables. The following window shows a display of variables from the example application.Variables that are pointer or reference types are displayed in red. Normal variables are displayed in black.•Add a variable by typing the VAR command, by right clicking the variables window and choosing “Add a variable”, or by hitting the "Add Variable"button in the variables window.When adding a variable using the pop-up menu, the debugger displays the following screen.In the variable field, type the address or name of the variable. Typically, set the type of the variable to “Default”, which means that the variable will be displayed as it is defined in the debugging information. When adding a variable, you may specify the numeric display base of the variable.3.6 Modifying a Variable•To modify the current value of a variable, right-click the variable name in the variables window and select “Modify Variable” to display a dialog.Check the “Modify value” checkbox, and type the variable’s new value. After you click the OK button, the debugger updates the variable value on the target, and the debugger refreshes the variable window to display the new value. Note that the debugger will not edit certain user-defined types, such as enumerated types.•You may also modify a variable’s display properties, such as the type or numeric display base using this dialog.3.7 Using the Register InterpreterThe register interpreter provides a descriptive display of bit fields within the processor’s peripheral registers. The register interpreter allows you easily to change the value of these registers. You may quickly check the current state of a peripheral and examine the configuration of the target device.When you use the register interpreter within the debugger, it reads the current value of the peripheral register, decodes it, and displays it.To launch the register interpreter in the debugger, either use the “R” command or click the view/edit register button on the tool bar:A window will appear that allows you to select a peripheral block to examine.Double clicking the module of choice will launch the register selection window.Double clicking a specific register will launch the edit/display window for that register.The window lists the keystrokes and mouse actions, allowing you to modify the values of each of the fields. After right clicking on a specific field, the register interpreter will display all options for that field.When you quit the register view/edit window by hitting the ESC key, you will be given the opportunity to write the new value into the register, as shown in the following window.3.8 Adding Register Field Descriptions to the Variables WindowAdd register bit fields to the variables window by using the “_TR” command in the debugger or by clicking the "Add Register" button in the variables window. After selecting the register field, the field appears in the debugger variables window, and the debugger will continually update its value.。
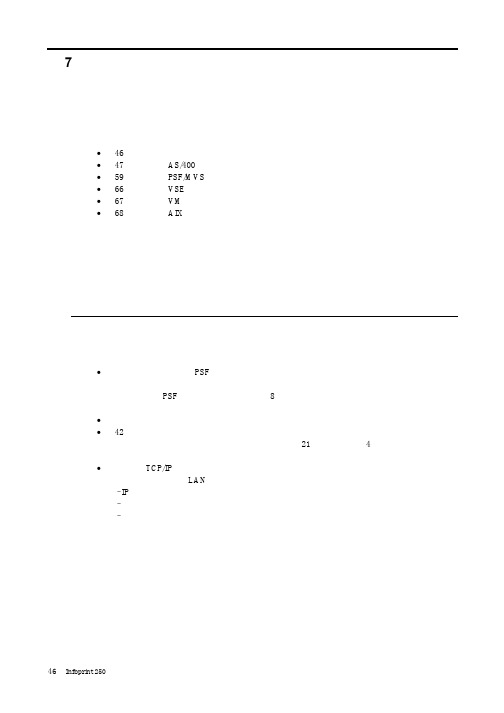
Infoprint 250 導入と計画の手引き 第 7 章ホスト
SUBNETMASK
255.255.255.128
Type of service...............: TOS
*NORMAL
Maximum transmission unit.....: MTU
*LIND
Autostart.....................:
AUTOSTART
*YES
: xx.xxx.xxx.xxx
: xx.xxx.xxx.xxx
*
(
)
IEEE802.3
60 1500
: xxxx
48 Infoprint 250
31. AS/400
IP
MTU
1
1
IPDS TCP
CRTPSFCFG (V3R2)
WRKAFP2 (V3R1 & V3R6)
RMTLOCNAME RMTSYS
MODEL
0
Advanced function printing............:
AFP
*YES
AFP attachment........................:
AFPATTACH
*APPC
Online at IPL.........................:
ONLINE
FORMFEED
*CONT
Separator drawer......................:
SEPDRAWER
*FILE
Separator program.....................:
SEPPGM
*NONE
Library.............................:
锐捷路由器配置手册

锐捷路由器配置手册目录:路由器基础:路由器的几种配置方法控制台远程登录其它配置方法命令行(CLI)操作命令模式%命令模式的切换CLI命令的编辑技巧常见CLI错误提示使用no 和default 选项配置文件的保存、查看与备份查看配置文件保存配置文件删除配置文件备份配置文件文件系统`文件系统概述文件操作目录操作系统文件的备份与升级搭建环境用TFTP传输文件用Xmodem传输文件ROM监控模式密码丢失的解决方法路由器的基本配置:#配置主机名配置口令配置控制台口令配置远程登录口令配置特权口令配置以太网接口以太网接口的一般配置配置多个IP地址配置MAC地址接口信息的查看(配置同步串行口同步串行口的一般配置配置反转时钟配置链路封装协议配置线路编解码方式忽略DCD信号接口信息的查看配置回环接口回环接口的配置接口信息的查看》配置路由:静态路由和缺省路由的配置配置静态路由配置默认路由配置缺省网络配置可被动态路由覆盖的静态路由RIP协议的配置RIP协议的一般配置RIP协议参数的配置OSPF协议的配置—OSPF协议的一般配置广域网协议配置:配置接口的HDLC封装配置keepalive时间PPP协议配置配置接口的PPP封装配置PPP协商超时时间配置CHAP验证配置CHAP服务端(配置CHAP客户端配置双向CHAP验证配置PAP验证配置PAP服务端配置PAP客户端配置双向PAP验证帧中继协议配置点到点的帧中继配置点到点子接口的帧中继配置NAT的配置:/静态NAT配置静态NAT的配置静态NAPT的配置动态NAT的配置动态NAPT的配置接口动态NAPT的配置重叠地址NAT配置外部源地址的静态NAT配置外部源地址的动态NAT配置~TCP负载均衡NAT信息的查看DHCP的配置:DHCP服务器的配置启用DHCP服务器配置DHCP地址池配置选项配置DHCP地址绑定DHCP中继代理的配置访问控制列表的配置:(标准访问控制列表的配置标准ACLs的语句规则配置标号的标准ACLs配置命名的标准ACLs扩展访问控制列表的配置扩展ACLs的语句规则配置标号的扩展ACLs配置命名的扩展ACLsMAC扩展访问列表的配置MAC扩展ACLs的语句规则|配置标号的MAC扩展ACLs 配置命名的MAC扩展ACLs Expert扩展访问列表的配置Expert扩展ACLs的语句规则配置标号的Expert扩展ACLs 配置命名的Expert扩展ACLs 其它形式的访问列表带序号的ACLs带时间区的ACLs,第一部分路由器基础:路由器的几种配置方法控制台用一台计算机作为控制台和网络设备相连,通过计算机对网络设备进行配置。
一种基于SRV6技术开展时延敏感算力业务调度的方法

一种基于SRV6技术开展时延敏感算力业务调度的方法【摘要】为满足云网融合等业务的发展需求,建设优质高效的网络,为高价值用户提供差异化服务,保证各类业务的服务质量,河北移动建设了省内云专网。
为保障政企专线、云网专线等高价值业务对QoS保障方面的要求,云专网建设同步引入了SDN、SRv6-TE等技术,可以实现基于SDN的流量调度应用,减少拥塞、并提高链路利用率,增加运维效率。
通过对省内云专网不同链路时延进行端到端的分析,计算出时延较短的路径并据此建立SRv6隧道,并通过BGP-FLowSpec进行引流,确保时延敏感业务流量按需走到低时延路径上,达到提升用户体验的目的。
【关键词】SDN;SRV6;BGP-FLowSpec;算力;云专网;IP工作台一、云专网网络概述河北移动目前根据《中国移动省内云专网建设指导意见》完成了河北省内云专网的建设工作,其中组网规划采用了云网设备异局址成对设置,“口字型”接入的组网方式。
为实现流量精准调度,云专网省内网不部署链路捆绑。
并配合传输层面云网PE所在局址(机楼)应具备至少2 条不同出局路由光缆;从而使河北移动省内云专网的组网架构可以在不同节点间呈现多条不同质量的链路,为时延敏感算力业务调度具备了网络调度的基础。
图1-1 河北移动云专网示意图二、网络调度的基本原理河北移动在云专网建设同期规划建设了IP运维工作台,使用网络云内资源部署SDN控制器,通过CMNET打通各地市云网PE到SDN控制器的网络,实现SDN 控制器与地市云网PE路由器对接;通过SNMP/Telemetry协议监测云网PE运行状态,设备故障后第一时间发出告警;SDN控制器通过BGP-LS采集网络信息、路由、SRv6 SID、SRv6 Policy状态等信息,生成完整的网络拓扑,同时使用Telemetry采集TWAMP测量结果,实时采集网络中各链路质量,完成网络状态的可视化展示。
三、基于时延敏感业务的调度方法实现本方案利用河北移动云专网具备相关基础协议,采用L3VPNv4 over SRv6 TE Policy方式完成。
- 1、下载文档前请自行甄别文档内容的完整性,平台不提供额外的编辑、内容补充、找答案等附加服务。
- 2、"仅部分预览"的文档,不可在线预览部分如存在完整性等问题,可反馈申请退款(可完整预览的文档不适用该条件!)。
- 3、如文档侵犯您的权益,请联系客服反馈,我们会尽快为您处理(人工客服工作时间:9:00-18:30)。
In the upper frame: Start -> Equipment & Systems -> Structure Discipline -> Structure Detail Object Design
Structure Detail Object Design 1. Plane System 2. Plane System Grid 3. Plate 4. Stiffener 5. Stiffener On Free Edge 6. Functional Beam 7. Opening 8. Split Plate 9. Split Stiffener 10. Slot
Structure Design
In the upper frame: Start Mechanical Design
Copyright DASSAULT SYSTEMES 2005
9
Workbench Description SDD:
The Structure
Detail Object Design workbench is located:
Structure Detail System Design 1. Design Unit 2. Split by Volume 3. Structure Object Relationships
Command Piece Part Generator:
The Piece
Part Generator is in the SR1 workbench, this workbench is located:
Copyright DASSAULT SYSTEMES 2005
8
Workbench Description SDD:
The Structure
Detail System Design workbench is located:
In the upper frame: Start -> Equipment & Systems -> Structure Discipline -> Structure Detail System Design
Structure Functional System Design 1. Structure System 2. Structure Object Relationships 3. Functional Volume Set 4. Planning Break Preparation
Copyright DASSAULT SYSTEMES 2005
Copyright DASSAULT SYSTEMES 2005
10
Settings and General Information
The Contextual Menu will be referred to many times throughout this training. This page will show how to obtain this menu.
The Structure
Functional System Design workbench is located:
In the upper frame: Start -> Equipment & Systems -> Structure Discipline -> Structure Functional System Design
The Structure Functional Design Object Workbench is working at Part level, like Generative Shape Design.
Copyright DASSAULT SYSTEMES 2005
6
Workbench Description SFD:
Structure Functional Object Design 1. Plane System 2. Plane System Grid 3. Structure Object Relationships 4. Plate 5. Stiffener 6. Stiffener On Free Edge 7. Opening 8. Beam 9. Split Plate 10. Split Stiffener 11. Functional Volume
42
48
53
59 62 64 66 69
73 76 79 85 86
Copyright DASSAULT SYSTEMES 2005
2
Settings and General Information
Setting up the SFD/SDD environment
Select Tools + Options… (Upper Frame) Switch to: Infrastructure + Part Infrastructure. Under the External References enable: Keep link with selected object Switch to: Parameter and Measure + Units Set the units to Millimeters From the Start menu select: Structure Functional System Design Select the proper PRM file: Tools Project Management
Select a Project
1
4
Select Browse tab button Once a project selected, the Browse Tab shows all the resources associated to the discipline .
3
Resources associated to the project
Workbench Description SFD:
The Structure
Functional Object Design workbench is located:
In the upper frame: Start -> Equipment & Systems -> Structure Discipline -> Structure Functional Object Design
Workbench Description Settings and General Information Workshop Objectives Exercise 1 – Functional Structure System Exercise 2 – Plane System 1. Plane System Exercise 3 – Plate 1. Material Information 2. Creating a Shell 3. Creating Bulkheads 4. Samples of Multi Placement Syntax 5. Creating Decks Exercise 4 – Stiffener 1. Plane System Grid 2. Stiffener Placement 3. Start and End Limits 4. Stiffener Modification 5. Copy/Paste Exercise 5 – Opening 1. Opening on Plates 2. Opening using 3D objects 3. Opening on Stiffeners 4. Copy/Paste 3 7 8 9 13 15
1.
Right click on any branch of the Specification Tree. As you can see in the adjoining pictures a menu is displayed, this is referred to as the Contextual menu. Depending on what branch of the tree is selected, will determine what options are available from the Contextual menu.
25
36
Exercise 6 – StiffenerOnFreeEdge 1. StiffenerOnFreeEdge options 2. Entire Area 3. Limited Area Exercise 7 – Beam 1. Pillars 2. Pillar Modification 3. Point to Point 4. Guide Curve Exercise 8 – Split Plate / Split Stiffener 1. Split Plate 2. Split Stiffener Exercise 9 – Creating Block Geometry Exercise 10 – Functional Volume Set Exercise 11 – Planning Break Preparation Exercise 12 – Split By Volume Exercise 13 – Defining the Details End Cuts Slots Exercise 14 – Reporter Exercise 15 – Drawing Production Exercise 16 – Structural Object Relationships Exercise 17 – Piece Part Generator User Interface Overview