09年8月22日雅思图表作文原题重现(配高分范文)
09年8月22日雅思图表作文原题重现(配高分范文)
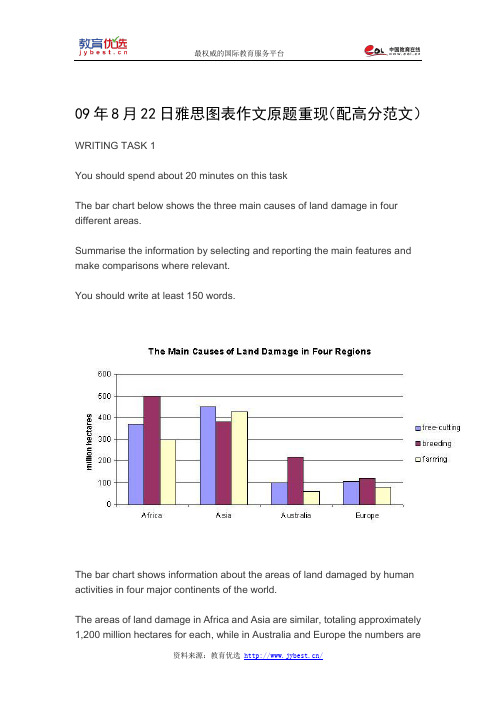
09年8月22日雅思图表作文原题重现(配高分范文)WRITING TASK 1You should spend about 20 minutes on this taskThe bar chart below shows the three main causes of land damage in four different areas.Summarise the information by selecting and reporting the main features and make comparisons where relevant.You should write at least 150 words.The bar chart shows information about the areas of land damaged by human activities in four major continents of the world.The areas of land damage in Africa and Asia are similar, totaling approximately 1,200 million hectares for each, while in Australia and Europe the numbers areconsiderably lower, averaging between 300 and 400 million.Looking at the causes behind land damages, we can see that in Africa, Europe and especially Australia, breeding is the leading cause of land loss, damaging approximately 500, 100 and 400 million hectares of land respectively. Next comes tree-cutting which takes away slightly larger areas of land than farming in all the three regions.Asia shows a slightly different picture, where tree-cutting activities have led to the largest amount of land loss (450 million hectares). Breeding and farming account for the remaining damage, (380 and 420 million hectares respectively).Overall, breeding causes the most pervasive damage to land around the world。
雅思 图表作文写作技巧范文

声明:本讲义为GARY 呕心制作,GARY 享有独家版权,禁止转发、出售本讲义或将其用于其他商业用途!Task1 图表作文写作技巧(一)一、认识图表作文20 分钟 150 单词,占写作考试总分值的三分之一,描述一个或几个图表。
线性图(line graph/chart );柱状图(bargraph/chart );饼状图(pie graph/chart );表格( table );流程图(process diagram ) Table:Fig. 1 Pie chart and line graph: sales and share prices for Coca-ColaFig.2 Preferred leisure activities of Australian childrenFig. 3 Underground Railways Systems in Six Cities二、图表作文审题要素1. 描述对象整个图表的数据都是针对描述对象的。
图表的上方标题一般会指示描述对象。
弄清描述对象非常重要,因为在行文时,需要频繁地用到它。
如:sales of Coca Cola,share price of Coca Cola,the preferred leisure activities of Australian kids aged 5-14, wages growth rate。
2. 描述单位对于有 X 轴(horizontal axis)和 Y 轴(vertical axis)的图表,描述单位一般在 Y 轴以符号的形式标明。
弄清描述单位对于数据的准确描述非常关键,把握不准的话就容易被当做跑题。
一般要弄清数字 ( number )和百分比( percentage; proportion )的区别。
另外,记住几个常用的单位缩写符号:$:dollarbn:billionm: million 或 metrekm: kilometre%: percentage / proportion 区别: per cent,000s: thousand比如,第一页的描述单位: bottle / percentage (pie chart), dollar (line chart), percentage (bar chart) 三、图表作文标准结构Part 1 开头段,介绍写作目的,需包含四个要素:图表类型主要描述动词describe,show,present,depict,indicate,representcompare / make a comparison between …描述对象背景信息(地点 + 时间)例如:The line graph gives some detailed information about the wages growth rate of some country over adecade from 1993 to 2003.The pie charts below show the percentage of men and women who smoked in Australia during a 40-yearperiod, between 1960 and 2000.Part 2 主体段:1 + N 结构1: 一句话概括总趋势或总特征( general trend or feature )套句:… have shown striking changes/differences.N: N 段 ( N≥1 )细节描述( striking trends or features )Part 3 结尾段结尾段给出结论。
雅思英语图表作文范文(必备3篇)

雅思英语图表作文范文第1篇A类雅思各类图表作文要点及范文一.曲线图解题关键1曲线图和柱状图都是动态图,解题的切入点在于描述趋势。
2在第二段的开头部分对整个曲线进行一个阶段式的总分类,使写作层次清晰,同时也方便考官阅卷。
接下来再分类描述每个阶段的specifictrend,同时导入数据作为分类的依据。
3趋势说明。
即,对曲线的连续变化进行说明,如上升、下降、波动、持平。
以时间为比较基础的应抓住“变化”:上升、下降、或是波动。
题中对两个或两个以上的变量进行描述时应在此基础上进行比较,如变量多于两个应进行分类或有侧重的比较。
4极点说明。
即对图表中最高的、最低的点单独进行说明。
不以时间为比较基础的应注意对极点的描述。
5交点说明。
即对图表当中多根曲线的交点进行对比说明。
6不要不做任何说明就机械地导入数据,这不符合雅思的考试目的。
曲线图常用词汇动词—九大运动趋势一:表示向上:increase,rise,improve,grow,ascend,mount,aggrandize,goup,climb, take off, jump,shoot up暴涨,soar,rocket, skyrocket雅思英语图表作文范文第2篇It is said that countries are becoming similar to each other because of the global spread of the same products, which are now available for purchase almost anywhere. I strongly believe that this modern development is largely detrimental to culture and traditions worldwide.A country’s history, language and ethos are all inextricably bound up in its manufactured artefacts. If the relentless advance of international brands into every corner of the world continues, these bland packages might one day completely oust the traditional objects of a nation, which would be a loss of richness and diversity in the world, as well as the sad disappearance of t he manifestations of a place’s character. What would a Japanese tea ceremony be without its specially crafted teapot, or a Fijian kava ritual without its bowl made from a certain type of tree bark?Let us not forget either that traditional products, whether these be medicines, cosmetics, toy, clothes, utensils or food, provide employment for local people. The spread of multinational products can often bring in its wake a loss of jobs, as people urn to buying the new brand,perhaps thinking it more glamorous than the one they are used to. This eventually puts old-school craftspeople out of work.Finally, tourism numbers may also be affected, as travelers become disillusioned with finding every place just the same as the one they visited previously. To see the same products in shops the world over is boring, and does not impel visitors to open their wallets in the same way that trinkets or souvenirs unique to the particular area too.Some may argue that all people are entitled to have access to the same products, but I say that local objects suit local conditions best, and that faceless uniformity worldwide is an unwelcome and dreary prospect.Heres my full answer:The line graphs show the average monthly amount that parents in Britain spent on their children’s s porting activities and the number of British children who took part in three different sports from 2008 to is clear that parents spent more money each year on their children’s participation in sports over the six-year period. In terms of the number of children taking part, football was significantly more popular than athletics and 2008, British parents spent an average of around £20 per month on their children’s sporting activities. Parents’ spending on children’s sports increased gradually over the followi ng six years, and by 2014 the average monthly amount had risen to just over £ at participation numbers, in 2008 approximately 8 million British children played football, while only 2 million children were enrolled in swimming clubs and less than 1 million practised athletics. The figures for football participation remained relatively stable over the following 6 years. By contrast, participation in swimming almost doubled, to nearly 4 million children, and there was a near fivefold increase in the number of children doing athletics.剑桥雅思6test1大作文范文,剑桥雅思6test1大作文task2高分范文+真题答案实感。
完整版)雅思经典图表作文范文
完整版)雅思经典图表作文范文XXX in fast food and sit-down restaurants.As can be seen from the charts。
XXX over the years。
In 1970.only 25% of a family's food budget was spent on eating out。
but this figure rose to almost 50% in 2000.This trend is likely dueto the XXX.The graph shows that the number of meals eaten in fast food restaurants has increased significantly compared to sit-down restaurants。
In 1980.the average person ate 20 meals in fast food restaurants and 60 meals in sit-XXX。
by 2000.the average person ate 60 meals in fast food restaurants and only 20 meals in sit-XXX fast-XXX society。
XXX.XXX。
XXX a negative one。
as it allows XXX。
it is XXX.Over the past three decades。
XXX。
In 1970.only 10% of the food budget was XXX。
but by 1980.this had increased to 15%。
In 1990.the pXXX 35%。
and in 2000.it rose again to 50%。
The n of family restaurant meals has also changed over the years。
2009全年雅思写作真题与考试点评
2009年雅思写作真题汇总2009,1.15写作:Task 1:sand dunes的形成流程图给出了sand particles, wet sand, dry sand和wind.一共三个图,最上面是单一方向的风吹沙子颗粒,沙子被风吹起来,落地上之后,在潮湿的地方(wet land被附着住)形成一个圆锥形沙丘,而不存留在干燥的地方。
最下面图是风继续吹把沙丘上的颗粒吹向了另一个Wet land也就是沙丘的飘移Task 2.Some people think students at school and university can learn more from teachers and lessons than from TV and the Internet. To what extent do you agree or disagree?课堂教育比网络教育好,是否同意?(教育类)2009,1,17写作:T ask1:常规图,2个图,对比NY和LONDON的police officers and crimes的数量,还有之间的关系。
Two line charts are the number of officers and the numbers of crimes in London and in New Y ork between 1990-2002.T ask2:Nowadays, people in some countries can choose to live and work anywhere they want, because of the improvement of the communication technology and transport. Compare disadvantages and advantages. 交流技术和交通方式的改善可以使得人们在任何地方工作学习,你在多大程度上认为利大于弊?(科技类)09,2,21作文:T ask1.3个饼图,these charts below show the proportion of main regions of exports from three Latin, American countries.T ask2: Some think that these environmental problems are too big for individuals to be solved, while others think that individuals cannot solve these environmental problems unless they make09,2,28写作:Task1: four car manufacturers(Nissan,Ford,DC,GM)vehicle production time changed between 1998 and 2002曲线图,比较四家公司在1998年至2002年生产一辆汽车所花时间的变化。
日雅思图表作文原题重现(配高分范文)

日雅思图表作文原题重现(配高分范文)————————————————————————————————作者:————————————————————————————————日期:09年8月22日雅思图表作文原题重现(配高分范文)WRITING TASK 1You should spend about 20 minutes on this taskThe bar chart below shows the three main causes of land damage in four different areas.Summarise the information by selecting and reporting the main features and make comparisons where relevant.You should write at least 150 words.The bar chart shows information about the areas of land damaged by human activities in four major continents of the world.The areas of land damage in Africa and Asia are similar, totaling approximately1,200 million hectares for each, while in Australia and Europe the numbers are considerably lower, averaging between 300 and 400 million.Looking at the causes behind land damages, we can see that in Africa, Europe and especially Australia, breeding is the leading cause of land loss, damaging approximately 500, 100 and 400 million hectares of land respectively. Next comes tree-cutting which takes away slightly larger areas of land than farming in all the three regions.Asia shows a slightly different picture, where tree-cutting activities have led to the largest amount of land loss (450 million hectares). Breeding and farming account for the remaining damage, (380 and 420 million hectares respectively).Overall, breeding causes the most pervasive damage to land around the world。
剑桥雅思9真题及解析Test2写作
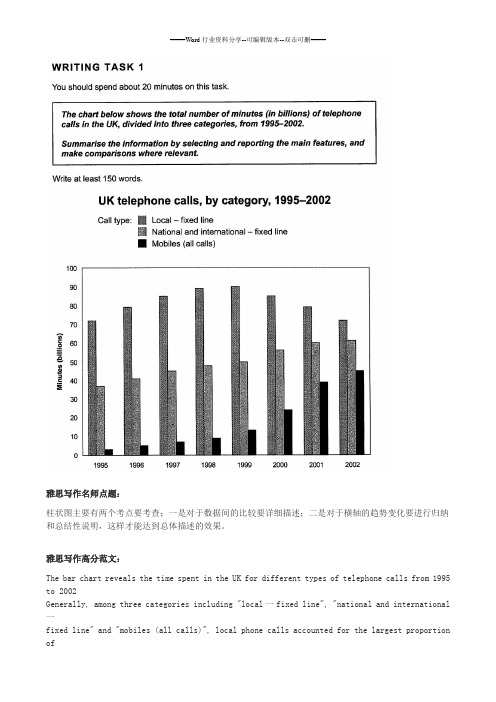
雅思写作名师点题:柱状图主要有两个考点要考查;一是对于数据间的比较要详细描述;二是对于横轴的趋势变化要进行归纳和总结性说明,这样才能达到总体描述的效果。
雅思写作高分范文:The bar chart reveals the time spent in the UK for different types of telephone calls from 1995 to 2002Generally, among three categories including "local一fixed line", "national and international 一fixed line" and "mobiles (all calls)", local phone calls accounted for the largest proportion ofall usage, ranging from 70 to 90 billion minutes. Next to it, national and international ones tookthe second position standing at 38 to 60 million minutes. obviously, the mobiles took up the smallest part (3 to 40 billion minutes).The trends of the telephone usage changed during the 8 years. The local phone calls peaked at 90 billion minutes in 1999, and then started to decline to the 1995 figure in 2002 (70 billion). However, the trends of the other two kept increasing. National and international calls rose steadily from 38 billion to 61 billion. The most noticeable change was the trend of cellphones, which soared from 2 billion in 1995 to about 46 billion in 2002.In sum, people used local fixed line most in the UK, and the mobiles were becoming increasingly popular.结构分析:范文由四段组成:第一段为引言段,主要介绍该图标展示的是什么方面的信息;第二段对三个柱状结构的大小情况进行了比较;第三段对横轴时间趋势进行描述;最后一段对图表体现出来的总体特点进行归纳。
8月22日雅思阅读考题回顾

8月22日雅思阅读考题回顾雅思阅读考题回顾考试日期2009.6.20Passage 1Title:珍珠的种类制作和历史Question types:Which paragraph contains the following statement? T/F/NG; Summary with list of words大致内容关于pearl 第一段先说pearl在古代是富贵和地位的象征,在古罗马是怎怎怎的,在波斯还被当成可以医治百病的药(后面有一题问哪个国家提及古代被用于药学就是波斯啦,另外有一个说哪一段提及ancient customer也就是第一段A)。
第二段说pearl分三类,natural,cultural和imitation,也就是fake,然后说了natural pearl 的很多特点。
第三段说cultural pearl与natural不同的地方。
第四段说natural pearl的form和很多因素有关,说明natural pearl很不容易得到。
之后说cultural pearl就好产很多。
第五段说cultural pearl 的培养分为盐水培育和淡水培育,盐水培育质量一般比较高,淡水培育也有部分质量比较高的。
第六段说除了这两种以外,还有的一种在那个什么地方有专门产fake pearl,很好看而且便宜,这三种pearl用没有经过训练的肉眼是分不出来的,只有在某种光下才看得出来,cultural 的核(core)比natural 大,然后说pearl的价值与size和光泽度有关,说非洲的pearl是世界上最大的,但是光泽度不如Japan的,但是Japan的很小的,所以最后还是African pearl更贵。
最后说,曾经在波斯湾的一个B开头的地方是产natural pearl最大的地方,后来怎么就停了,现在India是做cultural pearl 最负盛名的地方。
Passage 2Title:人类记忆力Questiontypes:People’s view point matching; Multiple choice; Summary大致内容记忆时候与年龄有关大致是说,一开始人们以为老人的脑功能随着年龄增长衰退了,就不如年轻人了,后来做了一些脑功能测试,发现虽然老人的大脑结构已经和年轻人的天差地别了,但是,老人的测试成绩并不比年轻人差,只是完成相同任务用的脑功能不同罢了。
- 1、下载文档前请自行甄别文档内容的完整性,平台不提供额外的编辑、内容补充、找答案等附加服务。
- 2、"仅部分预览"的文档,不可在线预览部分如存在完整性等问题,可反馈申请退款(可完整预览的文档不适用该条件!)。
- 3、如文档侵犯您的权益,请联系客服反馈,我们会尽快为您处理(人工客服工作时间:9:00-18:30)。
09年8月22日雅思图表作文原题重现(配高分范文)
WRITING TASK 1
You should spend about 20 minutes on this task
The bar chart below shows the three main causes of land damage in four different areas.
Summarise the information by selecting and reporting the main features and make comparisons where relevant.
You should write at least 150 words.
The bar chart shows information about the areas of land damaged by human activities in four major continents of the world.
The areas of land damage in Africa and Asia are similar, totaling approximately 1,200 million hectares for each, while in Australia and Europe the numbers are
considerably lower, averaging between 300 and 400 million.
Looking at the causes behind land damages, we can see that in Africa, Europe and especially Australia, breeding is the leading cause of land loss, damaging approximately 500, 100 and 400 million hectares of land respectively. Next comes tree-cutting which takes away slightly larger areas of land than farming in all the three regions.
Asia shows a slightly different picture, where tree-cutting activities have led to the largest amount of land loss (450 million hectares). Breeding and farming account for the remaining damage, (380 and 420 million hectares respectively).
Overall, breeding causes the most pervasive damage to land around the world。