Thin Layer Chromatographic Analyses
TLC薄层层析技术经验交流
展开方法
展开剂浸入薄层下端高度不应超过 0.5cm,当心将样品带被展开剂浸泡 硬板可以进行近水平、上行、下行、双向、多次展开等 展开槽有直立式、平卧式、双槽式、夹心式或水平式
Note:
a.展开槽应密闭。溶剂蒸气、液相( 展开剂)、固定相 ( 吸附剂) 一起构成复杂的三维层析过程
Note:
a.展开剂浑浊不清,应分液澄清后
b.正丁醇和丙醇对斑点扩散影响较小
c.丙酮可混溶溶剂,降低剂粘度,加快展速
d.由于混溶性和硅胶耐酸能力的限制,水和酸的使 用是有限度的。
nBuOH/aceton e/AcOH/H2O
VB1及其磷酸酯
nPrOH/NH3H2O (con.)/H2O =20/20/1
b.展缸预先饱和以减弱边缘效应,如果薄层板也同时 预饱和效果更佳。
c.点样带宽时(常见制备板)。先用大极性溶剂展2cm 以浓集样品,干燥薄层板,再用所需展开剂展开。
展开剂的选择原则
① 使各成分间有较好的分离; ② Rf在0.2~0.8为有效;监控点应在0.4~0.6之间 ③ 不与待测组分发生化学反应; ④ 沸点适中,黏度较小; ⑤ 展开后组分斑点圆且集中; ⑥ 混合溶剂最好新鲜配制;
Note: a. 点样量 c.留样对照
b.检测时间 d. 重要板留存
32
检测时机
反应物加完应立即检测;反应中出现变化(温度,颜色, 气体、沉淀)立即检测 反应物加完后半小时内应检测,然后适时跟踪检测 快速反应的体系(如硝化、还原),在短时间内需要检测 过夜反应,过夜前后应检测
33
官能团转化
极性增大:
红、桃红或棕色斑点
氨基酸、多肽
香草醛/硫酸
香草醛1g溶于硫酸lOOml。喷后于120℃加热 高级醇、酚、甾类及精
色谱学 第三章 薄层色谱

在吸附色谱过程中,溶质、溶剂和吸附剂三 者是相互联系而又相互竞争的,如此构成了 整个层析分离过程 。 在薄层吸附色谱过程中,主要为物理吸附, 无选择性。因之吸附剂与多元组分溶液接触 时,一方面任何溶质都可被吸附(当然单位 重量吸附剂所能吸附物质的量,即“吸附量” 会因物质种类而异),另一方面,吸附剂也 可吸附流动相分子。由于物理吸附是可逆的, 故被吸附的分子同时也可被解吸出来。
偶氮染料 偶氮苯 对甲氧基偶氮苯 苏丹黄 苏丹红 对氨基偶氮苯 对羟基偶氮苯
Ⅱ 0.61 0.28 0.18 0.11 0.04 0.01
表3-2 硅胶活度分级法 Rf Ⅲ Ⅳ 0.70 0.83 0.43 0.67 0.30 0.53 0.13 0.40 0.07 0.20 0.01 0.07
除上二种外,还有其他一些吸附剂。吸附剂品种如下: (1)硅胶:薄层色谱用为200~250目粒度,规格很多,一般如有石膏作粘 结剂,称硅胶G;石膏含量为5~20%,一般为10~13%,亦有用淀粉作粘 结剂的,称硅胶S,不加粘结剂者称硅胶H或硅胶N,为了便于观察组分的 斑点,也可在硅胶中加入荧光指示剂。如果又加有粘结剂时,则称为硅胶 GF或硅胶GF254,即吸收254nm紫外光。 (2)氧化铝:根据加有粘结剂情况不同,有H、G、HF、GF等品种。 (3)硅镁吸附剂:即费罗里硅土,使用前要在130℃下活化二小时。 (4)纤维素:长度仅为2~20微米的短纤维,分天然纤维和微晶纤维两种 形式,也可加粘合剂、一般用于亲水性物质的分离,如羟基化物等,但缺 点为不能用浓硫酸等腐蚀性溶剂进行显色。 (5)聚酰胺:这是一种使用广泛的有机吸附剂,多用于分离酚类化合物, 样品容量大,但粘结能力差,可加入纤维素或淀粉作粘结剂。 (6)烧结薄层板:这是一种多次使用的薄层板,是由200~300目石英或玻 璃粉,与200~300目硅胶或氧化铝按1:25重量混合,用乙醇调成浆料,涂 在玻璃板上。0.25~0.3毫米厚,然后在700~780℃高温下烧结,即成烧结板。 烧结板用一次后可用乙醇或其它有机溶剂洗涤,最后用水洗干净后烘干再 继续使用。
实验 -薄层色谱法

2021/3/24
A
1
目的和要求
1. 了解色谱分离的原理及其应用。 2. 初步掌握薄层色谱的操作技能。
2021/3/24
A
2
色谱法概述
1938年俄国人首先实现了在氧化铝薄层上分离 一种天然药物。1965年德国化学家出版了“薄层色 谱法”一书,推动了这一技术的发展。
2021/3/24
A
14
有机化学中的应用
* 分离混合物: 一些结构类似、理化性质也相似的化合物组成的
混合物,一般应用化学方法分离很困难,但应用色谱 法分离,有时可得到满意的结果。 * 精制提纯化合物:
有机化合物中含有少量结构类似的杂质,不易除 去,可利用色谱法分离以除去杂质,得到纯品。
A
15
* 鉴定化合物: 在条件完全一致的情况,纯粹的化合物在薄层
3
5
Ⅲ
8
15
Ⅳ
10
25
Ⅴ
15
38
2021/3/24
A
11
洗脱剂(流动相):
也称展开剂,在色谱过程中起到将吸附 在固定相上的样品洗脱的作用。
乙酸>吡啶>水>醇类(甲醇>乙醇>正丙醇)>丙酮> 乙酸乙酯>乙醚>氯仿>二氯甲烷>甲苯>环己烷>正 己烷>石油醚
* 从前到后-洗脱能力降低。
2021/3/24
展开剂:9: 1石油醚/乙酸乙酯
A
20
点样操作:
1.可利用铅笔画一条线;
2.样品溶液要点在 0.7-0.8 mm 处;
3.采用多次点样时,应待前一次 点
加的溶剂挥发后再进行;
生物样品的常用分析方法

气相色谱法 (gas chromatography,GC) 缺点:
要求被测药物及其代谢物必须具有一定的 挥发性和热稳定性。
解决方法:
固定相发展和衍生化试剂的广泛使用,使 生物样品不再受限制。
www。themegallery。
气相色谱法 (gas chromatography,GC)
www。themegallery。
高效液相色谱法
液-固吸附色谱法 液-液分配色谱法 离子交换色谱法
分 离 方 法
凝胶排阻色谱法
www。themegallery。
高效液相色谱法 色谱分离方法的选择 主要根据是样品的相对分子质量 的大小,在水中和有机溶剂中的溶解 度,极性和稳定程度以及化学结构等 物理、化学性质。
体内药物分析是借助于现代化的仪器 与技术来分析药物在体内数量与质量的变 化,以获得药物在体内的各种药代动力学 参数、代谢方式、代谢途径等信息。目前, 用于生物样品分析的方法有很多,归纳起 来主要有以下几类:
www。themegallery。
生物样品的常用分析方法
1. 色谱分析法 2. 光谱分析法
3. 免疫分析法
www。themegallery。
荧光分析法 (三)荧光探针分析法
(Fluorescence method) 局限 衍生化增加分析 步骤,易引入分析 使用荧光探针从无荧光的药物制备有荧光 误差。 的衍生物。
优点
1
2
3
增强待分析 物质的荧光 响应,提高 检测灵敏度 和选择性。
稳定分析物, 有助于化合 物基团的确 尤其针对活 证。 泼的和有挥 发性的化合 物。
www。themegallery。
高效液相色谱法 一、相对分子质量
色谱术语中英对照
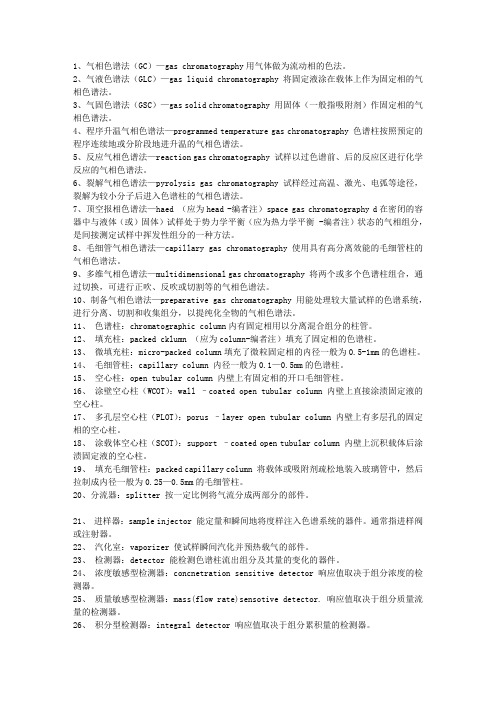
1、气相色谱法(GC)—gas chromatography用气体做为流动相的色法。
2、气液色谱法(GLC)—gas liquid chromatography 将固定液涂在载体上作为固定相的气相色谱法。
3、气固色谱法(GSC)—gas solid chromatography 用固体(一般指吸附剂)作固定相的气相色谱法。
4、程序升温气相色谱法—programmed temperature gas chromatography 色谱柱按照预定的程序连续地或分阶段地进升温的气相色谱法。
5、反应气相色谱法—reaction gas chromatography 试样以过色谱前、后的反应区进行化学反应的气相色谱法。
6、裂解气相色谱法—pyrolysis gas chromatography 试样经过高温、激光、电弧等途径,裂解为较小分子后进入色谱柱的气相色谱法。
7、顶空报相色谱法—haed (应为head -编者注)space gas chromatography d在密闭的容器中与液体(或)固体)试样处于势力学平衡(应为热力学平衡 -编者注)状态的气相组分,是间接测定试样中挥发性组分的一种方法。
8、毛细管气相色谱法—capillary gas chromatography 使用具有高分离效能的毛细管柱的气相色谱法。
9、多维气相色谱法—multidimensional gas chromatography 将两个或多个色谱柱组合,通过切换,可进行正吹、反吹或切割等的气相色谱法。
10、制备气相色谱法—preparative gas chromatography 用能处理较大量试样的色谱系统,进行分离、切割和收集组分,以提纯化全物的气相色谱法。
11、色谱柱:chromatographic column内有固定相用以分离混合组分的柱管。
12、填充柱:packed cklumn (应为column-编者注)填充了固定相的色谱柱。
TLC

2.2.27. THIN-LAYER CHROMATOGRAPHY薄层色谱技术是一种分离技术,它从包含一种固定项的特定材料扩展到在载体(板)包括玻璃,金属,塑料表面形成统一的薄层。
分析物的溶液被吸附在载板的前端。
分离是溶质(分析物溶液)在合适的溶剂或混合溶剂(流动相)中,在薄层(固定相)上进行吸附,分配,离子交换或这些方式的组合进行移动(展开)来实现的。
Thin-layer chromatography is a separation technique in which a stationary phase consisting of an appropriate material is spread in a uniform thin layer on a support (plate) of glass, metal or plastic. Solutions of analytes are deposited on the plate prior to development. The separation is based on adsorption, partition, ion-exchange or on combinations of these mechanisms and is carried out by migration (development) of solutes (solutions of analytes) in a solvent or a suitable mixture of solvents (mobile phase) through the thin-layer (stationary phase).原理APPARATUS色谱板,这种色谱方式是在试剂(4.1.1)中所述预涂板上进行的。
Plates. The chromatography is carried out using pre-coated plates as described under Reagents (4.1.1).色谱板的预处理。
tlc薄层色谱教程 全

Thin Layer Chromatography.Thin layer chromatography, or TLC, is a method for analyzing mixtures by separating the compounds in the mixture. TLC can be used to help determine the number of components in a mixture, the identity of compounds, and the purity of a compound. By observing the appearance of a product or the disappearance of a reactant, it can also be used to monitor the progress of a reaction. TLC is a sensitive technique - microgram (0.000001 g) quantities can be analyzed by TLC - and it takes little time for an analysis (about 5-10 minutes).TLC consists of three steps - spotting, development, and visualization. Photographs of each step are shown on the course website. First the sample to be analyzed is dissolved in a volatile (easily evaporated) solvent to produce a very dilute (about 1%) solution. Spotting consists of using a micro pipet to transfer a small amount of this dilute solution to one end of a TLC plate, in this case a thin layer of powdered silica gel that has been coated onto a plastic sheet. The spotting solvent quickly evaporates and leaves behind a small spot of the material.Development consists of placing the bottom of the TLC plate into a shallow pool of a development solvent, which then travels up the plate by capillary action. As the solvent travels up the plate, it moves over the original spot. A competition is set up between the silica gel plate and the development solvent for the spotted material. The very polar silica gel tries to hold the spot in its original place and the solvent tries to move the spot along with it as it travels up the plate. The outcome depends upon a balance among three polarities - that of the plate, the development solvent and the spot material. If the development solvent is polar enough, the spot will move some distance from its original location. Different components in the original spot, having different polarities, will move different distances from the original spot location and show up as separate spots. When the solvent has traveled almost to the top of the plate, the plate is removed, the solvent front marked with a pencil, and the solvent allowed to evaporate.Visualization of colored compounds is simple – the spots can be directly observed after development. Because most compounds are colorless however, a visualization method is needed. The silica gel on the TLC plate is impregnated with a fluorescent material that glows under ultraviolet (UV) light. A spot will interfere with the fluorescence and appear as a dark spot on a glowing background. While under the UV light, the spots can be outlined with a pencil to mark their locations. A second method of visualization is accomplished by placing the plate into iodine vapors for a few minutes. Most organic compounds will form a dark-colored complex with iodine. It is good practice to use at least two visualization techniques in case a compound does not show up with one particular method.The Rf value is used to quantify the movement of the materials along the plate. Rf is equal to the distance traveled by the substance divided by the distance traveled by the solvent. Its value is always between zero and one. A TLC analysis might be summarized something like, "Using a silica gel plate and ethyl acetate as the development solvent, unknown mixture X showed three spots having Rf's of 0.12, 0.25, and 0.87". Comparing these Rf's with the Rf's of known compounds might enable a tentative identification to be made. Note that observing three spots means only that there are at least three components in the mixture. Some components may have such similar polarities that they appear under one spot after development.R f = Y/X (always ≤ 1)If a development solvent of too high a polarity is used, all components in the mixture will move along with the solvent and no separation will be observed (Rf’s will be too large). If the solvent is of too low a polarity the components will not move enough, and again separation will not occur (Rf’s will be too small). In practice, different solvents or mixtures of solvents are tried until a good separation is observed. Typically an effective solvent is one that gives Rf's in the range of 0.3 - 0.7. Note that the spotting solvent is simply used as a vehicle to transfer the material to be analyzed to the TLC plate. Once the transfer is made the spotting solvent evaporates. It has no effect on the separation. It is the development solvent that effects the separation.What’s going on at the molecular level during development? There are three components in TLC: (1) the TLC plate (stationary phase), the development solvent (mobile phase), and the sample to be analyzed (solute). In our experiment the TLC plate consists of a thin plastic sheet covered with a thin layer of silica gel, a portion of the structure of which is shown below.Si O OHO SiOHOO SiOHOOSi OOSiSiOSilica gel consists of a three-dimensional network of thousands of alternating silicon and oxygen bonds, with O-H groups on the outside surface. Silica gel is simply very finely ground very pure sand. It should be noted that silica gel is highly polar and is capable of hydrogen bonding. Consider the side-on view of the development of a TLC plate below. As the solvent travels up the plate, over the spot, an equilibrium is set up, as development solvent competes with the TLC plate for the solute. The silica gel binds to the solute and the development solvent tries to dissolve it away, carrying the solute(s) along as the solvent travels up the plate.A balance of intermolecular forces determines the position of equilibrium and thus the ability of the solvent to move the solute up the plate. In other words, would the spot prefer to be stuck on the plate or would it prefer to move along with solvent.The balance depends upon (1) the polarity of the TLC plate (constant and high), (2) the polarity of the development solvent (can be varied by using different solvents), and (3) the polarity of the compounds in the spot (this varies depending upon what compounds are in the spot). For example, if a sample consists of two components, one more polar than the other, the more polar will tend to stick more tightly to the plate and the less polar will tend to move along more freely with the solvent. Using a more polar development solvent would cause both to move along further. If the approximate structures of the solutes are known, it is possible to make an educated guess as to what solvent or mixture of solvents to use. In practice though, for a given mixture of compounds to be analyzed, a solvent or mixture of solvents is chosen by trial and error to give the best separation. (A caveat: the polarity argument is helpful in understanding the principles of TLC. Because most compounds have some polarity the argument works well. For compounds having very low polarity however, a lower-polarity solvent may be more effective in moving the solute up the plate.)To illustrate a TLC experiment, consider the following example of the analysis of a two-component mixture.The polarity of molecules, solutes and solvents alike, is ordered as follows, from least to most polar:Alkanes (least polar), alkyl halides, alkenes, aromatic hydrocarbons, ethers, esters, ketones, aldehydes, amines, alcohols, and carboxylic acids (most polar). Note however that many molecules contain multiple functional groups and that the overall polarity would be determined by all of the groups.Experimental Procedure. (rev 1/08)This experiment consists of two parts: (1) analyzing two different analgesics to determine the number of compounds in each and the identity of those compounds and (2) studying the effect of solvent polarity on Rf. Look over the photos showing TLC on the course website.(1.) TLC analysis of analgesics.Spotting. The powdered side of the silica gel plate, not the shiny, plastic side is the side that is spotted. Lightly draw a pencil line about 1 cm from the end of a plate. Use a pencil, not a pen, and be careful to not scratch the surface of the plate too deeply. The plates are of such a size that only three spots can be run on each. Use a fresh pipet for each spot. Make each spot as small as possible (less than about 1 mm diameter). After applying the spots check them under the UV lamp to see that they are of a reasonable size. The UV light must be held close to the plate to see the spots (CAUTION: do not look directly into the UV light.) If the spot is much too large, prepare a new plate. If a spot is too small, add more solution. Analyze two unknown analgesics in the following way: two of the three known compounds (references) plus the first analgesic to be analyzed (unknown 1) will be spotted on one plate, the same two knowns plus the second analgesic (unknown 2) will be spotted on a second plate, and both analgesic 1 and analgesic 2 along with the third known compound will be spotted on a third plate (see Figure below). (If the plates werewider, you could analyze each unknown on just one plate.) To obtain a sample of a known solution, bring a micropipet to the sample solution at the side bench, dip it into the solution to fill it, then take it back to your workspace for spotting (Use only micropipets for obtaining samples; do not use Pasteur pipets to take larger amounts of samples – that could lead to contamination). Try to minimize traffic at the side bench and take care to not contaminate the solutions with a micropipet that has already been used. The purpose of the experiment is to determine which of the known compounds are contained in the analgesics that you chose to analyze. Solutions of the known compounds will already be made. You must make 1% solutions of the unknown analgesics. To do this, take a small part of a crushed tablet and add enough ethanol to make an approximately 1% solution (very approximate - do not weigh samples). About 1 mg in several drops of solvent will produce an approximately 1% solution. The analgesic contains insoluble binders so not all of it will dissolve.Development. The development chamber is a small screw-capped jar with a 5.5 cm filter paper placed into it to ensure that the atmosphere is saturated with vapor. Each run is relatively brief so please use only one ethyl acetate development chamber. Otherwise there may not be enough for everyone. Place about 2 mL of ethyl acetate into the chamber (2 mL is a full squeeze of the bulb using a Pasteur pipet). Place the TLC plate into the jar with the spotted side at the bottom. Keep the cap on the jar at all times except when placing the plate into or taking the plate out of the jar. Watch out for the following: the solvent must be below the level of the spots or the spotted material will dissolve in the development solvent; the plate must stand vertically in the tank and the silica gel must not touch the filter paper; the solvent must not be allowed to run all of the way to the top of the plate; the correct amount of material must be spotted (checking under UV light before development may help - if spots are too large, another plate can be made - if the spots are too small, more material can be spotted). The development takes little time so if a plate comes out poorly, another can easily be done. After the solvent has almost reached the top of the plate, the plate is removed and the position of the solvent front marked before the solvent evaporates. The plate is then allowed to dry in the hood. Always allow the developing solvent to run almost completely to the top of the plate. This will use the entire plate and allow for the best possible separation. Visualization. This is done by two methods. First, by short wavelenth UV light. (CAUTION: do not look directly into the light.) The light must be held close to the plate to see the the spots. Some spots may be very faint. The observed spots should be outlined with a pencil. The plate is then placed into a jar containing iodine crystals for a few minutes. Keep the iodine jar capped and in the fume hood. The spots may appear different from those shown with the UV light. They should also be circled. A comparison of the two visualization techniques can be made and may help inidentifying the unknown spots. The iodine method must be done after the UV method because the compound may react with the iodine, possibly changing the results.Calculate the Rf values for the known compounds and for all components of the analgesic. From your results, identify which components are present in a particular analgesic. Some of the components may have very similar Rf's under these conditions. However, their spots may look different upon treatment with iodine and this may allow a distinction to be made. Note that caffeine is present in small amounts and may not show up well. Purposely overloading a spot may help to show a component present in small amounts.You may choose from the following analgesics: Anacin, Extra Strength Excedrin, Extra Strength Tylenol, and CVS Super Strength Pain Reliever. You may also analyze your personally-preferred legal analgesic if you wish. Just bring a tablet to lab.(2.) Solvent Effect on Rf Values. Three known compounds, anthracene, benzil, and triphenylmethanol, will be developed in two different solvents. Prepare two identical plates, spotted with each of those compounds, and develop one in ethyl acetate and the other in a mixture of 95% hexane and 5% t-butyl methyl ether (you may use a second chamber for this solvent mixture). Calculate Rf values, and in the post-lab write-up, discuss the effect of solvent on Rf, keeping in mind the structures and polarities of the compounds and solvents.Anthracene Benzil TriphenylmethanolSAFETY: Carefully note the warning about glass slivers above. Do not stare into the UV lamp. BEFORE YOU LEAVE THE LAB: turn off any electrical equipment that you may have used, put away your equipment and lock your drawer, clean up your work areas, close the fume hood sash completely, and ask your TA for her or his signature. In general, please try to keep the lab in as good condition as you found it. If you see caps off of bottles, replace the caps. If you see spilled chemicals, clean them up or at least report it to your TA.WASTE: Never dispose of glass waste in the regular trash. The custodian could become injured. Dispose of all glass waste in the cardboard "Glass Only" boxes. Used capillary pipets may be placed into those boxes also or into the dishes placed around the lab for that purpose. Dispose of all solutions and developing solvents in the ORGANIC LIQUID WASTE container in the hood. When finished, pour as much of the solvent as possible into the waste container and leave the screw-capped jars open in the hood so they will dry. Leave the filter paper in the jars.Postlab Questions1.) Arrange the following compounds in order of increasing Rf in a TLC analysis: benzoic acid, benzaldehyde, 3-heptanone, nonane, and cyclohexanol.2.) Why must the spot be applied to the TLC plate above the level of development solvent?3.) What will be the result of adding too much sample to the TLC plate?4.) In a TLC analysis of analgesics, what would be the result if a solvent of too low polarity is used to develop the plate?5.) The Rf of ibuprofen was found to be 0.32 when t-butyl methyl ether was used as the development solvent. What effect would there be on the Rf of ibuprofen if acetone had been used to develop the TLC plate?。
色谱术语中英文对照1
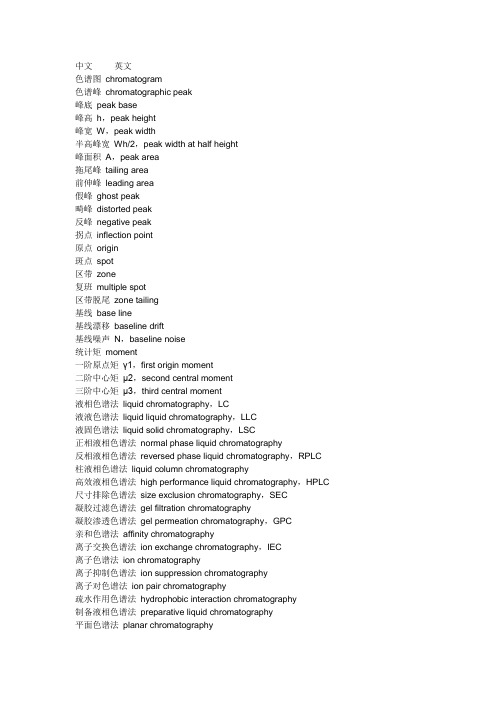
中文英文色谱图chromatogram色谱峰chromatographic peak峰底peak base峰高h,peak height峰宽W,peak width半高峰宽Wh/2,peak width at half height峰面积A,peak area拖尾峰tailing area前伸峰leading area假峰ghost peak畸峰distorted peak反峰negative peak拐点inflection point原点origin斑点spot区带zone复班multiple spot区带脱尾zone tailing基线base line基线漂移baseline drift基线噪声N,baseline noise统计矩moment一阶原点矩γ1,first origin moment二阶中心矩μ2,second central moment三阶中心矩μ3,third central moment液相色谱法liquid chromatography,LC液液色谱法liquid liquid chromatography,LLC液固色谱法liquid solid chromatography,LSC正相液相色谱法normal phase liquid chromatography反相液相色谱法reversed phase liquid chromatography,RPLC 柱液相色谱法liquid column chromatography高效液相色谱法high performance liquid chromatography,HPLC 尺寸排除色谱法size exclusion chromatography,SEC凝胶过滤色谱法gel filtration chromatography凝胶渗透色谱法gel permeation chromatography,GPC亲和色谱法affinity chromatography离子交换色谱法ion exchange chromatography,IEC离子色谱法ion chromatography离子抑制色谱法ion suppression chromatography离子对色谱法ion pair chromatography疏水作用色谱法hydrophobic interaction chromatography制备液相色谱法preparative liquid chromatography平面色谱法planar chromatography纸色谱法paper chromatography薄层色谱法thin layer chromatography,TLC高效薄层色谱法high performance thin layer chromatography,HPTLC 浸渍薄层色谱法impregnated thin layer chromatography凝胶薄层色谱法gel thin layer chromatography离子交换薄层色谱法ion exchange thin layer chromatography制备薄层色谱法preparative thin layer chromatography薄层棒色谱法thin layer rod chromatography液相色谱仪liquid chromatograph制备液相色谱仪preparative liquid chromatograph凝胶渗透色谱仪gel permeation chromatograph涂布器spreader点样器sample applicator色谱柱chromatographic column棒状色谱柱monolith column monolith column微粒柱microparticle column填充毛细管柱packed capillary column空心柱open tubular column微径柱microbore column混合柱mixed column组合柱coupled column预柱precolumn保护柱guard column预饱和柱presaturation column浓缩柱concentrating column抑制柱suppression column薄层板thin layer plate浓缩区薄层板concentrating thin layer plate荧光薄层板fluorescence thin layer plate反相薄层板reversed phase thin layer plate梯度薄层板gradient thin layer plate烧结板sintered plate展开室development chamber往复泵reciprocating pump注射泵syringe pump气动泵pneumatic pump蠕动泵peristaltic pump检测器detector微分检测器differential detector积分检测器integral detector总体性能检测器bulk property detector溶质性能检测器solute property detector(示差)折光率检测器[differential] refractive index detector荧光检测器fluorescence detector紫外可见光检测器ultraviolet visible detector电化学检测器electrochemical detector蒸发(激光)光散射检测器[laser] light scattering detector光密度计densitometer薄层扫描仪thin layer scanner柱后反应器post-column reactor体积标记器volume marker记录器recorder积分仪integrator馏分收集器fraction collector工作站work station固定相stationary phase固定液stationary liquid载体support柱填充剂column packing化学键合相填充剂chemically bonded phase packing薄壳型填充剂pellicular packing多孔型填充剂porous packing吸附剂adsorbent离子交换剂ion exchanger基体matrix载板support plate粘合剂binder流动相mobile phase洗脱(淋洗)剂eluant,eluent展开剂developer等水容剂isohydric solvent改性剂modifier显色剂color [developing] agent死时间t0,dead time保留时间tR,retention time调整保留时间t'R,adjusted retention time死体积V0,dead volume保留体积vR,retention volume调整保留体积v'R,adjusted retention volume柱外体积Vext,extra-column volune粒间体积V0,interstitial volume(多孔填充剂的)孔体积VP,pore volume of porous packing 液相总体积Vtol,total liquid volume洗脱体积ve,elution volume流体力学体积vh,hydrodynamic volume相对保留值ri.s,relative retention value分离因子α,separation factor流动相迁移距离dm,mobile phase migration distance流动相前沿mobile phase front溶质迁移距离ds,solute migration distance比移值Rf,Rf value高比移值hRf,high Rf value相对比移值Ri.s,relative Rf value保留常数值Rm,Rm value板效能plate efficiency折合板高hr,reduced plate height分离度R,resolution液相载荷量liquid phase loading离子交换容量ion exchange capacity负载容量loading capacity渗透极限permeability limit排除极限Vh,max,exclusion limit拖尾因子T,tailing factor柱外效应extra-column effect管壁效应wall effect间隔臂效应spacer arm effect边缘效应edge effect斑点定位法localization of spot放射自显影法autoradiography原位定量in situ quantitation生物自显影法bioautography归一法normalization method内标法internal standard method外标法external standard method叠加法addition method普适校准(曲线、函数) calibration function or curve [function]谱带扩展(加宽) band broadening(分离作用的)校准函数或校准曲线universal calibration function or curve [of separation] 加宽校正broadening correction加宽校正因子broadening correction factor溶剂强度参数ε0,solvent strength parameter洗脱序列eluotropic series洗脱(淋洗) elution等度洗脱gradient elution梯度洗脱gradient elution(再)循环洗脱recycling elution线性溶剂强度洗脱linear solvent strength gradient程序溶剂programmed solvent程序压力programmed pressure程序流速programmed flow展开development上行展开ascending development下行展开descending development双向展开two dimensional development 环形展开circular development离心展开centrifugal development向心展开centripetal development径向展开radial development多次展开multiple development分步展开stepwise development连续展开continuous development梯度展开gradient development匀浆填充slurry packing停流进样stop-flow injection阀进样valve injection柱上富集on-column enrichment流出液eluate柱上检测on-column detection柱寿命column life柱流失column bleeding显谱visualization活化activation反冲back flushing脱气degassing沟流channeling过载overloading。
- 1、下载文档前请自行甄别文档内容的完整性,平台不提供额外的编辑、内容补充、找答案等附加服务。
- 2、"仅部分预览"的文档,不可在线预览部分如存在完整性等问题,可反馈申请退款(可完整预览的文档不适用该条件!)。
- 3、如文档侵犯您的权益,请联系客服反馈,我们会尽快为您处理(人工客服工作时间:9:00-18:30)。
CHEM 333LOrganic Chemistry LaboratoryRevision 1.2Thin Layer Chromatographic AnalysesIn this laboratory exercise we will analyze a commercial pain reliever to determine the identityof the active analgesic in the reliever’s prescription. We will limit ourselves to non-narcotic analgesics that contain Ibuprofen, Acetaminophen, Aspirin or Caffeine. We will separate the active ingredient(s) using Thin Layer Chromatography and compare the results with standardsrun on the same chromatogram.As we have discussed before, Chromatography is the general name applied to a series of separation methods that employ a system with two phases of matter; a mobile phase and a stationary phase.Analytes in a mixture to be separated interact with the stationary phase with different affinities. While moving through the system, carried along by the mobile phase, those analytes with a low affinity for the stationary phase will tend to move along rapidly, while those with a high affinity will tend to lag behind. Thus, the separation of analytes in chromatographic systems is based on the differential affinity of the analyte for the stationary vs. mobile phases.Thin Layer Chromatography (TLC) is a fast and inexpensive form of chromatography that has many uses in the organic laboratory. Amongst these are to:Identify the Components in a MixtureMonitor a Chemical ReactionIdentify the Proper Conditions for a Column Chromatographic SeparationPurify a Sample as part of a Preparative ProcedureThe stationary phase in TLC is typically an adsorbant made of Silica Gel or Alumina layeredonto a glass, plastic or aluminum foil plate. The sample to be analyzed is spotted onto the plate and then placed in a beaker or other chamber with eluting fluid. The eluting fluid, or mobile phase, rises up the plate via capillary action, carrying the analytes with it.As mentioned, the two most common coatings for thin-layer chromatography plates are Alumina (Al2O3) and Silica Gel (SiO2). These are the same adsorbents most commonly used in Column Chromatography for the purification of macroscopic quantities of material. (In fact, TLC can be thought of as a micro version of column chromatography.) Of the two, Alumina, when anhydrous, is the more active, that is, it will adsorb substances more strongly. It is the adsorbent of choice when the separation involves relatively nonpolar analytes such as hydrocarbons, alkyl halides, ethers, aldehydes, and ketones. To separate the more polar substrates such as alcohols, carboxylic acids, and amines, the less active adsorbent, Silica Gel, is used. In extreme situations, very polar substances on Aluminum Oxide do not migrate very far from the starting point and nonpolar compounds travel with the solvent front if chromatographed on Silica Gel. These extremes of behavior are markedly affected, however, by the solvents used to carry out the chromatographic separation. A polar solvent will carry along with it polar analytes and nonpolar solvents will do the same with analytes that are themselves nonpolar.Common solvents used in chromatography, both thin-layer and column, are listed below. The higher a solvent’s Dielectric Constant the more polar it is.Solvent Notation Dielectric ConstHexane H 1.9Petroleum Ether PE 2.0Cyclohexane Cy 2.0Carbon Tetrachloride 2.2Benzene B 2.3Toluene 2.4Diethyl Ether DE 3.4Chloroform Ch 4.8Ethyl Acetate EA 6.0Acetic Acid AA 6.2Isopropyl Alcohol 18.3Acetone 20.7Ethanol 24.3Methanol M 32.6Water 78.5In general, these solvents have low boiling points and low viscosities, so they migrate rapidly along a TLC plate. They are listed in order of increasing polarity. Mixtures of these solvents are often used to “fine-tune” the separation of analytes. Some suggested mixtures for specific classes of organic compounds to be separated on Silica Gel are:Compound Class SolventAlcohols Cy:EA (1:1 or 1:2) or P:De (10:1)Amides EA:M (5:1)Amines, Amino Acids M:Ch (2:3) + 1% (vol) of 33% AmmoniaCarboxylic Acids Ch + 90% Formic Acid to saturationEsters Cy:EA (1:1 or 1:2)Hydrocarbons P or Cy or B:DE (2:1) or Cy:EA (3:1)Ketones Cy:EA (1:1 or 1:2) or DE:H (1:9)(Adapted from Theory and Practice in the Organic Laboratory by John A. Landgrebe)Similar solvent mixture suggestions are available for TLC plates made of Alumina.Once the chromatogram has been run, visualization of the compounds on the TLC plate becomes a problem. In some cases, like the dyes in Ink, the compounds are naturally colored and no visualization procedure needs to be performed.A TLC of a Black Ink (/wiki/File:TLC_black_ink.jpg)In other cases, a specific coloring reagent can be applied to the plate. This coloring reagent will react with the analytes to produce visible spots on the plate. In the example below, Vanillin is used to make visible the compounds in the separated Essential Oils.A TLC of 10 Essential Oils (/wiki/File:TLC-Essential-Oils.jpg) In more general cases, a fluorescent compound, such as Manganese activated Zinc Silicate, is added to the adsorbant. When placed under a UV lamp, the adsorbant will fluoresce a green color. Analytes will tend to quench this fluorescence, producing a dark spot where analyte is present. (In some cases the fluorescence is enhanced, producing a bright spot on the plate.) Or, the TLC plate can be developed in a chamber containing a few crystals of Iodine that is heated. The Iodine vapor can react with the analyte, producing a brown spot on the plate.Finally, a chromatogram is typically characterized by the Retention Factors of each analyte and its ability to Resolve the analytes. The Retention Factor (R f) is simply the fractional distance the analyte spot moves along the plate relative to the Solvent Front.R f =Resolution is a measure of how well the analyte spots separate from each other. Certainly, for good resolution, the analytes should have distinct R f values. However, the Breadth of the spot also affects the chromatogram’s resolution. As each compound migrates, its spot broadens as material diffuses away from its center. The reasons for this broadening are complex and will not be discussed here. Note only that the longer the system is allowed to develop, the broader will be the spots. Good resolution requires that each spot have minimal breadth. Selecting a chromatographic system, adsorbant and eluent, such that all the analytes have distinct R f’s and minimal spot broadening can be tricky. It is as much art as science.In this lab we will be separating and identifying the active ingredients in an Analgesic. Analgesics are substances that relieve pain. The most common of these is Aspirin, a derivative of Salicylic Acid. Other common analgesics include Acetaminophen and Ibuprofen as well as a number of narcotics. In many cases these analgesics are used in combination to enhance or complement their individual affects; e.g., Codeine and Acetaminophen. Additionally, to counteract the acidic properties of Aspirin, an inorganic buffering agent is added to some preparations. In some cases, Caffeine is added to counteract the sedative effects of the analgesic. Finally, each commercially prepared analgesic tablet usually contains a binder, often starch, microcrystalline cellulose, or silica gel.Thus, we will prepare a commercial analgesic tablet for analysis via TLC. The above mentioned compounds will also be run on the same TLC for comparison. The analyte spots will then be visualized under UV light. The R f value for each standard and each analyte spot produced by the commercial anagesic tablet will be determined. The active ingredient(s) of the commercial tablet will then be identified.Pre-Lab Questions1. Suppose you carry-out a TLC separation of Acetaminophen and Phenacetin on Silica Gelusing a non-polar eluting solvent. Which should have the larger R f value and why?2. A TLC plate showed two spots A and B with R f values of 0.20 and 0.30, respectively.Sketch a TLC chromatogram with the above R f values. Assume the TLC plate is 10 cm long, the spots start 1 cm from the bottom of the plate and the solvent runs to within 1 cm of the top of the plate. Be as quantitative as possible.3. What are the largest and smallest R f values possible? What physical situation will lead toeach?4. Besides a direct comparison of the unknown with the standards, there is a second reasonthe standards are run on the same TLC plate as the unknown. What is this reason?Procedure1. Prepare your chromatography tanks. Obtain two Mason jars which will act as developingchambers for your chromatograpms. For each, cut a piece of filter paper as illustratedbelow. Add this to the chamber. This should be cut such that the TLC plate can be added to the chamber without touching the filter paper. Developing solvent will wick-up this paper and help saturate the chamber’s atmosphere with solvent. This will aid in therunning of the chromatogram.In the fume hood, add eluting solvent to a depth of about 5 mm in the chamber. We will use two different solvent systems to develop our chromatograms: H:EA (1:1) and EA:AA (95:5). Cover the chamber with its lid and slosh the solvent up the sides of the chamber to moisten the wick. Set the chamber aside while you prepare the chromatography plate. 2. Prepare the TLC plate. We will use Whatman Polyester backed plates coated with SilicaGel to a thickness of 250 m. These plates have been activated to fluoresce under UV254 radiation. Handle the plates only by the edges. Cut a TLC plate to the size indicated by your instructor. Using a pencil, very, very, lightly draw a line about 1 cm from the bottom edge of the plate. Mark off 5 five 1 cm intervals. Lightly label each: Ace, Asp, Caff, Ibu, Unk.Your instructor will demonstrate how to draw out a melting point capillary tube into amicropipetter. Using a separate micropipetter, spot your unknown analgesic and eachstandard analgesic onto the TLC plate. Do this by touching the tip of the micropipetter filled with sample to t he plate’s surface four or five times. It is important the spot bereasonably concentrated and small. Do not allow the tip of the micropipetter to touch the surface for more than a fraction of a second. If it does, it will produce a spot that is too large. And, allow the spot to dry before spotting it again.Each standard solution has been prepared by dissolving the standard in a 1:1Ethanol:Dichloromethane mixture.To prepare the unknown analgesic,obtain roughly one-half an analgesic tablet. Prepare a 9 cm pipette with a small cotton plug for filtration. Crush the sample using a pestle in amortar. Collect the powder in a small beaker or Erlenmeyer flask. Dissolve in 5 mL of 1:1 ethanol/dichloromethane. Pass the sample thru the pipette containing the cotton plug. This will separate any insoluble material from the material soluble in theethanol/dichloromethane mixture. Collect in a medium test tube. Rinse the beaker orErlenmeyer flask with another 5 mL of 1:1 ethanol/dichloromethane and pass the solution thru the pipette containing the cotton plug.3. Develop the chromatogram. Add the TLC plate to the developing chamber. Allow it torun until the solvent front is a reasonable distance (~1 cm) from the top of the plate.Remove the plate from the TLC chamber and allow it to dry. Be sure to mark the position of the solvent front.4. Observe the plate under a UV lamp. Do not look directly into the lamp as UV radiationcan cause blindness. Lightly circle each spot with a pencil.5. Accurately sketch the thin-layer chromatograms in your notebook. Calculate the R f valuefor each spot. Decide which analgesic(s) and/or caffeine is (are) in your unknown sample.Post Lab Questions1. Why is it necessary to run a TLC experiment in a closed container and to have the interiorvapor saturated with the solvent?2. Why must the spot applied to a TLC plate be above the level of the developing solvent?What problem will ensue if the level of the developing liquid is higher than the appliedspot in a TLC analysis?3. What will be the result of applying too much compound to a TLC plate? Not enough?4. What will be the appearance of a TLC plate if a solvent of too low of a polarity is used forits development? Too high of a polarity?5. Why is it necessary to add a bit of Acetic Acid to our Ethyl Acetate eluting fluid; recall, weused a 95:5 (EA:AA) mixture?。