cs229-2-Review of Probability Theory
Advances in prospect theory cumulative representation of uncertainty
Expected utility theory reigned for several decades as the dominant normative and descriptive model of decision making under uncertainty, but it has come under serious question in recent years. There is now general agreement that the theory does not provide an adequate description of individual choice: a substantial body of evidence shows that decision makers systematically violate its basic tenets. Many alternative models have been proposed in response to this empirical challenge (for reviews, see Camerer, 1989; Fishburn, 1988; Machina, 1987). Some time ago we presented a model of choice, called prospect theory, which explained the major violations of expected utility theory in choices between risky prospects with a small number of outcomes (Kahneman and Tversky, 1979; Tversky and Kahneman, 1986). The key elements of this theory are 1) a value function that is concave for gains, convex for losses, and steeper for losses than for gains,
Cs229笔记

Cs229笔记第⼀部分到第三部分注意:综合张⾬⽯笔记和中⽂讲义学习,中⽂讲义有⼀些概念翻译不准确。
1.关于trace性质的证明见ML公开课笔记附录。
2.⾮参数算法的定义更直观来讲应该是:参数数量随着数据集规模的增长⽽增长。
3.似然性(likelihood)和概率(proability)两个概念⼤体上是相同的,似然性强调L(θ)是θ的函数,⽽概率强调是数据的函数。
所以我们经常说“数据的概率,参数的似然性”。
(Probability of data, likelihood of parameter)。
4.⼴义线性模型中的线性:是指假设3,即⾃然参数η和输⼊值x是线性相关的。
5.⼴义线性模型的好处是,如果我有⼀个需要预测的量y,只有0和1两种值,那么我选择了伯努利分布,之后的预测模型的得出都是⾃动进⾏的。
6.在数学推导的《线性回归与最⼩⼆乘法》⼀⽂中,矩阵偏导使⽤的是分⼦布局,与的布局⼀致。
另外附上:第四部分⽣成学习1.argmax:求函数达到最⼤值时对应的⾃变量值。
2.半正定矩阵是正定矩阵的推⼴。
实对称矩阵A称为半正定的,如果⼆次型X'AX半正定,即对于任意不为0的实列向量X,都有X'AX≥0。
(正定矩阵是>0)。
3.NB的关于三个参数的意义:p(x|y=1)是统计垃圾邮件中出现相应单词的邮件⽐例,p(x|y=0)是正常邮件中出现相应单词的邮件⽐例,p(y)是垃圾邮件概率(因为是Bernoulli分布),由此可以由p(y|x)=p(x|y)p(y)预测给定相应单词是垃圾邮件的概率。
4.多项式事件模型中,p(y)是邮件的种类标签对应的概率,这是⾸先要被选中的,然后是对应各个词的概率。
⽤到的参数Φ(k|y=1)意为当⼀个⼈决定向你发送垃圾邮件时选⽤词典中下标为k的词的概率。
5.多项式事件模型中,参数的最⼤似然估计,Φ(k|y=1)公式中m是邮件数量,ni是词典中的词总数。
分⼦意思是垃圾邮件中对应单词出现的次数,分母是垃圾邮件的单词总数之和,也就是把所有垃圾邮件展开⼀维的总长。
cs229斯坦福大学机器学习教程 Supplemental notes 4 - hoeffding

John Duchi
1
Basic probability bounds
A basic question in probability, statistics, and machine learning is the following: given a random variable Z with expectation E[Z ], how likely is Z to be close to its expectation? And more precisely, how close is it likely to be? With that in mind, these notes give a few tools for computing bounds of the form P(Z ≥ E[Z ] + t) and P(Z ≤ E[Z ] − t) (1)
for t ≥ 0. Our first bound is perhaps the most basic of all probability inequalities, and it is known as Markov’s inequality. Given its basic-ness, it is perhaps unsurprising that its proof is essentially only one line. Proposition 1 (Markov’s inequality). Let Z ≥ 0 be a non-negative random variable. Then for all t ≥ 0, P( Z ≥ t ) ≤ E [Z ] . t
考虑随机效应的两阶段退化系统剩余寿命预测方法

0 引 言
呈现出集成化、智能化、复杂化的发展趋势,功能增
随着现代科学技术的飞速发展,工业设备产品 强的同时给设备的可靠性研究带来了新的挑战。设
收稿日期: 2018-07-17;收到修改稿日期: 2018-08-14 基金项目: 国家自然科学基金(61573365) 作者简介: 张 鹏(1994-),男,陕西西安市人,硕士研究生,专业方向为故障诊断与寿命预测。
?a???c????221?b?t?2a22212b2t?222t?a12t?22a2bexp?????b??a222a2b?????????a2b?b2a2a2b????a2b?b2a2a2b2a2b???2a2b2a2b?????a2b?b2a2a2b2a2b????????bexp???2?2122241???12t?22a2bexp?????b??c222a2b?????????c2b?b2a2a2b????c2b?b2a2a2b2a2b???2a2b2a2b?????c2b?b2a2a2b2a2b????????7tkxklkfllk?1?2若已知当前时刻的退化状态用表示系统的剩余寿命表示系统剩余寿命的pdf在随机退化速率和的影响下可获得基于两阶段维纳过程退化模型的系统剩余寿命的pdftktklt
(火箭军工程大学,陕西 西安 710025)
摘 要: 针对退化过程呈现两阶段特征的随机退化系统剩余寿命预测问题,建立两阶段维纳过程退化模型,并引入随
机效应描述样本间差异性。基于时间-空间变化方法以及变点处退化值的随机特性,给出首达时间意义下系统寿命
分布解析表达形式。提出一种基于期望最大化 (expectation maximization, EM) 算法和贝叶斯理论的模型参数离线辨
识和在线更新算法。最后,结合液力耦合器 (liquid coupling device, LCD) 的实际退化数据,验证所提方法的可行性
cs229斯坦福机器学习笔记(一)--入门与LR模型
cs229斯坦福机器学习笔记(⼀)--⼊门与LR模型版权声明:本⽂为博主原创⽂章,转载请注明出处。
前⾔说到机器学习,⾮常多⼈推荐的学习资料就是斯坦福Andrew Ng的cs229。
有相关的和。
只是好的资料 != 好⼊门的资料,Andrew Ng在coursera有另外⼀个,更适合⼊门。
课程有video,review questions和programing exercises,视频尽管没有中⽂字幕,只是看演⽰的讲义还是⾮常好理解的(假设当初⼤学⾥的课有这么好。
我也不⾄于毕业后成为⽂盲。
)。
最重要的就是⾥⾯的programing exercises,得理解透才完毕得来的,毕竟不是简单点点⿏标的选择题。
只是coursera的课程屏蔽⾮常⼀些⽐較难的内容,假设认为课程不够过瘾。
能够再看看cs229的。
这篇笔记主要是參照cs229的课程。
但也会穿插coursera的⼀些内容。
接触完机器学习,会发现有两门课⾮常重要,⼀个是概率统计。
另外⼀个是线性代数。
由于机器学习使⽤的数据,能够看成概率统计⾥的样本,⽽机器学习建模之后,你会发现剩下的就是线性代数求解问题。
⾄于学习资料,周志华最新的《机器学习》西⽠书已经出了,肯定是⾸选!曾经的话我推荐《机器学习实战》,能解决你对机器学习怎么落地的困惑。
李航的《统计学习⽅法》能够当提纲參考。
cs229除了lecture notes。
还有session notes(简直是雪中送炭。
夏天送风扇,lecture notes⾥那些让你认为有必要再深⼊了解的点这⾥能够找到),和problem sets。
假设细致读。
资料也够多了。
线性回归 linear regression通过现实⽣活中的样例。
能够帮助理解和体会线性回归。
⽐⽅某⽇,某屌丝同事说买了房⼦,那⼀般⼤家关⼼的就是房⼦在哪。
哪个⼩区,多少钱⼀平⽅这些信息,由于我们知道。
这些信息是"关键信息”(机器学习⾥的⿊话叫“feature”)。
吴恩达的CS229的数学基础(概率论),有人把它做成了在线翻译版本!

吴恩达的CS229的数学基础(概率论),有人把它做成了在线翻译版本!本文是斯坦福大学CS229 机器学习课程的基础材料,原始文件下载[1]原文作者:Arian Maleki , Tom Do翻译:石振宇[2]审核和修改制作:黄海广[3]备注:请关注github[4]的更新。
线性代数的翻译见(这篇文章)。
CS229 机器学习课程复习材料-概率论概率论复习和参考概率论是对不确定性的研究。
通过这门课,我们将依靠概率论中的概念来推导机器学习算法。
这篇笔记试图涵盖适用于CS229的概率论基础。
概率论的数学理论非常复杂,并且涉及到“分析”的一个分支:测度论。
在这篇笔记中,我们提供了概率的一些基本处理方法,但是不会涉及到这些更复杂的细节。
1. 概率的基本要素为了定义集合上的概率,我们需要一些基本元素,•样本空间:随机实验的所有结果的集合。
在这里,每个结果可以被认为是实验结束时现实世界状态的完整描述。
•事件集(事件空间):元素的集合(称为事件)是的子集(即每个是一个实验可能结果的集合)。
备注:需要满足以下三个条件:(1)(2)(3)•概率度量:函数是一个的映射,满足以下性质:•对于每个,,••如果是互不相交的事件 (即当时, ), 那么:以上三条性质被称为概率公理。
举例:考虑投掷六面骰子的事件。
样本空间为。
最简单的事件空间是平凡事件空间.另一个事件空间是的所有子集的集合。
对于第一个事件空间,满足上述要求的唯一概率度量由,给出。
对于第二个事件空间,一个有效的概率度量是将事件空间中每个事件的概率分配为,这里是这个事件集合中元素的数量;例如,。
性质:•如果,则:••(布尔不等式):••(全概率定律):如果是一些互不相交的事件并且它们的并集是,那么它们的概率之和是 11.1 条件概率和独立性假设是一个概率非0 的事件,我们定义在给定的条件下的条件概率为:换句话说,)是度量已经观测到事件发生的情况下事件发生的概率,两个事件被称为独立事件当且仅当(或等价地,)。
改进的数据驱动时频分析方法及其应用论文

N941.3 926.7
学号 密级
10020030 公开
理学硕士学位论文
改进的数据驱动时频分析方法及其应用
硕士生姓名 学 科 专 业 研 究 方 向 指 导 教 师
张学阳 系统科学 多元信息处理 朱炬波 教授
国防科学技术大学研究生院 二〇一二年十一月
改 进 的 数 据 驱 动 时 频 分 析 方 法 及 其 应 用
国 防 科 学 技 术 大 学 研 究 生 院
Improved Data-Driven Time-Frequency Analysis and its Application
Candidate:Zhang Xueyang Advisor:Prof. Zhu Jubo
A dissertation Submitted in partial fulfillment of the requirements for the degree of Master of Science in Systems Science Graduate School of National University of Defense Technology Changsha,Hunan,P.R.China November,2012
第 I 页
国防科学技术大学研究生院硕士学位论文
第五章 DDTFA 在北斗伪距波动问题中的应用 ................................................ 35 5.1 伪距与伪距波动 ............................................................................................. 35 5.1.1 伪距定位原理 ...................................................................................... 35 5.1.2 伪距波动 .............................................................................................. 36 5.2 伪距波动数据说明 ......................................................................................... 38 5.2.1 北斗系统基本观测方程 ...................................................................... 38 5.2.2 伪距数据分析公式 .............................................................................. 38 5.2.3 数据说明 .............................................................................................. 40 5.3 数据处理与分析 ............................................................................................. 40 5.3.1 数据分解与统计重要性检测 .............................................................. 40 5.3.2 周期、振幅与相关性分析 .................................................................. 43 5.3.3 结论 ...................................................................................................... 45 5.4 本章小结 ......................................................................................................... 46 第六章 总结与展望 ......................................................................................... 47 致 谢 .............................................................................................................. 49 参考文献 ........................................................................................................... 51 作者在学期间取得的学术成果 ........................................................................... 55 发表的学术论文 .................................................................................................... 55 参与的科研工作 .................................................................................................... 55
机器学习 深度学习 笔记 (5)
Now, suppose we pick u to correspond the the direction shown in the figure below. The circles denote the projections of the original data onto this line.
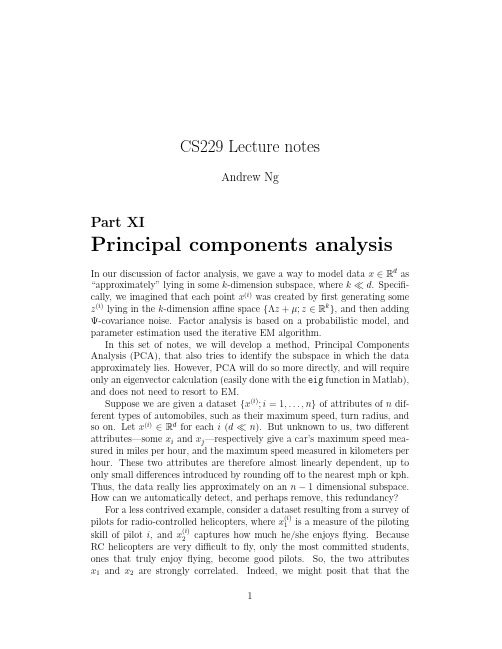
3 grayscale image, and each x(ji) took a value in {0, 1, . . . , 255} corresponding to the intensity value of pixel j in image i.
Now, having normalized our data, how do we compute the “major axis of variation” u—that is, the direction on which the data approximately lies? One way is to pose this problem as finding the unit vector u so that when the data is projected onto the direction corresponding to u, the variance of the projected data is maximized. Intuitively, the data starts off with some amount of variance/information in it. We would like to choose a direction u so that if we were to approximate the data as lying in the direction/subspace corresponding to u, as much as possible of this variance is still retained.
- 1、下载文档前请自行甄别文档内容的完整性,平台不提供额外的编辑、内容补充、找答案等附加服务。
- 2、"仅部分预览"的文档,不可在线预览部分如存在完整性等问题,可反馈申请退款(可完整预览的文档不适用该条件!)。
- 3、如文档侵犯您的权益,请联系客服反馈,我们会尽快为您处理(人工客服工作时间:9:00-18:30)。
P (Ai )
These three properties are called the Axioms of Probability. Example: Consider the event of tossing a six-sided die. The sample space is Ω = {1, 2, 3, 4, 5, 6}. We can define different event spaces on this sample space. For example, the simplest event space is the trivial event space F = {∅, Ω}. Another event space is the set of all subsets of Ω. For the first event space, the unique probability measure satisfying the requirements above is given by P (∅) = 0, P (Ω) = 1. For the second event space, one valid probability measure is to assign the i probability of each set in the event space to be 6 where i is the number of elements of that set; for 4 3 example, P ({1, 2, 3, 4}) = 6 and P ({1, 2, 3}) = 6 . Properties: If A ⊆ B =⇒ P (A) ≤ P (B ). P (A ∩ B ) ≤ min(P (A), P (B )). (Union Bound) P (A ∪ B ) ≤ P (A) + P (B ). P (Ω \ A) = 1 − P (A). (Law of Total Probability) If A1 , . . . , Ak are a set of disjoint events such that ∪k i=1 Ai = Ω, then k i=1 P (Ak ) = 1.
2
Random variables
Consider an experiment in which we flip 10 coins, and we want to know the number of coins that come up heads. Here, the elements of the sample space Ω are 10-length sequences of heads and tails. For example, we might have w0 = H, H, T, H, T, H, H, T, T, T ∈ Ω. However, in practice, we usually do not care about the probability of obtaining any particular sequence of heads and tails. Instead we usually care about real-valued functions of outcomes, such as the number of heads that appear among our 10 tosses, or the length of the longest run of tails. These functions, under some technical conditions, are known as random variables. More formally, a random variable X is a function X : Ω −→ R.2 Typically, we will denote random variables using upper case letters X (ω ) or more simply X (where the dependence on the random outcome ω is implied). We will denote the value that a random variable may take on using lower case letters x. Example: In our experiment above, suppose that X (ω ) is the number of heads which occur in the sequence of tosses ω . Given that only 10 coins are tossed, X (ω ) can take only a finite number of values, so it is known as a discrete random variable. Here, the probability of the set associated with a random variable X taking on some specific value k is P (X = k ) := P ({ω : X (ω ) = k }). Example: Suppose that X (ω ) is a random variable indicating the amount of time it takes for a radioactive particle to decay. In this case, X (ω ) takes on a infinite number of possible values, so it is called a continuous random variable. We denote the probability that X takes on a value between two real constants a and b (where a < b) as P (a ≤ X ≤ b) := P ({ω : a ≤ X (ω ) ≤ b}). 2.1 Cumulative distribution functions
1
Elements of probability
In order to define a probability on a set we need a few basic elements, • Sample space Ω: The set of all the outcomes of a random experiment. Here, each outcome ω ∈ Ω can be thought of as a complete description of the state of the real world at the end of the experiment. • Set of events (or event space) F : A set whose elements A ∈ F (called events) are subsets of Ω (i.e., A ⊆ Ω is a collection of possible outcomes of an experiment).1 . • Probability measure: A function P : F → R that satisfies the following properties, - P (A) ≥ 0, for all A ∈ F - P (Ω) = 1 - If A1 , A2 , . . . are disjoint events (i.e., Ai ∩ Aj = ∅ whenever i = j ), then P (∪i Ai ) =
Let B be an event with non-zero probability. The conditional probability of any event A given B is defined as, P (A ∩ B ) P (A|B ) P (B ) In other words, P (A|B ) is the probability measure of the event A after observing the occurrence of event B . Two events are called independent if and only if P (A ∩ B ) = P (A)P (B ) (or equivalently, P (A|B ) = P (A)). Therefore, independence is equivalent to saying that observing B does not have any effect on the probability of A.
In order to specify the probability measures used when dealing with random variables, it is often convenient to specify alternative functions (CDFs, PDFs, and PMFs) from which the probability measure governing an experiment immediately follows. In this section and the next two sections, we describe each of these types of functions in turn. A cumulative distribution function (CDF) is a function FX : R → [0, 1] which specifies a probability measure as, FX (x) P (X ≤ x). (1) 3 By using this function one can calculate the probability of any event in F . Figure ?? shows a sample CDF function. Properties: