Color Constancy from Hyper-Spectral Data
spectracolours-AmazonWebServices:光谱的颜色-亚马逊网络服务

spectra coloursN ATURALI NSPIRATIONOCEAN914Blue green infinity.The ocean’s depths containcountless mysteries thatcontinue to intrigue mankind.Subtle droplets of silverrain revitalize the green innature’s most diverseenvironment.Nature’s seasons; areminder of the circle of life,from spring fresh green tobrown-red autumn.spectra coloursAMAZON916spectra coloursAUTUMN915spectra coloursW ARM M ETALStoic grey refines itself intopolished gold; moderndesign is celebrated, butinspired by tradition.A powerful fusion of red andgold represents a decorativematerial for a powerfuldesign.Red, orange and yellow melttogether to form history’senduring symbol of wealthand commerce.ANTIQUE 911RED BRASS 912CUPRAL913spectra coloursspectra coloursN EWL UXURYAn amazing shift of freshleaves and blossoms on theJapanese cherry tree, asymbol of feminine beautyand elegant luxury.Emerald glitters on ruby, anextraordinary combination ofprecious luxury goods.Brilliant Gold sparkles on aluxurious blue-violet tapestryas wide as the summer sky.SAKURA917JEWEL909SUNSET910•Continuous colour shift over whole colour SPECTRUM (from colour 1 to colour 2)•Irrespective of the viewing angle•Your eyes see various coloursFascinating WorldsThroughout history, mankind has had an enduringappreciation of colour. From the discovery of organic purple dyes before 1900 B.C to the development of colour TV and movies after 1900 A.D, the world we live in is saturated in colour. Colour conveys emotion, it inspires and motivates.And now… colour has evolved.ALUCOBOND ®spectra colours celebrate the natural colour shifts that occur in materials that affect everyday life: The subtle nuances and colour contrasts found readily in nature, the glowing luster and sheen in modern metals and the colour shifts found in today’s luxury goods. Colour adds fascination to the world, ALUCOBOND ®spectra colours add fascination to architectural design.Fascinating SurfacesALUCOBOND ®spectra colours operate on the same principals as natural colour shifting surfaces. Depending upon the pigment type and viewing angle, different wavelengths of light are reflected back to the audience resulting in an ever-changing colour gradient with iridescent highlights. With ALUCOBOND ®spectracolours , architects can create a truly memorable experience that will fascinate the audience and provide a lasting personal impression. The use of high-quality Fluorocarbon paint systems applied in a continuous coil-coating process ensures that the original design isn’t compromised.RemarkALUCOBOND ®spectra colours can be applied on ALUCOBOND ®,ALUCOBOND ®plus and ALUCOBOND ®A2. Minimum order quantity applies. For details and available specification please refer to the manufacturer or your nearest ALUCOBOND ®representative.To avoid possible reflection differences, it is recommended to install the panels in the same direction as marked on the protective peel-off-foil. Colour variations may occur between panels originating from different production batches. To ensure colour consistency, the total requirement for a project must be placed in one order.spectra coloursspectra colours P r i n t e d i n G e r m a n y G &02/09/2010 G BG International Contacts Europe / Middle East / Africa 3A Composites GmbHAlusingenplatz 1D-78224 Singen, GermanyPhone: +49 77 31 80 23 47Fax: +49 77 31 80 28 45*********************Asia / PacificAlucobond (Far East) Pte Ltd.300 Beach RoadThe Concourse #20-02Singapore 199555Phone:+65 6501 1160Fax:+65 6501 1165*********************.sq3A Composites – A true …global player“•Sales offices and production plants in Europe,North and South America and Asia •Wide range of available panels •Partnerships with leading distributors •Professional sales teams 3A Composites GmbHAlusingenplatz 1D-78224 Singen, Germany*********************。
可见光光谱 英文
可见光光谱英文The visible light spectrum, encompassing wavelengths ranging from approximately 400 nanometers (nm) to 700 nm,is a narrow slice of the electromagnetic radiation that our eyes are capable of perceiving. This band of wavelengths, although relatively small compared to the vast expanse of the electromagnetic spectrum, plays a pivotal role in our daily lives, shaping our perception of the world around us. At the shorter wavelength end of the visible spectrum, we encounter violet light. Violet waves, with their frequencies exceeding 668 THz, are the highest in energy among all visible colors. As we move towards the red end of the spectrum, wavelengths increase, resulting in lower frequencies and consequently, lower energy levels. Red light, with wavelengths exceeding 700 nm, has the lowest energy among all visible colors.The visible spectrum is not just a random assortment of colors; it is a carefully crafted array of hues that enables us to perceive a wide range of colors. The human eye is equipped with photoreceptors called cones, which are sensitive to specific wavelengths within the visiblespectrum. These cones are primarily sensitive to blue, green, and red light, allowing us to perceive the full range of colors visible to the naked eye.The importance of the visible light spectrum extends beyond our ability to see colors. It plays a crucial role in photosynthesis, the process by which plants convert light energy into chemical energy. Chlorophyll, the green pigment found in plants, is highly absorbent of blue and red light wavelengths, which are essential for photosynthesis. Without the visible light spectrum, photosynthesis would not be possible,严重影响着整个生态系统的运转。
Colour fastness to Perspiration

Color fading and alteration can be caused by the reaction between dyes on garments and the constituents of human perspiration, such as skin waste. It varies for different individuals and conditions. Methods for testing fastness levels of dyed materials against perspiration have been established by ISO, AATCC and various other standards. There are cases where more color fading and alteration is caused by depending on the conditions under which garments are worn. Coupled with the eventual accumulation and concentration of perspiration, the reaction with sunlight is regarded as the cause for such occurrences, casting an influence on certain elements in the dye structure. To forecast such occurrences, methods for examining the components of perspiration under different conditions (acid and alkaline pH values) have been suggested by these standards.Colour fastness to Perspiration - Standard Test Methods:This test is designed for use in assessing the fastness of the dyed, printed, or otherwise colored textile yarns and fabrics of all kinds to the effects of human perspiration. The following standard methods are generally employed to assess the perspiration fastness.•ISO 105 – EO4 1994 (Acid and Alkaline perspiration)•AATCC 15:2002 (only Acid perspiration)Summary:Specimens of the textile in contact with the standard multifibre fabric (for colour transfer) are immersed in simulated alkaline and acid solution (see table below for liquor composition), drained and placed between two plates under a specific pressure, temperature and time in a testing device (perspirometer). Any change in colour of the specimens and staining of the multifibre is then assessed with the corresponding Grey scales for colour change and staining.ISO 105 – E04 AATCC 15 – 2002(1994) Chemical compositionAlkaline solution Acid solution Acid solution L- histidine monohydrochloride monohydrate (C 6H 9O 2N 3.HCl.H 2O) 0.5 g 0.5 g 0.25 ± 0.001 g Sodium chloride (NaCl)5.0 g 5.0 g 10 ± 0.01 g5.0 g - - Disodium hydrogen orthophosphate dodecahydrate (Na 2HPO 4 .12H 2O) or Disodium hydrogen orthophosphate dihydrate (Na 2HPO 4.2 H 2O) 2.5 g 2.2 g - Sodium dihydrogen orthophosphate, anhydrous (Na 2HPO 4) --1 ± 0.01 g Lactic acid (85%) - - 1 ± 0.01 g Total volume 1 litre 1 litre 1 litre pH8.0 5.5 4.3 ± 0.2 Specimen size 100 x 40 mm 60 x 60 mm Test conditions37 ± 2º C for 4 hours undera pressure of 5 kg38 ± 1º C for 6 hours under a pressure of4.54 kgProcedure in brief:Reagents:• Alkaline Solution - Freshly prepared, composition as given in Table above • Acid Solution - Freshly prepared, composition as given in Table aboveTest Specimens• Cut two specimens 100mm x 40mm (one specimen of 60 x 60 cm in AATCC method)along the length or width direction. For multi-coloured fabrics, prints or stripes, all colours of the design should be in contact with all components of the multifibre.• Where it is not possible for all colours to be in contact with all components, more thanone test specimen may need to be prepared.• For fabrics of different shade or fibre composition on face and back, both sides should betested.• Avoid samples within 50 mm of the selvedge.• Cut two pieces of multifibre 40mm wide. The multifibre has selvedges and isapproximately 100mm long. For AATCC method 60 x 60 cm size multifibre fabric is cut.•Align the test specimens and multifibre and sew together along one short edge to forma composite specimen.Test Procedure•Weigh each specimen. Calculate the amount of test solution according to a liquor ratio of 50:1, i.e. 50 ml test solution per 1g of specimen.•Immerse one composite specimen in the alkaline solution and the other in the Acid solution for 30 minutes at room temperature to ensure that the specimens arethoroughly wetted out. (In AATCC method, place the test specimen in a 9 cm diameter and 2 cm deep Petri dish. Add only acid perspiration solution to a depth of 1.5 cm andsoak for 30 min.)•Place each specimen onto a resin plate and draw across with the stirring rod to remove any air bubbles. Place another resin plate on top of the specimen to fully enclose it.Place a maximum of ten specimens into the perspirometer ensuring that each specimen is separated by one resin plate. Use a separate perspirometer for each solution.•(In AATCC method, pass the specimen through the wringer so that it weighs 2.25 ±0.05 times the original weigh. To obtain consistent results all specimens of a givenconstruction in a test series should have identical pickup, as the degree of stainingincreases with the amount of retained solution. Assemble the plates in the perspirometer with the specimens evenly distributed between the plates. Place all 21 plates into theunit regardless of the number of specimens)•Bring the upper pressure plate of the perspirometer down to rest on top of the resin plates and place the weight onto the pressure plate and tighten the securing screws.This is equal to a pressure of 12.5 KPa (5 kg) in between being applied on thespecimens.•Drain off any excess solution.•Place the specimens into the oven at 37 ± 2°C, for 4 hours (38 ± 1ºC, for 6 hours in AATCC method), set a timer for this.•On completion of the test remove the specimens from the oven and separate them from the resin plates.•Open out the specimens, so that they are only in contact at the line of stitching.•Dry the specimens in an incubator or by laying on a screen at a temperature not exceeding 60°CEvaluation of results•After drying, assess the specimens in a colour matching cabinet under D65, artificial daylight.•Assess colour staining of all components on the multifibre using the grey scale for assessing staining.•For multi-coloured prints only assess the worst area of staining on each component.•Assess the change of shade on the original specimen compared to the tested specimen, using the grey scales for assessing change.Some notes on testing•It is sometimes advised that a complete different set of Perspirometers / plates be used for alkaline and acidic perspiration tests. This is recommended so that there is nocontamination between the two.•Some laboratories use different sets of equipment for ISO and AATCC testing for thesame reasons.Case studies:Photograph for representationalpurposes onlyCase 1Gold coloured printing is quite popular due to the unique effects that it can offer to garments. Typically, gold prints are done using inorganic metallic pigments. There was a case where a woven shirt with gold coloured motif print was exported to Europe for a summer season. This article had passed the normal colourfastness tests as specified by the buyer.Unfortunately, the garments were returned by customers with a complaint that the gold motif changed colour to green after use in areas such as the armhole, back where perspiration is excessive. The colour change was irreversible. This problem was investigated and it was found that the print was sensitive to perspiration, possibly because it was a copper based compound. On testing, the print failed colourfastness to perspiration – a test that was not performed as part of the quality control protocol.Investigation revealed the use of a poor quality cheap gold powder which was sensitive to perspiration and turned green. The problem was solved only when the goods were redone using standard gold paste for the printing.Other casesColourfastness to perspiration is often a problem for sportswear. There have been cases where articles for use in sports with poor colourfastness to perspiration have led to staining of undergarments.Similar issues have been seen for industrial work wear where the users often work in conditions where perspiration is a natural occurrence, especially in hot environments such as India.We have also seen problems with ladies undergarments such as brassieres being stained due to poor colourfastness to perspiration of outer garments.These cases show that Colourfastness to perspiration is an important criterion in garment quality evaluation.Squeezing excess liquor from sampleLoading the perspirometer Loaded Perspirometer。
The von Kries Hypothesis and a Basis for Color Constancy
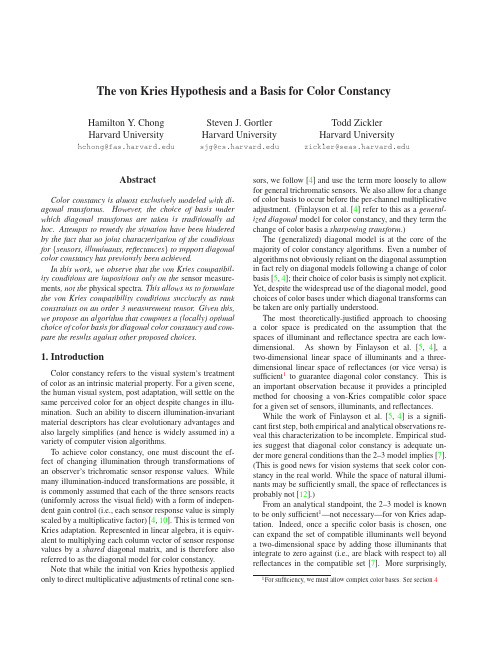
Todd Zickler Harvard University
zickler@
Abstract
Color constancy is almost exclusively modeled with diagonal transforms. However, the choice of basis under which diagonal transforms are taken is traditionally ad hoc. Attempts to remedy the situation have been hindered by the fact that no joint characterization of the conditions for {sensors, illuminants, reflectances} to support diagonal color constancy has previously been achieved. In this work, we observe that the von Kries compatibility conditions are impositions only on the sensor measurements, not the physical spectra. This allows us to formulate the von Kries compatibility conditions succinctly as rank constraints on an order 3 measurement tensor. Given this, we propose an algorithm that computes a (locally) optimal choice of color basis for diagonal color constancy and compare the results against other proposed choices.
光谱仪 色温 英文缩写

光谱仪色温英文缩写Spectral Instrument and Colour Temperature: An In-Depth Analysis.Spectral instruments and colour temperature are two concepts that play a pivotal role in the understanding and measurement of light. Spectral instruments are devices that are used to measure and analyze the spectral components of light, while colour temperature is a metric that characterizes the colour of a light source based on its spectral distribution.Spectral Instruments.Spectral instruments are precision devices that are designed to measure the spectral properties of light. These instruments can be used to determine the wavelength, intensity, and other characteristics of light sources. Spectral analysis is crucial in various fields, including physics, chemistry, and astronomy, as it allows researchersto identify and understand the properties of matter by examining the interaction of light with matter.One common type of spectral instrument is the spectrometer, which is used to measure the intensity of light at different wavelengths. Spectrometers can be divided into several categories based on their operating principles, including dispersive spectrometers, Fourier transform spectrometers, and grating spectrometers. Each type of spectrometer has its unique advantages and disadvantages, making it suitable for different applications.Colour Temperature.Colour temperature is a metric that is used to describe the colour of a light source. It is measured in units of Kelvin (K) and is based on the comparison of the spectral distribution of the light source to that of a blackbody radiator at a particular temperature. A blackbody radiator is an idealized emitter that absorbs all incident radiation and emits radiation solely based on its temperature.The colour temperature of a light source is determined by the relative intensities of the different wavelengths of light emitted by the source. Light sources with a lower colour temperature emit more energy at longer wavelengths, resulting in a warmer, redder appearance. Conversely, light sources with a higher colour temperature emit more energy at shorter wavelengths, resulting in a cooler, bluer appearance.Spectral Instruments and Colour Temperature.Spectral instruments play a crucial role in the measurement of colour temperature. By analyzing thespectral distribution of a light source, spectral instruments can provide information about the colour temperature of the source. This information can be used to characterize the light source, compare it to other sources, and ensure that it meets specific requirements for applications such as photography, cinematography, and lighting design.In addition to measuring colour temperature, spectral instruments can also be used to analyze the quality oflight sources. By examining the spectral components of light, spectral instruments can reveal the presence of unwanted artefacts such as colour casts or colour shifts. This information can be used to improve the performance of light sources or to select the most suitable source for a particular application.Applications of Spectral Instruments and Colour Temperature.Spectral instruments and colour temperature have a wide range of applications across multiple industries and fields. In the field of photography, for example, spectral instruments can be used to measure the spectraldistribution of light sources to ensure accurate colour reproduction in photographs. This is particularly important for professional photography, where accurate colour representation is crucial.In the field of lighting design, spectral instrumentsand colour temperature play a key role in creating comfortable and visually appealing environments. By analyzing the spectral properties of light sources and adjusting their colour temperatures, designers can create spaces that are both visually pleasing and functional. This is particularly important in spaces such as museums, galleries, and theatres, where accurate colour representation is essential for displaying art and other visual media.In the field of astronomy, spectral instruments are used to analyze the spectra of stars and other celestial objects. By examining the spectral lines emitted by these objects, astronomers can determine their composition, temperature, and other physical properties. This information can then be used to understand the evolution and structure of the universe.Conclusion.Spectral instruments and colour temperature are two fundamental concepts in the understanding and measurementof light. Spectral instruments provide a precise and accurate way to measure the spectral properties of light sources, while colour temperature provides a metric to describe the colour of these sources. Together, they play a crucial role in various fields such as physics, chemistry, astronomy, photography, cinematography, and lighting design. As technology continues to advance, spectral instrumentsand colour temperature will continue to play anincreasingly important role in our understanding and utilization of light.。
Miscellaneous Topics regarding colour
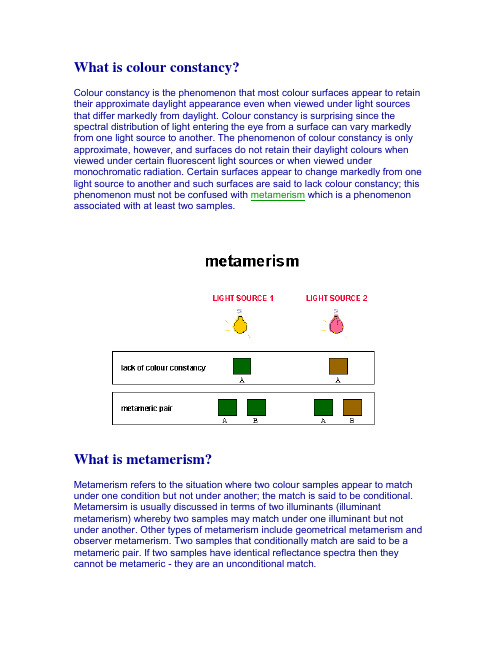
What is colour constancy?Colour constancy is the phenomenon that most colour surfaces appear to retain their approximate daylight appearance even when viewed under light sources that differ markedly from daylight. Colour constancy is surprising since the spectral distribution of light entering the eye from a surface can vary markedly from one light source to another. The phenomenon of colour constancy is only approximate, however, and surfaces do not retain their daylight colours when viewed under certain fluorescent light sources or when viewed under monochromatic radiation. Certain surfaces appear to change markedly from one light source to another and such surfaces are said to lack colour constancy; this phenomenon must not be confused with metamerism which is a phenomenon associated with at least two samples.What is metamerism?Metamerism refers to the situation where two colour samples appear to match under one condition but not under another; the match is said to be conditional. Metamersim is usually discussed in terms of two illuminants (illuminant metamerism) whereby two samples may match under one illuminant but not under another. Other types of metamerism include geometrical metamerism and observer metamerism. Two samples that conditionally match are said to be a metameric pair. If two samples have identical reflectance spectra then they cannot be metameric - they are an unconditional match.How do I measure whiteness?Whiteness is a complex perceptual phenomenon that depends not only the luminance of a sample but also on the chromaticity. To promote uniformity of practice in the evaluation of whiteness the CIE has recommended that the formula for whiteness, W or W10, be used for comparisons of the whiteness of samples evaluated for CIE Standard Illuminant D65:W = Y + 800(x n - x) + 1700(y n - y),orW10 = Y + 800(x n,10 - x10) + 1700(y n,10 - y10),where x n and y n refer to the chromaticities of the illuminant (D65), and the subscript 10 distinguishes the 10 degree observer data from the 2 degree data.The higher the value of W or W10 the greater the whiteness: the formulae, however, are only valid for samples that would commercially considered white and within certain other constraints.If the measurement of whiteness is important, and if samples may be fluorescent, then it is very important that the light source in the spectrophotometer be a close approximation to the D65 illuminant.How do I measure yellowness?The preferential absorption of light in the short wavelength region (380-440nm) by a nominally white substance usually causes an appearance of yellowness. A number of yellowness scales have been developed over the years. The simplest, though not necessaril best, index for quantifying yellowness is simply the difference between the Y and Z tristimulus values, thus Y-Z.What can I do if my sample is not uniform?It must be realised that a spectrophotometer (or a colorimeter) spatially averages the light reflected by a sample: thus it is possible that a uniform grey sample and a black-and-white checkerboard sample could give rise to identical measurements. The CIE system is strictly limited to the measurement of uniform colour stimuli.Digital colour camera devices are beginning to be used for colour measurement - especially for textured samples. They measure colour at many thousands of spatial locations on the sample but currently provide relatively poor colour resolution and precision.What is device-independent colour space?There is an increasing need to be able to communicate colour from one device (such as a VDU screen) to another (such as a colour printer) with no loss in colour fidelity. One way to achieve this is if all devices are calibrated in terms of a device-independent colour space. The CIE system for colour specification is being adopted by industry as a device-independent space.。
3B Scientific 透光光谱实验说明书
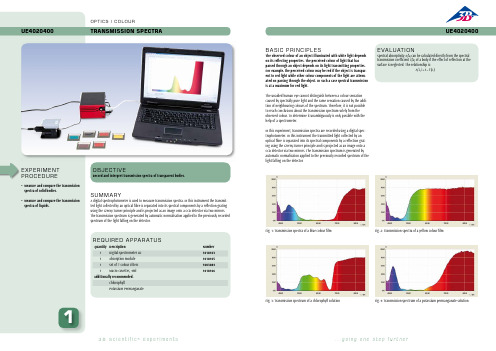
...g o i n g o n e s t e p f u r t h e r3B S c i e n t i f i c ® E x p e r i m e n t s1UE4020400OP T IC S / COLOUR Transmission spEcTra OB JEC T I V ERecord and interpret transmission spectra of transparent bodies.SUMM A RYA digital spectrophotometer is used to measure transmission spectra. In this instrument the transmit-ted light collected by an optical fibre is separated into its spectral components by a reflection grating using the Czerny-Turner principle and is projected as an image onto a CCD detector via two mirrors. The transmission spectrum is generated by automatic normalisation applied to the previously recorded spectrum of the light falling on the detector.E X PERIMEN T PROCEDURE• M easure and compare the transmission spectra of solid bodies.• M easure and compare the transmission spectra of liquids.UE4020400BASIC PRINCIPL ESThe observed colour of an object illuminated with white light dependson its reflecting properties. The perceived colour of light that has passed through an object depends on its light transmitting properties. For example, the perceived colour may be red if the object is transpar -ent to red light while other colour components of the light are attenu -ated on passing through the object. In such a case spectral transmission is at a maximum for red light.The unaided human eye cannot distinguish between a colour sensation caused by spectrally pure light and the same sensation caused by the addi-tion of neighbouring colours of the spectrum. Therefore, it is not possible to reach conclusions about the transmission spectrum solely from the observed colour. To determine it unambiguously is only possible with the help of a spectrometer.In this experiment, transmission spectra are recorded using a digital spec-trophotometer. In this instrument the transmitted light collected by an optical fibre is separated into its spectral components by a reflection grat-ing using the Czerny-Turner principle and is projected as an image onto a CCD detector via two mirrors. The transmission spectrum is generated by automatic normalisation applied to the previously recorded spectrum of the light falling on the detector.E VA LUAT IONSpectral absorptivity A (λ) can be calculated directly from the spectral transmission coefficient T (λ) of a body if the effect of reflection at the surface is neglected. The relationship is:()λ−=λT )(A 1Fig. 1: Transmission spectra of a blue colour filmFig. 2: Transmission spectra of a yellow colour filmFig. 3: Transmission spectrum of a chlorophyll solution Fig. 4: Transmission spectrum of a potassium permanganate solutionREqUIRED A PPA R AT USQuantity DescriptionNumber 1Digital-Spectrometer LD 10181031Absorption module 10181051Set of 7 Colour Filters 10030841Macro cuvettes, 4ml1018106Additionally recommended:ChlorophyllPotassium Permanganate。
高光谱英文缩写

高光谱英文缩写Hyperspectral imaging, often referred to as HSI, is a powerful and versatile technology that has revolutionized the way we perceive and analyze the world around us. This advanced imaging technique goes beyond the capabilities of traditional digital cameras by capturing a vast array of spectral information from the electromagnetic spectrum, providing a wealth of data that can be used in a wide range of applications.At its core, hyperspectral imaging involves the acquisition of high-dimensional data cubes, where each pixel in the image contains a detailed spectral signature. This signature represents the unique reflectance or emission characteristics of the target material, allowing for the identification and classification of a wide variety of substances and materials. Unlike conventional RGB (red, green, blue) imaging, which captures only three color channels, hyperspectral sensors can record hundreds or even thousands of narrow spectral bands, creating a rich and detailed spectral profile.The power of hyperspectral imaging lies in its ability to revealinformation that is invisible to the human eye or traditional imaging techniques. By capturing the subtle nuances of the electromagnetic spectrum, HSI can detect and analyze a diverse range of materials, from minerals and vegetation to man-made objects and even chemical compounds. This capability has made it an indispensable tool in a variety of fields, including remote sensing, environmental monitoring, agriculture, and even medical diagnostics.In the realm of remote sensing, hyperspectral imaging has revolutionized the way we study and manage our natural resources. By analyzing the spectral signatures of different materials, researchers can map and monitor the distribution of minerals, identify areas of vegetation stress, and detect the presence of pollutants or contaminants in the environment. This information is invaluable for a wide range of applications, from mineral exploration and forestry management to environmental impact assessments and disaster response.In the agricultural sector, hyperspectral imaging has become a crucial tool for precision farming and crop monitoring. By analyzing the spectral signatures of plants, farmers can detect early signs of disease, nutrient deficiencies, or water stress, allowing them to take targeted action to improve crop yields and reduce the environmental impact of their operations. Additionally, HSI can be used to map soil composition, monitor crop growth, and even detect the presence ofpests or weeds, enabling more efficient and sustainable farming practices.The medical field has also benefited greatly from the advances in hyperspectral imaging technology. In the area of diagnostics, HSI has shown promise in the early detection of various diseases, such as skin cancer, breast cancer, and cardiovascular conditions. By analyzing the unique spectral signatures of diseased tissues, healthcare professionals can identify subtle changes that may not be visible to the naked eye, enabling earlier intervention and improved patient outcomes.Beyond these applications, hyperspectral imaging has found its way into numerous other industries, including art conservation, forensics, and even aerospace engineering. In the field of art conservation, HSI can be used to identify pigments, detect forgeries, and monitor the condition of valuable artworks, while in forensics, it has been employed to analyze trace evidence and identify illicit substances.As the technology continues to evolve, the potential applications of hyperspectral imaging are virtually limitless. With advancements in sensor technology, data processing, and analytical algorithms, the future of HSI looks increasingly bright, promising new discoveries and innovations that will shape our understanding of the world around us.However, the widespread adoption of hyperspectral imaging technology is not without its challenges. The sheer volume of data generated by HSI systems, coupled with the complexity of the spectral analysis, can pose significant computational and storage challenges. Additionally, the cost of the specialized equipment and the expertise required to interpret the data can be barriers to entry for some organizations and individuals.Despite these challenges, the benefits of hyperspectral imaging are clear, and the technology continues to gain traction across a wide range of industries and disciplines. As researchers and engineers work to overcome the technical hurdles, the future of HSI looks increasingly promising, with the potential to unlock new insights and discoveries that will shape our understanding of the world around us.In conclusion, hyperspectral imaging is a transformative technology that has the power to revolutionize the way we perceive and interact with our environment. By capturing the rich spectral information that lies beyond the visible spectrum, HSI has opened up new frontiers of scientific exploration and practical applications, from remote sensing and precision agriculture to medical diagnostics and forensic analysis. As the technology continues to evolve and become more accessible, the potential of hyperspectral imaging to drive innovation and improve our understanding of the world around us is truly limitless.。
- 1、下载文档前请自行甄别文档内容的完整性,平台不提供额外的编辑、内容补充、找答案等附加服务。
- 2、"仅部分预览"的文档,不可在线预览部分如存在完整性等问题,可反馈申请退款(可完整预览的文档不适用该条件!)。
- 3、如文档侵犯您的权益,请联系客服反馈,我们会尽快为您处理(人工客服工作时间:9:00-18:30)。
Color Constancy from Hyper-Spectral Data Th.Gevers,H.M.G.Stokman,J.van de Weijer Faculty of Science,University of Amsterdam,The Netherlandsgevers,stokman,joostw@wins.uva.nlAbstractThis paper aims for color constant identification of object colors through theanalysis of spectral color data.New computational color models are proposedwhich are not only invariant to illumination variations(color constancy)butalso robust to a change in viewpoint and object geometry(color invariance).Color constancy and invariance is achieved by spectral imaging using a whitereference,and based on color ratio’s(without a white reference).From thetheoretical and experimental results it is concluded that the proposed com-putational methods for color constancy and invariance are highly robust to achange in SPD of the light source as well as a change in the pose of the object.1IntroductionMuch research in psychology and computer vision has been devoted to the problem of color constancy for discounting the illumination color to obtain the object reflectance color. Color constancy research is extended by the recent object indexing and recognition meth-ods exploring illumination-invariant descriptors from color ratio’s and color distributions and significant progress has been achieved.For example,the method proposed by Funt and Finlayson[3]is based on the retinex theory of Land[6]and offers object recog-nition by indexing on illumination-invariant surface descriptors(color ratios)computed from neighboring points.While there have been many interesting advances in color constancy,the spectral ef-fect of varying imaging conditions(e.g.a change in camera viewpoint,object pose and shading)and particularly the use of spectral imaging by a spectrograph(as opposed to a spectrophotometer)has not yet been fully explored.Consequently,there is an inevitable need for computational color methods derived from spectral image data which are highly robust to the illumination changes(color constancy)as well as various image-forming pa-rameters such as object shape and camera viewpoint(color invariance).In this paper,we aim for computational methods for color constant identification of object colors through the analysis of spectral data.We will use an imaging spectrograph which is an instrument capable of simultaneously measuring the optical spectrum compo-nents and the spatial location of an object surface.In contrast,conventional spectrometers or spectrophotometers are(only)able to measure the optical spectrum from a specific sur-face area as one point leaving out the spatial information.The imaging spectrograph provides a spectral range at each pixel covering the UV through NIR(e.g.400-700nm or430-900nm).Some advantages of imaging spectroscopy are obvious e.g.very high color measurement precision,no metamerism,spectral coloranalysis.In this paper,we will focus on using spectral data for the purpose of color con-stant identification of object colors.Color constancy is achieved by spectral imaging using a white reference,and based on color ratio’s(without a white reference).This paper is organized as follows.In Section2,color constancy is discussed using spectral imaging data and a white reference.Further,in Section3,color constant color ratio’s are proposed not only independent of the SPD of the illumination but also robust to a change to object geometry and pose.In Section4,the two computational color con-stant methods will be tested for the identification of object colors under varying imaging conditions.2Color Constancy and Invariance by Spectral Imaging using a Reference PatchThe spectra obtained by the spectrograph depend on the light source and object character-istics.Therefore,these spectra vary with a change in the intensity and energy distribution of the light source,material characteristics and viewing mode.The aim of this section is to propose spectra which are invariant to illumination(color constancy)and the object ge-ometry and shadows(invariance).The section is outlined as follows.In Section 2.1,the reflection is modeled as the interaction between light and matter.How to obtain color constant spectra is proposed in Section2.2.These color constant spectra are further made independent of object geometry and shading(color invariance)in Section2.3.2.1The Reflection ModelLet be the spectral power distribution of the incident(ambient)light at the object surface at,and let be the spectral reflectance function of the object at.The spectral sensitivity of the sensor is given by.Then,the sensor response of the channel,is given by:(1)where denotes the wavelength,and is a complex function based on the geometric and spectral properties of the object surface.The integral is taken from the visible spec-trum(e.g.400-700nm).Further,consider an opaque inhomogeneous dielectric object having diffuse reflec-tion(i.e.matte surface),then the geometric and surface reflection components of function can be modeled by the(diffuse)body reflection described by Shafer[9]:(2)giving the th sensor response.Further,is the surface albedo at.is the surface patch normal,and is the direction of the illumination source.Geometric term denotes the geometric dependency on the reflection.2.2Color ConstancyConsider the reflectance of a perfect reflecting white diffuser.A sample is called a perfect white when the sample diffusely reflects all wavelengths of the light source and does notabsorb any of them.Diffuse reflectance implies that the reflected light is symmetrical in all directions.The white diffuser used in this paper is a Spectralon white reference tile with a spectral reflectance ratio[5]of over in the visible wavelength range.Hence,we may assume that the white diffuser has spectral albedo reflectance. Further,having diffuse reflectance and assuming that the surface normal is equal to theviewing direction,then.Then the sensor response of the channel of the matte white reference sample is given by:(3)In this way,the relative spectral power distribution of the white reference is measured.Further,a spectral image is captured of an arbitrary sample under the same illumination conditions,and the image is divided by the previously obtained recording of the illuminant. We thus have:(4)giving the sensor response of a sample with respect to a white reference.Through the use of the spectrograph,thefilters are narrow-bandfilters.Let thefilter be modeled as a unit impulse that is shifted over wavelengths:the transmission atand zero elsewhere.This allows us to rewrite equation(4)as:(5) obtaining:(6) Eq.6implies that,under the assumption of a unit impulse bandfilter,the observed spectra can be made independent of the actual spectral distribution of the light source and be made independent of the spatial variance of the intensity of the illuminant,if the original image is divided by the white reference image.As is known from the calibrated white reference,the true fraction of light reflected at a certain wavelength at position is obtained byLet us rewrite equation(6)as:(8) According to equation(8),the color itself depends only on surface albedo whereas the brightness of the color depends on factor.As a consequence,a uniformly painted surface may give rise to a broad variance of sensor values due to a change in object geometry.In contrast,normalized sensor space is insensitive to surface orientation,illumination direction and intensity by the division of each channel by the sum of channels:The color ratio’s proposed by Nayar and Bolle is given by[7]:(12) expressing color ratio’s between two neighboring image locations,for, where and denote the image locations of the two neighboring pixels.Note thatare measured colors with narrow-band sensorfilters.Note that standard digital camera’sare not equipped with narrow-bandfilters.In this paper,the spectral images obtained bythe spectrograph are essentially narrow-bandfilters.Assuming that the color of the illumination is locally constant(i.e.) and that neighboring points have the same surface orientation(i.e.), then the color ratio is independent of the illumination intensity and color as shown by substituting equation(10)in equation(11):(14)However,it is assumed that the neighboring points,from which the color ratio’s are com-puted,have the same surface normal.Therefore,the method depends on varying surface orientation of the object(i.e.the geometry of the objects)affecting negatively the recog-nition performance.To this end,a new color constant color ratio is proposed not only in-dependent of the illumination color but also discounting the object’s geometry:Figure1:Experiment:Comparison of the spectrograph with a spectrophotometer.Left: Color patches1(dark skin),2(light skin)and3(blue sky).Right:Color patches4(fo-liage),5(blueflower)and6(bluish green).Error bars denote the standard deviation of the average reflectance percentage measured by the Imspector V7spectrograph.Dotted lines denote the reflectance percentage measured by X-Rite SP78spectrophotometer. over pixels.The values are,for the two singly illumi-nated circles and for the doubly illuminated circle,respectively.The dark current is measured as in the scale of.After correction for the dark current,the discrepancy is less than one percent and it is concluded that the camera output is linear.Wavelength calibration For the experiment,narrow bandpassfilters are used which transmit at50-nm intervals in the visible wavelength range.They have a transmittance of10-nm bandwidth around their bandpass wavelength[8].Thefilters are placed in front of the camera lens and an image is captured of a white sample.The aperture is adjusted for eachfilter to obtain a maximal signal.The position at the optical axis of the line corre-sponds to the transmitted wavelength of thefilter.A low sensitivity of the CCD camera is seen for lower wavelengths.Estimation of the bandpass wavelength is done by convolu-tion with a one-dimensional Gaussfilter with pixels.The results are averaged over the spatial axis.The rows corresponding to5-nm intervals are obtained by linear interpo-lation from the results.The table shows that the minimal distance between two consecu-tive(50-nm apart)bandpassfilters is89.3pixels.Our interest is in a spectral resolution of5-nm.The width of thefilter is therefore pixels sufficient for our purposes.Comparison of the Spectrograph with a Spectrophotometer For this experiment,the MacBeth ColorChecker,the Jain camera and Imspector V7,and a X-Rite SP78Sphere Spectrophotometer are used.The spectrophotometer samples the visible wavelength at10 nm intervals.Goal of the experiment is to compare the reflectance percentages measured by the spectrograph with that of the spectrophotometer.The reflectance that are compared are in the range of nm,the wavelength interval is10nm.The differences in reflectances are shown in Figures1and2.The average difference in the reflection per-centage istometer(dots).Left:Color patches7(orange),8(purplish blue)and9(moderate red). Right:Color patches10(purple),11(yellow green)and12(orange yellow).the reflection percentage,the experiment shows that the difference in reflectance percent-age between the spectrograph and a spectrophotometer is less than5%.4.2Color Constancy by Spectral Imaging using Color Ratio’sIn this section,experiments are conducted to evaluate the stability of the different color ratio’s with respect to a change in illumination spectral power distribution,object geometry and a change in object pose.As the color ratio’s proposed by Nayar and Finlayson are similar,we focus on the color ratio’s of Nayar and the color ratio proposed in this paper.To test the robustness of the color ratio’s with respect to a change in spectral power distribution of the light source,the MacBeth ColorChecker has been recorded by the spec-trograph under the following light sources:(1)an incandescent lamp of about2900K(2) afluorescent lamp of about4100K(3)a halogen lamp of about6500K.Note that the MacBeth ColorChecker isflat and that differences in the measured color are only due to a change in SPD of the light source illuminating the samples.In Figure3,the color ratio’s differentiated for the various wavelengths have been computed for two colors of the Mac-Beth ColorChecker under the three different light sources.It can be seen that the color ratio’s of and gave similar results and are robust against a change in SPD.We have further tested the color ratio’s on the18colored samples of the MacBeth ColorChecker. The squared error between the color ratio’s over the wavelengths yielded a total average error of2.4%for and2.8%for over the total range yielding excellent results for both and.In order to evaluate the different color ratio’s with respect to a change in geometry, images have been taken by the spectrograph from3D matte man-made objects.Note that, in theory,the color ratio depends on varying surface orientation of the object(i.e.the geometry of the objects).Further,is robust to a change in object geometry and illu-mination direction.Thirty matte and homogeneously colored objects were used in the ex-periments.The objects were put in front of the spectrograph.The thirty recordings were made under the same light source.Then the same thirty objects were recorded again un-der the same light source but this time with a new,arbitrary position and orientation withFigure3:Experiment:Evaluating the robustness of the color ratio’s with respect to a change in SPD of the light source.Top:Nayar color ratio computed over the wavelengths taken from two colors of the MacBeth ColorChecker recorded by the Imspector V7spectrograph under three different light sources.Down:Proposed color ratio computed over the wavelengths taken from two colors of the MacBeth ColorChecker recorded by the Imspector V7spectrograph under three different light sources.Figure4:Experiment:Evaluating the robustness of the color ratio’s with respect to a change in object pose.Top:Nayar color ratio computed over the wavelengths taken from two colors from the MacBeth Col-orChecker recorded by the Imspector V7spectrograph under the same light source but under different poses. Down:Proposed color ratio computed over the wavelengths taken from two colors from the MacBeth Col-orChecker recorded by the Imspector V7spectrograph under the same light source but under different poses.respect to the camera,some recorded upside down,some rotated,some at different dis-tances.An example result is shown in Figure4,where two recordings are made of the same MacBeth ColorChecker color sample but under different orientations with respect to the spectrograph.The color ratio’s have been recorded over the wavelength for and .It can easily be seen that is heavily dependent on the geometry and pose of the object whereas is relatively stable.The average error between the color ratio’s differ-entiated for the30objects resulted in20%for and only3.4%for of the total range of the color ratio values.In conclusion,is highly robust to a change in SPD of the light source as well as a change in the pose of the object.Further,is only robust to a change in SPD of the light source.5ConclusionThis paper presented computational methods for color constant identification of object col-ors through the analysis of spectral color data.Color constancy has been achieved by spec-tral imaging using a white reference,and based on color ratio’s(without a white reference). From the theoretical and experimental results it is concluded that the proposed color con-stant methods are highly robust to a change in SPD of the light source as well as a change in the pose of the object.References[1]Finlayson,G.D.,Drew,M.S.,and Funt,B.V.,Spectral Sharpening:Sensor Trans-formation for Improved Color Constancy,JOSA,11,pp.1553-1563,May,1994. [2]Forsyth,D.,A Novel Algorithm for Color Constancy,International Journal of Com-puter Vision,V ol.5,pp.5-36,1990.[3]Funt,B.V.and Finlayson,G.D.,Color Constant Color Indexing,IEEE PAMI,17(5),pp.522-529,1995.[4]T.Gevers and Arnold W.M.Smeulders,Content-based Image Retrieval byViewpoint-invariant Image Indexing,Image and Vision Computing,(17)7,1999. [5]Labsphere Inc.,Reflectance Calibration Laboratory.Calibration Certificate,September1998.Spectralon Reflectance Target,Sample I.D.:SRT-99-050.[6]nd and J.J.McCann,Lightness and Retinex Theory,J.Opt.Soc.Am.61,1-11,(1971).[7]S.K.Nayar,and R.M.Bolle,Reflectance Based Object Recognition,InternationalJournal of Computer Vision,V ol.17,No.3,pp.219-240,1996[8]Orion Corp.Technical Data,October1998.Filters s10450s,s10550s,s10650s,s10。