2010_Gap_Analysis_Final_Report
商业银行技术效率与利益相关者关系_李江涛_纪建悦_孔胶胶

2014年8月第4期哈尔滨金融学院学报Journal of Harbin Finance University总第126期【金融论坛】商业银行技术效率与利益相关者关系李江涛1,纪建悦2,孔胶胶2(1.北京市社会科学院管理研究所,北京100102;2.中国海洋大学经济学院,山东青岛266100)摘要:选取我国商业银行2004年-2012年数据进行技术效率的测度,并对利益相关者关系影响商业银行效率的过程进行理论分析,在此基础上构建面板Tobit 模型进行实证研究,研究结果表明利益相关者关系是影响我国商业银行技术效率的关键变量。
关键词:技术效率;利益相关者;面板Tobit 模型中图分类号:F832.33文献标识码:A 文章编号:1004-9487(2014)04-0006-03收稿日期:2014-07-27作者简介:李江涛(1966-),男,山东烟台人,就职于北京市社会科学院管理研究所,副研究员;纪建悦(1974-),男,山东青岛人,中国海洋大学经济学院教授,主要研究方向为公司金融,国民经济学;孔胶胶(1987-),女,山东威海人,中国海洋大学经济学院国民经济学硕士研究生,主要研究方向为国民经济学。
一、引言商业银行作为金融行业的核心力量,其效率的测度与影响因素一直是学者研究的重点问题。
目前国内外学者对于商业银行效率的测度已经比较完善,应用最为广泛的测度方法为非参数的数据包络分析方法,如Abhiman Das 等(2009)运用数据包络分析方法测度了1992年-2004年印度商业银行的成本效率与利润效率问题,并进一步提出改进商业银行效率的措施;迟国泰,杨德等(2006)运用数据包络分析方法的CCR模型对我国商业银行效率进行测度,并计算出低效率银行的投入冗余率与产出不足率。
在效率测度基础上进一步的影响因素分析中,国内外学者也分别从股权情况、金融管制、金融机构的分支数量、金融危机、银行并购及员工创新力等角度对商业银行的效率进行分析,如Allen 等(1997)认为美国商业银行的效率低下与所设置的分支机构过多有很大关系;Roberta B.Staub 等(2010)对巴西银行的效率研究发现宏观经济波动较强时银行效率较低;何蛟、傅强(2010)研究了引入战略投资者之后对我国商业银行效率的影响问题,结果表明战略投资者的引进能够改善我国商业银行效率问题。
R4差距分析报告(生产)Gap Analysis Report Form (Production)

否No
N/A
F0值
F0
是Yes
否No
N/A
8
灯检
Light inspection
光强限度
Light intensity limit
是Yes
否No
N/A
最大设备运行速度Maximum machine speed
是Yes
否No
N/A
9
仓库Warehouse
温度Temperature
是Yes
否No
N/A
湿度Humidity
是Yes
否No
N/A
10
所有设备All Machine
确认状态Qualification status
是Yes
否No
N/A
11
校验状态
Calibration status
是Yes
否No
N/A
12
其他Others
是Yes
否No
N/A
是Yes
否No
N/A
是Yes
否No
N/A
是Yes
是Yes
否No
N/A
该区域湿度
Humidity of area
是Y级别(房间)Clean Class (Room)
电子天平
ElectricBalance
是Yes
否No
N/A
电子称
ElectricScale
是Yes
否No
N/A
塑料袋
Polybag
透明Transparent
是Yes
否No
Type of Product Filter
是Yes
否No
R3差距分析报告(QC)Gap Analysis Report Form (QC)

☐CP
others:
RS、降解对照品是否可用于检测
RS and impurities reference available for testing
☐是Y
☐否N
Note备注:
Supplier of RS and impurities reference
RS、降解对照品提供者
☐
☐其他Other
备注:
稳定性方案
☐是Y
☐否N
Note备注:
Stability testing method
稳定性检测方法
☐是Y
☐否N
Note备注:
是否有杂质标准品Presence of Impurity standard
☐是Y
☐否N
Note备注:
试剂、色谱柱是否可用于检测Availability of Reagent, and Column for testing
☐是Y
☐否N
Note备注:
微生物检测标准品及培养基是否可用Availability of Microbiological testing standard and Media
☐是Y
☐否N
Note备注:
仪器及设备是否可用(QC及微生物)Availability of Instruments and facility (QC and Microbiology)
☐是Y
☐否N
Note备注:
微生物检测标准品及培养基是否可用Availability of Microbiological testing standard and Media
☐是Y
☐否N
Note备注:
仪器及设备是否可用(QC及微生物)Availability of Instruments and facility (QC and Microbilogy)
correspondence analysis

correspondence analysis封装分析(CorrespondenceAnalysis),也称关联分析,是一种非参数描述性统计分析方法,它能够从数据中查看特征之间的关联关系。
封装分析是一种从相关数据中探索变量关系的多变量统计分析方法,它可以帮助我们研究庞大的二元和多元数据集,以及变量之间的复杂关系。
它具有良好的可视化特性,能够帮助我们更好地理解数据。
封装分析的基本思想是将多变量的总体数据表转化为低维的视图,这样就可以更容易地看出它们之间的关系。
它也被称为列联表分析,用于检测多变量数据集中变量之间的关系。
在这种分析方法中,变量之间的关系可以表示为相关性或可解释的关系。
封装分析的一个很好的方法是,它可以将一组变量映射到一个平面上,使得变量之间的关系可视化,而不必依赖复杂的精确计算。
封装分析的原理主要是,它可以处理大型数据集,并且它提供了一种有效的方法来理解它们之间的关系。
其基本思想是将数据表中的变量转换为低维,使变量之间的关系更容易显示出来。
它可以使得关系可视化,而不必依赖复杂的精确计算。
封装分析可以用来分析二元、三元及多元数据集,可以使用所谓的“关联”和“相关”方法,探索数据中的变量之间的关系。
封装分析的基本原理是,它将大量的数据表转化为低维的视图,使得学习变量之间的关系更加容易。
封装分析可以用来研究社会科学、市场营销和投资等诸多领域的数据。
它主要用于分析大型数据集,可以检测变量之间的复杂关系。
例如,封装分析可以用来探索人们在购买产品时,消费者行为和其他因素之间的关系。
它也可以用来分析多变量数据集,如气候变化对生物多样性的影响等。
封装分析主要由三个步骤构成:矩阵建模、数据降维和结果可视化。
首先,它需要将数据转换为矩阵,以便更容易分析变量之间的关系。
其次,进行数据降维,将多变量的总体数据表转化为低维的视图,这样就可以更容易地看出它们之间的关系。
最后,进行可视化,使得变量之间的关系可视化,而不必依赖复杂的精确计算。
gap analysis模型

gap analysis模型Gap Analysis模型是一种常用的管理工具,用于评估组织或项目的当前状态与期望状态之间的差距,帮助确定实现目标所需的关键步骤和资源。
本文将介绍Gap Analysis模型的基本概念、应用方法以及其在组织和项目管理中的作用。
一、Gap Analysis模型的基本概念Gap Analysis,即差距分析,是一种系统性的方法,用于评估组织或项目的目标状态与当前状态之间的差距。
通过对现状进行全面的评估和对比,确定存在的差距,为实现期望状态制定合理的行动计划。
Gap Analysis模型通常包括以下几个步骤:1. 确定目标:明确组织或项目的期望状态,即目标状态。
目标应该具体、可量化,并与组织或项目的整体战略和愿景相一致。
2. 评估现状:对组织或项目的当前状态进行全面的评估,包括资源、流程、绩效等方面的分析。
通过调研、数据收集和分析等方法,获取客观的现状信息。
3. 确定差距:将目标状态与当前状态进行对比,找出存在的差距。
这些差距可以是实际结果与目标结果之间的差异,也可以是组织或项目现有能力与所需能力之间的差距。
4. 制定行动计划:针对每个差距,制定具体的行动计划和时间表。
行动计划应该明确具体的任务、责任人和资源需求,确保能够有序地实施。
5. 监测和调整:实施行动计划后,需要及时监测和评估结果,并根据实际情况进行必要的调整。
这样可以确保组织或项目朝着目标状态稳定前进。
二、Gap Analysis模型的应用方法Gap Analysis模型可以应用于各种管理领域,如组织管理、项目管理、流程改进等。
具体应用方法可以根据实际情况进行调整,但通常包括以下几个步骤:1. 定义范围:明确Gap Analysis的范围和目标。
可以是整个组织的战略目标,也可以是某个具体项目的关键指标。
2. 收集信息:通过调研、访谈、问卷调查等方法,获取相关的信息和数据。
这些信息可以包括组织结构、流程图、绩效指标等。
深赛格B:2010年第一季度报告全文(英文版) 2010-04-29
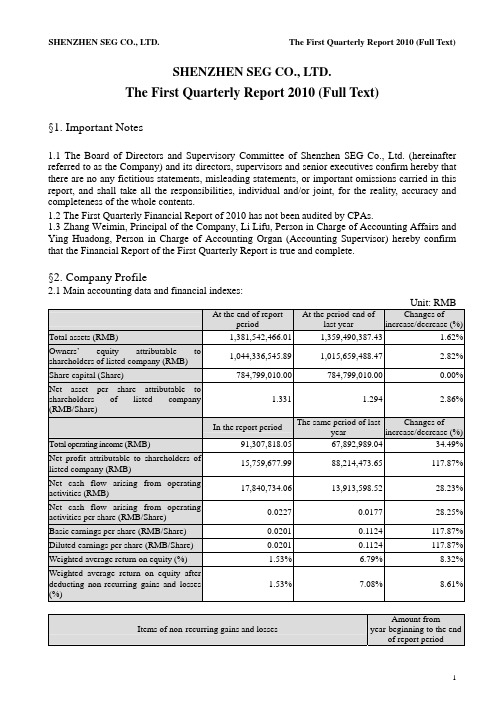
SHENZHEN SEG CO., LTD.The First Quarterly Report 2010 (Full Text)§1. Important Notes1.1 The Board of Directors and Supervisory Committee of Shenzhen SEG Co., Ltd. (hereinafter referred to as the Company) and its directors, supervisors and senior executives confirm hereby that there are no any fictitious statements, misleading statements, or important omissions carried in this report, and shall take all the responsibilities, individual and/or joint, for the reality, accuracy and completeness of the whole contents.1.2 The First Quarterly Financial Report of 2010 has not been audited by CPAs.1.3 Zhang Weimin, Principal of the Company, Li Lifu, Person in Charge of Accounting Affairs and Ying Huadong, Person in Charge of Accounting Organ (Accounting Supervisor) hereby confirm that the Financial Report of the First Quarterly Report is true and complete.§2. Company Profile2.1 Main accounting data and financial indexes:Unit: RMBAt the end of reportperiod At the period-end oflast yearChanges ofincrease/decrease (%)Total assets (RMB) 1,381,542,466.011,359,490,387.43 1.62% Owners’ equity attributable toshareholders of listed company (RMB)1,044,336,545.891,015,659,488.47 2.82% Share capital (Share) 784,799,010.00784,799,010.00 0.00% Net asset per share attributable toshareholders of listed company(RMB/Share)1.331 1.2942.86%In the report period The same period of lastyearChanges ofincrease/decrease (%)Total operating income (RMB) 91,307,818.0567,892,989.04 34.49% Net profit attributable to shareholders oflisted company (RMB)15,759,677.99-88,214,473.65 -117.87% Net cash flow arising from operatingactivities (RMB)17,840,734.0613,913,598.52 28.23% Net cash flow arising from operatingactivities per share (RMB/Share)0.02270.0177 28.25% Basic earnings per share (RMB/Share) 0.0201-0.1124 -117.87% Diluted earnings per share (RMB/Share) 0.0201-0.1124 -117.87% Weighted average return on equity (%) 1.53%-6.79% 8.32% Weighted average return on equity afterdeducting non-recurring gains and losses(%)1.53%-7.08% 8.61%Items of non-recurring gains and lossesAmount from year-beginning to the end of report periodOther non-operating income and expenditure except for the aforementioned items 97,850.12 Influenced amount of income tax -21,527.03Influenced amount of minority shareholders’ equity -31,864.37Total 44,458.72 Explanations of items of significant non-recurring gains and losses1. Other non-operating income and expenditure except for the aforementioned items:mainly the damages for breach of contract received by the Company;2. Influenced amount of income tax: the influenced amount of deductible income tax increased due to the profit increase because of the aforementioned item;;3. Influenced amount of minority shareholders’ equity: this item increased due to the increase of the aforementioned No.1 item of controlling subsidiary of the Company.2.2 Total number of shareholders at the end of the report period and shares held by the top ten shareholders without restricted conditionsUnit: Share Total number of shareholdersat the end of report period59,152Particulars about the shares held by the top ten tradable shareholders without restricted conditionsFull name of shareholder Amount of tradable shares withoutrestricted conditions held at the endof report periodType of sharesSHENZHEN SEG GROUP CO., LTD. 237,359,666 RMB ordinary shares GUANGZHOU FODAK ENTERPRISEGROUP CO., LTD.18,880,334 RMB ordinary shares Yang Zhihui 12,582,734 RMB ordinary shares Taifook Securities CompanyLimited-Account Client5,758,103 Domestically listed foreign shares Gong Qianhua 5,560,967 Domestically listed foreign shares Zeng Ying 4,280,048 Domestically listed foreign shares Zhu Wei 4,066,739 RMB ordinary shares Tang Lizhu 3,796,200 RMB ordinary shares SHANGHAI QILE ECONOMIC ANDTRADE CO., LTD.2,754,330 RMB ordinary shares Cao Xianhua 2,702,000RMB ordinary shares§3. Significant Events3.1 Particulars about material changes in items of main accounting statement and financial index, and explanations of reasons√Applicable □InapplicableI. Balance sheet itemItem Mar. 31, 2010 Dec. 31, 2009 Balance Proportion ofchanges % Inventory 1,919,437.27 5,886,392.39 -3,966,955.12 -67.39% Construction in progress 9,776,526.68 26,192,075.55 -16,415,548.87 -62.67% Staff salaries payable 1,172,559.95 4,261,476.99 -3,088,917.04 -72.48% 1. Inventory: decreased by RMB 3.97 million with a fall of 67.39% over the end of last year, which was mainly because the inventories of the Company decreased in the report period.2. Construction in progress: decreased by RMB 16.42 million with a fall of 62.67% over the end of last year. Its reason was that the construction in progress of the subsidiary Changsha SEG Development Co., Ltd. (hereinafter referred to as Changsha SEG) was completed and thentransferred into fixed assets in the report period.3. Staff salaries payable: decreased by RMB 3.09 million with a fall of 72.48% over the end of last year. Its reason was that the Company paid the staff for salaries in the report period.II. Income statement itemItem Amount in thisperiodAmount in thesame period oflast yearBalanceProportion ofchanges %Operating income 91,307,818.0567,892,989.0423,414,829.01 34.49% Operating cost 56,496,489.2231,746,485.6924,750,003.53 77.96% Operating tax and extras 3,724,614.303,012,887.52711,726.78 23.62% Sales expense 1,370,260.25906,378.64463,881.61 51.18% Losses from devaluation ofassets--1,500,000.001,500,000.00 -100.00% Investment gains -3,029,152.47-115,823,698.14112,794,545.67 -97.38% Operating profit 23,529,850.53-85,166,016.78108,695,867.31 -127.63% Non-operating income 139,079.301,620,912.10-1,481,832.80 -91.42% Non-operating expenditure 41,229.18100,985.93-59,756.75 -59.17% Total profits 23,627,700.65-83,646,090.61107,273,791.26 -128.25% Income tax expense 5,951,587.042,313,487.223,638,099.82 157.26% Net profit 17,676,113.61-85,959,577.83103,635,691.44 -120.56% Net profit attributable toowners of parent company15,759,677.99-88,214,473.65103,974,151.64 -117.87% Basic earnings per share 0.0201-0.11240.1325 -117.87% Diluted earnings per share 0.0201-0.11240.1325 -117.87% Other consolidated income 12,964,835.24-574,782.6813,539,617.92 -2355.61% Total consolidated income 30,640,948.85-86,534,360.52117,175,309.37 -135.41% Total consolidated incomeattributable to owners ofparent company28,677,057.42-88,896,727.63117,573,785.05 -132.26% 1. Operating income: increased by RMB 23.41 million with an increase of 34.49% over the same period of last year. The main reasons were i. In the report period, Changsha SEG and Changsha Hotel of Shenzhen Mellow Orange Business Hotel Management Co., Ltd. (hereinafter referred to as Mellow Orange Hotel) started operation which increased the operating income of the Company; ii. Income from Buy-it Store increased compared with the same period of last year.2. Operating cost: increased by RMB 24.75 million with an increase of 77.96% over the same period of last year. The main reason was the increase of operating income caused the increase of operating cost accordingly.3. Operating tax and extras: increased by RMB 710,000 with an increase of 23.62% over the same period of last year. The main reason was the increase of operating income caused the increase ofoperating tax and extras accordingly.4. Sales expense: increased by RMB 460,000 with an increase of 51.18% over the same period of last year. The main reason was the increase of operating income caused the increase of sales expense accordingly.5. Losses from devaluation of assets: no losses from devaluation of assets occurred in the report period, whereas that was RMB -1.5 million in the same period of last year. The main reasons was part of account receivable which had been withdrawn losses of bad debts in the same period of last year was taken back through lawsuit.6. Investment gains: increased by RMB 112.79 million over the same period of last year. The main reason was the losses of Shenzhen SEG Samsung Co., Ltd. (hereinafter referred to as SEG Samsung) in which the Company holds 22.45% of its equity decreased in the report period over the same period of last year.7. Operating profit: increased largely over the same period of last year. The main reasons were the losses of SEG Samsung in which the Company holds 22.45% of its equity decreased in the report period over the same period of last year causing a large decrease in investment losses.8. Non-operating income: decreased by RMB 1.48 million with a decrease of 91.42% over the same period of last year. The main reasons were the Company switched back the account payable which it did not need to pay in the same period of last year, but no such switch-back occurred in the report period.9. Total profits: increased largely over the same period of last year. The main reason was the same as that of Item 7.10. Income tax expense: increased by RMB 3.64 million with an increase of 157.26% over the same period of last year. The main reason was the profit payable of this report year went up and income tax rate of this report year in Shenzhen also grew.11. Net profit: increased largely over the same period of last year. The main reason was the same as that of Item 7.12. Net profit attributable to owners of parent company: increased largely over the same period of last year. The main reason was the same as that of Item 7.13. Basic earnings per share: increased largely over the same period of last year. The main reasons were the same with Item 7.14. Diluted earnings per share: increased largely over the same period of last year. The main reason was the same as that of Item 7.15. Other consolidated income: increased by RMB 13.54 million largely over the same period of last year. The main reason was in the report period, SEG Samsung in which the Company holds 22.45% of its equity received the financial support funds amounting to RMB 56 million from its shareholder Samsung Corning Investment Co., Ltd., thus RMB 12.57 million was added into other consolidated income of the Company.16. Total consolidated income: increased largely over the same period of last year. The main reasons were the same as that of Items 7 and 15.17. Total consolidated income attributable to owners of parent company: increased largely over the same period of last year. The main reason was the same as that of Items 7 and 15.III. Cash flow statement itemItem Amount in thisperiodAmount in thesame period oflast yearBalanceProportion ofchanges %Other cash receivedrelating to operating activities64,583,939.9735,621,486.0928,962,453.88 81.31% Cash paid to/for staff andworkers11,883,672.359,605,770.002,277,902.35 23.71%Other cash paid relating to53,590,151.5031,135,749.7322,454,401.77 72.12% operating activitiesCash received from0.002,198,720.24-2,198,720.24 -100.00% recovering investmentNet cash received from15,444.00141,500.00-126,056.00 -89.09% disposal of fixed, intangible andother long-term assetsNet cash received from disposal0.0034,229,363.41-34,229,363.41 -100.00% of subsidiaries and other unitsCash paid for purchasing fixed,4,591,584.05701,547.003,890,037.05 554.49% intangible and other long-termassetsCash paid for investment 0.0053,030,000.00-53,030,000.00 -100.00% 1. Other cash received relating to operating activities: increased by RMB 28.96 million with an increase of 81.31% over the same period of last year. The main reasons were i. items of newly-opened Changsha SEG and Mellow Orange Hotel in the report period and newly-increased Buy-it Store in last May increased; ii. The general cashing business was developed in the electronic market, so the goods payment received on behalf of merchants increased.2. Cash paid to/for staff and workers: increased by RMB 2.28 million with an increase of 23.71% over the same period of last year. The main reasons were in the report period, Changsha SEG and Mellow Orange Hotel started operations, and the staff in Buy-it Store added increasing the salaries payable to the staff of the three companies.3. Other cash paid relating to operating activities: increased by RMB 22.45 million with an increase of 72.12% over the same period of last year. The main reasons were i. items of Changsha SEG and Mellow Orange Hotel newly-opened in the report period and Buy-it Store newly-increased last year increased; ii. The general cashing business was developed in the electronic market, the goods payment returning to merchants increased.4. Cash received from recovering investment: decreased by RMB 2.2million over the same period of last year. The main reason was in the same period of last year, the Company reduced the shares of Shenzhen Zero-Seven Co., Ltd. held by the Company amounting to 530,000, but no such sales occurred in the report period.5. Net cash received from disposal of fixed, intangible and other long-term assets: decreased by RMB 130,000 with a decrease of 89.09% over the same period of last year. The main reasons was the amount of fixed assets disposal in the same period of last year was bigger.6. Net cash received from disposal of subsidiaries and other units: decreased by RMB 34.23 million over the same period of last year. The main reasons was in the same period of last year, the Company received the equity account on selling former subsidiaries Shenzhen SEG Communications Co., Ltd, but no such sales of subsidiary occurred in the report period.7. Cash paid for purchasing fixed, intangible and other long-term assets: increased by RMB 3.89 million with an increase of 554.49% over the same period of last year. The main reasons were: the newly-opened Changsha SEG and Mellow Orange Hotel purchased fixed assets in the report period, thus the item increased.8. Cash paid for investment: decreased by RMB 55.03 million over the same period of last year. The main reason was in the same period of last year, the Company purchased 46 percent of the equity of Changsha SEG, but no such expenditure of equity acquisition occurred in the report period.3.2 Analysis and explanation of significant events and their influence and solutions□Applicable √Inapplicable3.3 Implementations of commitments by the Company, shareholders and actual controller√Applicable □InapplicableItem of CommitmentsPromiseeContent of commitmentsImplementationCommitments on Share Merger ReformInapplicable ----Commitments on share restricted tradeInapplicable ----Commitments made in Acquisition Report or Reports on Change in EquityInapplicable ----Commitments made in MaterialAssets ReorganizationInapplicable----Commitments made in issuanceShenzhen SEG Group Co., Ltd. Article 5 of the Equity Transfer Agreement which the Company had signed with SEG Group at the time of the Company’s listing stipulated: SEG Group permits the Company, as well as its subsidiaries of theCompany and affiliated companies to use the 8 registered trademarks that SEG Group has presently registered at the StateTrademark Office; italso permits theCompany to take the aforesaid trademarks and symbols that are similar to these marks as the symbol of the Company, as well as to use the aforesaid symbols or symbols that are similar to these symbols during the operation process; the Company doesn’t have to pay SEG Group any fee for the use of the aforesaidtrademarks or symbols.In the report period, this commitmentwas still executed according to thecommitment.Other commitments (includingadditional commitments)Shenzhen SEG Group Co., Ltd. According to the problem of “Yourcompany’s existing same industry competition in theelectronic market business with SEGIn the report period, controllingshareholder abided by the above commitment.Group” pointed outby Shenzhen Securities Regulatory Bureau in 2007 at the spot investigation of the Company, the Company received written Commitment Letter from SEG Group on Sep.14, 2007 and the content was as follows: our Group has similar business in Shenzhen electronic market with Shenzhen SEG Co., Ltd. (Shenzhen SEG), and the business was resulted by history and it has objective market developmentbackground. The Group made commitment: For the future, we do not operate on the market which is similar to Shenzhen SEG singly in the same city. The aforesaid matters have been disclosed in Securities Times ,China Securities Journal and Hong Kong Wen Wei Po and Juchao Website dated Sep. 18, 2007. In the report period, the holding company observed the above commitment.3.4 Estimation of accumulative net profit from the beginning of the year to the end of next report period to be a loss probably or the warning of its material change compared with the same period of last year and explanation of its reason √Applicable □InapplicableFore-notice of performances Carry-back of lossesYear-beginning to the end of next report period The same period oflast yearChange of increase/decrease (%)Estimated amount ofaccumulative net profit(RMB’0000)Approximately 1,600.00to2,700.00-14,608.35 -- -- Basic earnings per share(RMB/Share)Approximately 0.0204 to -0.1861 -- --0.0344Explanations onfore-notice ofperformances(1) SEG Samsung in which the Company holds its equity is predicted to suffer aloss accumulatively from RMB 30 million to RMB 50 million from year-beginning toend of next report period;(2) The performance prediction has not been pre-audited by CPAs.3.5 Other significant events which need explanations3.5.1 Particulars about securities investment □Applicable √Inapplicable3.5.2 Registration form of receiving research, communication and interview in the report periodDate Place Way ObjectsDiscussed main contents andsupplied materials Jan. 6, 2010 Office of the Company Telephone communication Investors Basic information of theCompany Feb. 12, 2010 Office of the Company Telephone communication Holder of B share Basic information of theCompany Mar. 26, 2010 Office of the Company Telephone communication Holder of B share Basic information of theCompany Apr. 7, 2010Office of the CompanyEnquire in written formSecurities DailyGot to know relevant public information of the Company3.5.3 Explanations of other significant events √Applicable □InapplicableThe net profit attributable to owners of parent company disclosed in the 1st quarterly report 2009 was RMB 2.85 million, but that of the same period of last year disclosed in the report was RMB -88.21 million, with the change amount of RMB -91.06 million. The reason for such change was the net profit attributable to owners of parent company of SEG Samsung in which the Company holds 22.45% of its equity disclosed in the 1st quarterly report 2009 was RMB-122 million, whereas that of the same period of last year disclosed in 1st quarterly report 2010 was RMB -504 million. The Company calculated the investment gains from SEG Samsung based on equity method, which caused the investment losses of the same period of last year disclosed in this report of the Company increased by RMB 91.06 million over that disclosed in the 1st quarterly report of 2009.3.6 Particulars about derivatives investment □Applicable √Inapplicable3.6.1 Particulars about derivatives investment held at the end of report period □Applicable √Inapplicable§4. Appendix4.1 Balance sheetPrepared by Shenzhen SEG Co., Ltd. March 31, 2010 Unit: RMBBalance at period-end Balance at year-beginning Items Consolidation Parent Company Consolidation Parent Company Current assets:Monetary funds 498,955,096.86372,852,381.52485,135,270.94 375,350,393.53 SettlementprovisionslentCapitalTransactionassetfinancereceivableNotesAccounts receivable 17,234,225.88400,000.0018,130,631.40 1,134,357.47 Accounts paid in advance 20,037,842.341,081,095.0018,404,268.08 8,035,295.00 receivableInsurancereceivablesReinsuranceContract reserve ofreinsurance receivableInterest receivable 2,460,821.922,460,821.922,460,821.92 2,460,821.92Dividend receivableOther receivables 12,042,162.4945,095,461.3911,971,998.74 45,306,466.00 Purchase restituted financeassetInventories 1,919,437.275,886,392.39 Non-current asset duewithin one yearassetsOthercurrentTotal current assets 552,649,586.76421,889,759.83541,989,383.47 432,287,333.92 Non-current assets:Granted loans and advancesFinance asset available for4,229,970.093,548,500.003,843,571.87 3,304,100.00 salesHeld-to-maturityinvestmentLong-term accountreceivableLong-term equity129,274,947.39310,372,446.43119,732,099.86 300,829,598.90 investmentInvestment property 438,740,452.42345,143,558.87442,502,999.44 347,797,315.91 Fixed assets 210,589,972.7523,031,843.38189,516,718.30 23,314,450.93 Construction in progress 9,776,526.6826,192,075.55materialEngineeringDisposal of fixed assetassetbiologicalProductiveOil and gas assetIntangible assets 4,681,177.38610,581.394,756,432.31 651,865.38 Expense on Research andDevelopmentGoodwill 10,328,927.8210,328,927.82Long-term expenses to be 13,684,505.73961,414.0213,041,779.82 1,165,451.06apportionedDeferred income tax asset 7,586,398.995,994,015.937,586,398.99 5,994,015.93 assetnon-currentOtherTotal non-current asset 828,892,879.25689,662,360.02817,501,003.96 683,056,798.11 Total assets 1,381,542,466.011,111,552,119.851,359,490,387.43 1,115,344,132.03 Current liabilities:Short-termloansLoan from central bankAbsorbing deposit andinter-bank depositborrowedCapitalTransaction financialliabilitiespayableNotesAccounts payable 7,716,840.382,149,017.128,225,509.02 2,178,169.12Accounts received in90,214,246.1242,701,579.41105,563,890.39 65,801,272.52 advanceSelling financial asset ofrepurchaseCommission charge andcommission payableWage payable 1,172,559.9524,450.874,261,476.99 2,065,724.98 Taxes payable 26,095,556.9526,470,386.0424,421,758.66 24,773,634.49 payableInterestDividend payable 921,420.73153,403.29921,420.73 153,403.29 Other accounts payable 95,328,850.9637,415,008.7786,454,289.91 41,932,495.62 payablesReinsuranceInsurance contract reserveagencySecurity trading ofSecurity sales of agencyNon-current liabilities duewithin 1 yearliabilitiescurrentOtherTotal current liabilities 221,449,475.09108,913,845.50229,848,345.70 136,904,700.02 Non-current liabilities:loansLong-termpayableBondspayableLong-termaccountSpecial accounts payableliabilitiesProjectedDeferred income tax liabilities 22,970,034.63547,125.7123,160,034.29 547,125.71 non-currentliabilitiesOtherTotal non-current liabilities 22,970,034.63547,125.7123,160,034.29 547,125.71 Total liabilities 244,419,509.72109,460,971.21253,008,379.99 137,451,825.73 Owner’s equity (or shareholders’equity):Paid-in capital (or sharecapital)784,799,010.00784,799,010.00784,799,010.00 784,799,010.00 Capital public reserve 409,833,425.36407,164,608.41396,922,482.95 394,348,208.41 Less: Treasury stocksReasonable reserveSurplus public reserve 102,912,835.67102,912,835.67102,912,835.67 102,912,835.67 Provision of general riskRetained profit -252,672,245.53-292,785,305.44-268,431,923.52 -304,167,747.78 Balance difference offoreign currency translation-536,479.61-542,916.63Total owner’s equity attributableto parent company1,044,336,545.891,002,091,148.641,015,659,488.47 977,892,306.30 Minority shareholders’ interests 92,786,410.4090,822,518.97Total owner’s equity 1,137,122,956.291,002,091,148.641,106,482,007.44 977,892,306.30 Total liabilities and owner’sequity1,381,542,466.011,111,552,119.851,359,490,387.43 1,115,344,132.03 4.2 Profit statementPrepared by Shenzhen SEG Co., Ltd. Jan.-Mar. 2010 Unit: RMBAmount in this period Amount in last period ItemsConsolidation Parent Company Consolidation Parent Company I. Total operating income 91,307,818.0528,545,784.8967,892,989.04 28,312,781.50 Including: Operating income 91,307,818.0528,545,784.8967,892,989.04 28,312,781.50 InterestincomeInsurancegainedCommission charge andcommission incomeII. Total operating cost 64,748,815.0510,069,765.9037,235,307.68 6,271,611.87 Including: Operating cost 56,496,489.228,821,226.1931,746,485.69 6,224,508.93 InterestexpenseCommission charge andcommission expenseCash surrender valueNet amount of expense ofcompensationNet amount of withdrawalof insurance contract reserveBonus expense of guaranteeslipReinsuranceexpenseOperating tax and extras 3,724,614.301,652,232.843,012,887.52 1,426,154.86 Sales expenses 1,370,260.25906,378.64Administration expenses 6,914,893.783,749,113.976,753,654.36 3,527,096.41 Financial expenses -3,757,442.50-4,152,807.10-3,684,098.53 -3,406,148.33Losses of devaluation of asset -1,500,000.00-1,500,000.00Add: Changing income offair value (Loss is listed with“-”)Investment income (Loss is-3,029,152.47-3,029,152.47-115,823,698.14 -115,823,699.14 listed with “-”)Including: Investmentincome on affiliated companyand joint ventureExchange income (Loss islisted with “-”)III. Operating profit (Loss is23,529,850.5315,446,866.52-85,166,016.78 -93,782,529.51 listed with “-”)Add: Non-operating income 139,079.30300.001,620,912.10 1,486,477.57Less: Non-operating41,229.18100,985.93expenseIncluding: Disposal loss ofnon-current assetIV. Total Profit (Loss is listed23,627,700.6515,447,166.52-83,646,090.61 -92,296,051.94 with “-”)Less: Income tax 5,951,587.044,064,724.182,313,487.22 450,000.00V. Net profit (Net loss is listed17,676,113.6111,382,442.34-85,959,577.83 -92,746,051.94 with “-”)Net profit attributable to15,759,677.9911,382,442.34-88,214,473.65 -92,746,051.94 owner’s equity of parentcompanyMinority shareholders’ gains1,916,435.622,254,895.82and lossesVI. Earnings per sharei. Basic earnings per share 0.02010.0145-0.1124 -0.1182 ii. Diluted earnings per share 0.02010.0145-0.1124 -0.1182 VII. Other consolidated income 12,964,835.2412,816,400.00-574,782.68 -682,253.97 VIII. Total consolidated income 30,640,948.8524,198,842.34-86,534,360.51 -93,428,305.91 Total consolidated income28,677,057.4224,198,842.34-88,896,727.62 -93,428,305.91 attributable to owners of parentcompanyTotal consolidated income1,963,891.432,362,367.11attributable to minorityshareholders4.3 Cash flow statementPrepared by Shenzhen SEG Co., Ltd. Jan.-Mar. 2010 Unit: RMBAmount in this period Amount in last period ItemsConsolidation Parent Company Consolidation Parent Company I. Cash flows arising fromoperating activities:Cash received from selling76,838,162.928,489,484.2877,509,335.13 16,793,838.47 commodities and providinglabor servicesNet increase of customerdeposit and inter-bank depositNet increase of loan fromcentral bankNet increase of capitalborrowed from other financialinstitutionCash received fromoriginal insurance contract feeNet cash received fromreinsurance businessNet increase of insuredsavings and investmentNet increase of disposal oftransaction financial assetCash received from interest,commission charge andcommissionNet increase of capitalborrowedNet increase of returnedbusiness capitalWrite-back of tax receivedOther cash receivedrelating to operating activities64,583,939.9735,796,951.0335,621,486.09 34,108,393.77 Subtotal of cash inflowarising from operating activities141,422,102.8944,286,435.31113,130,821.22 50,902,232.24 Cash paid for purchasingcommodities and receivinglabor service34,506,524.285,428,566.4833,515,780.98 4,689,090.60Net increase of customerloans and advancesNet increase of deposits incentral bank and inter-bankCash paid for originalinsurance contractcompensationCash paid for interest,commission charge andcommissionCash paid for bonus ofguarantee slipCash paid to/for staff andworkers11,883,672.355,234,585.349,605,770.00 4,602,269.51 Taxes paid 23,601,020.7018,545,462.2824,959,921.99 18,464,019.40 Other cash paid relating tooperating activities53,590,151.5017,876,799.3431,135,749.73 14,893,005.25Subtotal of cash outflowarising from operating activities123,581,368.8347,085,413.4499,217,222.70 42,648,384.76Net cash flows arisingfrom operating activities17,840,734.06-2,798,978.1313,913,598.52 8,253,847.48II. Cash flows arising frominvesting activities:Cash received from recovering investment 2,198,720.242,198,720.24Cash received frominvestment income5,270,590.49 Net cash received from 15,444.00141,500.00。
面板数据分析与Stata应用_浙江大学中国大学mooc课后章节答案期末考试题库2023年

面板数据分析与Stata应用_浙江大学中国大学mooc课后章节答案期末考试题库2023年1.关于xtabond2这一命令的使用,以下说法错误的是:答案:iv( ) 内放置的是内生的解释变量2.关于门限面板模型的估计,以下说法错误的是:答案:使用 xthreg 命令确定门限值时,是将门限变量的所有值逐一代入进行计算的3.以下哪组数据是短面板数据?答案:N=31,T=214.以下哪个不是非观测效应模型(存在不可观测的个体效应的模型)?答案:混合回归模型5.以下哪个选项符合随机效应模型的设定?答案:不可观测的个体效应与所有解释变量不相关6.使用xtscc命令估计,得到的标准误是:答案:Driscoll-Kraay标准误7.使用聚类稳健的标准误,不能解决以下三大问题中的哪一个?答案:截面相关8.短面板数据模型中的husman检验适用于哪两种模型之间的选择判断?答案:固定效应模型与随机效应模型9.以下命令中,无需其他选项就能够同时处理组内误差自相关、组间异方差和组间相关这三大问题的命令是?答案:xtscc10.以下哪个命令能够检验长面板数据的组间相关问题?答案:xttest211.以下哪个命令没有同时处理三大问题?答案:xtpcse lnc lnp lnpmin lny state2-state10 t, corr(ar1) hetonly12.三阶段最小二乘法的命令是:答案:reg313.以下哪个命令没有同时处理三大问题?答案:xtgls lnc lnp lnpmin lny state2-state10 t,corr(ar1) panels(heteroskedastic) 14.对于解释变量与误差项存在相关性这一内生性问题,以下说法错误的是:答案:其余选项均不正确15.关于两阶段最小二乘法,以下说法错误的是:答案:其余选项均不正确16.以下不属于内生性的三大检验的是:答案:异方差检验17.如果在强相关性检验中,发现当前使用的工具变量是弱工具变量,那么以下说法错误的是:答案:此时不存在任何可以解决的方法,IV方法不再适用18.关于理解DID方法的方式,以下说法错误的是:答案:其余选项均不正确19.以下关于DID模型的设定,表示错误的是:答案:多组多期:20.以下方法中,不属于安慰剂检验的是:答案:可以按照样本的异质性特征,将样本分为不同的小组,在不同组内进行回归21.如果对照组和处理组不满足共同趋势的假定,以下解决方法中不正确的是:答案:不必在意,不满足共同趋势假设也可以继续使用DID方法22.关于合成控制法,以下说法错误的是:答案:合成控制法无法解决选择控制组时存在的主观随意性问题23.关于合成控制法中合成地区的构建,以下说法正确的是:答案:其余三个说法都正确24.下图是上课所举案例在 stata 中运用合成控制法的 synth 命令得到的部分结果:根据上述运行结果,以下说法错误的是:答案:由于预测变量的拟合效果均很好,cigsale(1975)、cigsale(1980)、cigsale(1988) 这三个变量可以省去25.我们可以通过如下目标函数来确定最优带宽:,以下说法错误的是:答案:三角核函数相当于普通 OLS 回归,矩形核函数相当于加权的 OLS 回归26.对动态面板模型使用固定效应方法进行估计时,估计结果一定是有偏且不一致的。
Egypt2010

Zabbaleen"" . Or€lanic waste can be transformed into compost
.
'" ,
__
.
A*:. f :W,:.r,'*fl"T' i{i}ilj":i
. To implement a system to transform organic waste into high
Garbage disposat methods in El Warraq island
*ffiffi#?wffis...
. To decrease the piles of garbage on the island. . To increase hygienic awareness among the inhabitants. . To sustain the sanitation on the island.
recycling system
in "Hay El
. Although Govern#6nt banned cultivation of direct consumption crops using contaminated water. farmers irrigate illegally their
r#
Market economics
Success
Skills
. Supplying the market with new sources of Compost. . Signed two sales contracts of 324 tons of eompost in 2A3,L.
inconvenient infrastructure and location t34O m awa\ from
- 1、下载文档前请自行甄别文档内容的完整性,平台不提供额外的编辑、内容补充、找答案等附加服务。
- 2、"仅部分预览"的文档,不可在线预览部分如存在完整性等问题,可反馈申请退款(可完整预览的文档不适用该条件!)。
- 3、如文档侵犯您的权益,请联系客服反馈,我们会尽快为您处理(人工客服工作时间:9:00-18:30)。
Solar American Board for Codes and Standards2010 Gap Analysis Final ReportJuly 12, 2010SummaryThe Solar America Board for Codes and Standards (Solar ABCs) 2010 Gap Analysis process was a formal review of the current state of the major codes and standards that bear on PV. The process identified major gaps that exist in the current work on codes and standards. These were then prioritized and developed into a strategic plan for the activities of the Solar ABCs for Year 4 and future years. Wherever possible, Solar ABCs will address the highest priority activities. Solar ABCs will also recommend others to address some of the important remaining activities.From topics suggested by stakeholders, the Solar ABCs Steering Committee identified the following high priority topics to be addressed and placed them in this order.Highest Priority Topic•Follow-up Research on Flammability IssuesSecond Highest Priority Topics•Ground Fault Protection Improvements to Prevent Fires•Standards for PV and Energy Storage•Connection Issues of PV to the Smart Grid•Guidelines for Utility Inspections of PV SystemsThird Highest Priority Topics•Training for Installers and Fire Officials•Develop operation and maintenance best practice guidelines including periodic safety-targeted inspection programs for Bypass-Diode Failures•National Model Fire Guidelines•Model Building Codes (ICC)•Extend Expedited Permitting Guidelines to More Small Systems•Develop Permit Guidelines for Large Systems•Accuracy of Electro-Mechanical Meters•Time-of-use Rate StructuresThe following topics are recognized as being high priority, but the Solar ABCs will defer any work on these topics until further research or work at national labs is complete:•Inverter Qualification Standard•Standards for Power Conditioning and DC-DC- Converters•Standards for High Penetration SolarSolar ABCs recommends that, if possible, DOE fund the following task outside of the Solar ABCs as this task requires more resources than Solar ABCs currently has available.•Web-based Code Official TrainingThe following topics are also recognized as high priority, but other organizations are working on the tasks already:•Testing for Firefighter Safety (Underwriters Laboratories)•Large Generator Interconnection Standards (Federal Energy Regulator Commission)The Solar America Board for Codes and Standards (Solar ABCs) is a collaborative effort among experts to formally gather and prioritize input from the broad spectrum of solar photovoltaic stakeholders including policy makers, manufacturers, installers, and consumers resulting in coordinated recommendations to codes and standards making bodies for existing and new solar technologies. The U.S. Department of Energy funds Solar ABCs as part of its commitment to facilitate widespread adoption of safe, reliable, and cost-effective solar technologies. For more information, visit IntroductionThe Solar America Board for Codes and Standards (Solar ABCs) Gap Analysis process reviewed the current state of the major codes and standards that bear on PV, identified major gaps that exist in the current work on codes and standards and prioritized these to become a strategic plan for the development of the Solar ABCs Annual Work Plan for future years. This document reports on the results of the 2010 gap analysis process. Solar ABCs also conducted a gap analysis process in 2008.This report summarizes the method used to conduct the gap analysis, lists the potential topics identified, and establishes the priorities of the topics that will become the future work by Solar ABCs and others. In Years 4 and 5 of its contract with the U.S. Department of Energy, Solar ABCs will work on as many of the high priority topics as resources allow.The Solar America Board for Codes and Standards (Solar ABCs) is a collaborative effort among experts to formally gather and prioritize input from the broad spectrum of solar photovoltaic stakeholders including policy makers, manufacturers, installers, and consumers resulting in coordinated recommendations to codes and standards making bodies for existing and new solar technologies. The U.S. Department of Energy funds Solar ABCs as part of its commitment to facilitate widespread adoption of safe, reliable, and cost-effective solar technologies. For more information, visit The Solar ABCs changes the practice of developing, implementing, and disseminating solar codes and standards in the following ways:•By providing formal coordination in the planning and revision of separate, though interrelated, solar codes and standards•By providing access for stakeholders to participate with members of standards making bodies in setting national priorities on technical issues•By developing a centralized repository for collection and dissemination of documents, regulations, and technical materials related to solar codes and standards•And by creating a centralized home for three key technical services: a) generating consensus ‘best practices’ materials and disseminating such materials to utilities, state and other regulating jurisdictions, b) answering code-related questions (technical or statutory in nature), c) providing feedback on important related issues to DOE and government agencies.MethodA Gap Analysis was a major project for the Solar ABCs Steering Committee during its first year of operation. This second Gap Analysis was conducted two years after the first one. Stakeholders provided topics for consideration, the Advisory Committee and Steering Committee refined and prioritized the list of topics, and the Steering Committee developed the final list of high priority Gap Analysis topics.Prior to soliciting stakeholder input for Gap Analysis, the first step was to develop a list of potential topics (or gaps) beginning with topics suggested during the first Gap Analysis process, but which had not been designated high priority. Included in this list were also high priority topics identified during the first process, but for which work has not yet begun. Finally, before soliciting new stakeholder input, a list was compiled that included all gaps suggested to the Solar ABCs Project Administrator since the completion of the first Gap Analysis.Next, in the September 2009 Newsletter, Solar ABCs requested Gap Analysis input from all stakeholders. This was followed by the annual Solar ABCs Stakeholder meeting on October 29, 2009, during which the Project Administration briefed stakeholders on the Gap Analysis process and encouraged Stakeholders to submit potential topics. Stakeholders submitted proposed topics to the Project Administrator as a result of these requests.The Project Administrator compiled the list and sent it to both the Steering Committee and the Advisory Committee for review and discussion. These discussions led to combining topics, adding topics, and reorganizing the way the topics were presented in order to facilitate better review and prioritization. The final list of proposed Gap Analysis topics is included in Appendix A.The Advisory Committee and Steering Committee each reviewed and prioritized the Gap Analysis list. The Project Administrator compiled the results.Finally, the Steering Committee conducted a day and a half meeting to prioritize the Gap Analysis topics. The Steering Committee reviewed the individual rankings, discussed, and approved a list of high priority Gap Analysis Topics. Then the Steering Committee developed detailed suggestions for the activities needed for each of the high priority topics. The Gap Analysis Process was led by the Solar ABCs Steering Committee and managed by the Solar ABCs Project Administrator, Larry Sherwood. The Steering Committee includes one representative from the following organizations: Arizona State University, BEW Engineering, Brooks Engineering, Florida Solar Energy Center, Interstate Renewable Energy Council, National Renewable Energy Laboratory, New Mexico State University, North Carolina Solar Center, PowerMark, Sandia National Laboratories, Sunset Technology, Underwriter Laboratories, and U.S. Department of Energy plus a representative from the Solar ABCs Advisory Committee.At the time of the Gap Analysis process, the Solar ABCs Advisory Committee included: Jim Baak, Vote Solar; Jon Bertolino, Sacramento Municipal Utility District; Suzanne Borek, New Jersey Department of Community Affairs; Alexander Bradley, Dupont; Nick Chaset, formerly with the California Public Utilities Commission; Marv Dargatz, Enphase Energy; Adam Detrick, SunPower Corp.; Mark Dougherty, Long Island Power Authority; Ryan Gaston, Dow Chemical Co.; Smita Gupta, Itron; Tom McCalmont, McCalmont Engineering; Colin Murchie, Solar City; Rhone Resch, Solar Energy Industries Association; Wilson Rickerson, Rickerson Energy Strategies; Mike Taylor, Solar Electric Power Association; Peter Varadi, Consultant; and Donald Warfield, BP Solar.First and Second TierHigh Priority Gap Analysis TopicsFOLLOW-UP RESEARCH ON FLAMMABILITY ISSUESRESEARCH OBJECTIVES1.Provide specific tests and procedures that can be applied to PV installations andcomponents to verify that they will have no impact on the fire rating of roof assemblies (with an emphasis on Class A rated roof assemblies).2.Develop these tests and procedures into the form needed to serve as input formodifications to existing codes and standards such as UL1703, ICC, Model Codes, etc.TEST PLANFollowing tests to be conducted at UL Fire Test Laboratory1.Conduct Class A Spread of Flame tests on Class C PV module mounted over Class Aroofs to see if the roof assembly will routinely pass Class A Spread of Flame test.Conduct tests for three different geometries, different module types, and over non-combustible roof products.2.Verify the Burning Brands Tests previously conducted in order to define whenmitigation is required. Conduct tests for different brand locations, different module types, and different roof types including non-combustible roof products. Investigate potential caloric load of debris accumulated under solar array to determine which size burning brand is appropriate for placement between the PV modules and the roofassembly.3.Conduct Class A Spread of Flame tests for modules at tilts that are not parallel to theroof surface in order to determine how their performance compares with testsconducted on modules parallel to the roof surface.4.Test several Spread of Flame mitigation techniques in order to develop mitigationrecommendations. Document all test methods for preparation of recommendations that these be added to existing standard.5.Develop and test Burning Brand mitigation techniques in order to provide mitigationrecommendations. Tests to be developed after Item 2 tests define when mitigation is required. Develop language for required maintenance and cleaning between module and roof assembly.6.Conduct Spread of Flame test on a large array to learn if tests conducted on singlemodules scale accurately to arrays with many modules.New contractor to be identified for the following task:7.Perform research to quantify the potential risk identified by the test results. A fireprotection research engineer, economist, or actuarial insurance consultant will be hired to conduct this research.DELIVERABLE: Solar ABCs ReportTIME: Year 4GROUND FAULT PROTECTION IMPROVEMENTSGAP: Ground faults have and will continue to be significant cause of failures andfire/fire risk. Arc-fault detection and mitigation measures underdevelopment are not mature for the PV industry and may not address many of the line to ground faults that are common in PV systems. Existing ground fault protection in inverters will not always detect faults in the grounded conductors, and subsequent faults can go uninterrupted (as in the case of the Bakersfield fire) and lead to damaging fires.SOLUTION: Review and make recommendations on mitigating measures for reducing the risk of damaging ground-faults. These include targeted measures such as improvements to existing ground fault detection circuits in inverters, and/or additional over-current protection in the grounded circuits, to larger systemic solutions such as an emphasis on floating or high-impedance grounded systems as is commonly done in Europe and Asia. The analysis should include cost/benefit of different options as criteria, both for retrofitting existing systems and for new systems.AUDIENCE: Code and standard makers, inverter manufacturers, industry designers and integrators.WHO: Solar ABCs should take a lead role in developing recommendations and consensus, and can leverage external activities (such as UL-STP work in the protection area).LEVEL OF EFFORT: Relatively low to develop problem statement and awareness, and help spearhead solutions with industry.ENERGY STORAGE AND PV STANDARDS FOR GRID-TIED SYSTEMS smoothing for high penetration, or networks with regard to grid-tied PV getting most out of the PV modules.GAP: A methodology for optimizing power conditioning of PV hybrid systems exists for off-grid applications. An equivalent methodology does not exist for grid-connected PV applications. Currently being applied in an ad-hoc way.SOLUTION:•Gather existing data(Cost-benefit analysis, literature search and review, gather field data on existingdemonstration projects - e.g. Lanai, Portland General Electric, San Ramon Facility) •Write a White Paper on information gathered(Potential value to utilities, potential interactions with Smart Grid functions,recommendations for additional investment if needed)AUDIENCEUtilities, System Integrators, System designers, Public utility commissionsEventually, funding bodies, EPRIWHOSolar ABCsOverseeing the projectProgress reviewsWhite paperLabsNRELSandia National Laboratories (SEGIS, Storage)PNNLOther test labs – ASU, DUITNIST Smart Grid groupUtilities (SMUD, Xcel, APS, AEP, OUC, PNM, etc.)EPRI membersNYSERDA, CEC, other state energy offices, which may have funding availableLEVEL OF EFFORTSolar ABCs:Overseeing, performing lit searchesWriting white paperLabs, utilities and manufacturers:Data sharingWriting/reviewing white paperAdditional effort would likely be required based on results of white paperSTANDARDS FOR CONNECTION OF INTELLIGENT PV OR DG SYSTEMS TO UTILITY SMART GRIDS OR MICROGRIDSGAP: Most inverter manufacturers may not aware of requirements to interface with smart grid and do not seem to be participating in development of interface, though ~5 contractors are required to be involved through SEGIS (solar energy grid integration systems) SOLUTION: Identify current activities and inverter communication issues; get manufacturers involvedAUDIENCE: Inverter manufacturers, project developers, utilitiesWHO: NC Solar CenterLEVEL OF EFFORT: limitedDELIVERABLE: Two-page description, webinarWHEN: Year 4DEVELOP OPERATIONS AND MAINTENANCE BEST PRACTICES GUIDELINEGAP: There needs to be an larger overall system inspection procedure, for periodic evaluation of component damage that can result in later failures - including diodes, cabling, connections, etc. An example issue is undetected bypass-diode failures may be an endemic industry-wide sleeper problem and may lead to long term and failure/fire concerns. Need to determine the extent of problem and develop solutions.SOLUTION: Outline and draft high-level and targeted inspection procedures. Leverage existing expertise in the area to create publicly available guidelines, which can be individually tailored for specific applications and market segments, e.g. residential systems with shading, vs. large scale commercial, event targeted inspections such as post lightning strike, e.g. apply inspection protocols and take note on each inspection item's value and resulting importance. Consider research on non-invasive, low labor methods of detecting bypass diode failures, e.g. high frequency or AC impedance measurements at the string or combiner box level. Also consider quality-based problems — better test standards for the diodes themselves. Consider an initial survey — targeted inspections to try and get some statistical understanding of the extent of the problem.AUDIENCE: Installers, owners.WHO: Solar ABCs led effort, possible leveraging of research and testing tasks.DELIVERABLE: Report with Guideline recommendations.EXTEND EXPEDITED PERMITTING GUIDELINES TO MORE SMALL SYSTEMSGAP: Further expedite the process. There may be a gap for ac modules and other new technologies such as string inverter concepts.SOLUTION: Update Expedited Permit Process report and then keep it up to date. Include minor expansions for new technologies.AUDIENCE: Code officials, installers, designersWHO: Brooks EngineeringLEVEL OF EFFORT: SmallDELIVERABLE: Revised Expedited Permit ReportWHEN: Year 4INTERNATIONAL CODE COUNCIL (ICC) CODE DEVELOPMENT Prioritized topic was Model Building Codes Regarding PV(recommendation developed by Larry Sherwood)GAP: Stakeholders are not participating in International Code Council (ICC) Code Development activities. Recently, ICC has considered code changes for the International Fire Code and the International Plumbing Code, which affect PV installations. SOLUTION: Solar ABCs should facilitate a group of stakeholders to develop code change proposals and provide comments on proposed changes. The group could operate similar to the PV Industry Forum, which provides recommendations for changes to the National Electrical Code. Codes include the International Building Code, the International Fire Code, the International Plumbing Code and the new International Green Construction Code. Perhaps this group could also comment on the Uniform Solar Energy Code developed by IAPMO.AUDIENCE: ICC, solar industry, code officialsLEVEL OF EFFORT: Moderate – need someone to coordinate the activity.WHEN: On-goingACCURACY OF ELECTRO-MECHANICAL METERS OPERATING IN THE REVERSE DIRECTION IS MUCH LOWER THAN AS DESIGNED FOR FORWARD OPERATIONGAP: A report from Measurement Canada indicates electro-mechanical meters operating in the reverse direction run slightly slowSOLUTION: Review Canadian study and meter standards to identify if inaccuracy in reverse direction is possible and recommend next steps (not testing meters)AUDIENCE: Utilities, utility commissions, standards bodies (NIST and ANSI)WHO: NCSC, BEW, or FSEC, etc. (or NIST or ANSI)DELIVERABLE: ReportEFFORT: Small effortRATE STRUCTURESGAP: No existing factual analysis of rate impact by utilitySOLUTION: Need analysis of impact on utilities of various rate structures, including flat, TOU and demand-metered. Need to address variations by utility of location, generation mix, etc.AUDIENCE: Utility commissions, legislatorsEFFORT: Huge if utility by utility, but helpful to start with a fewDELIVERABLE: ReportWHEN: Year 5Appendix A Suggested Gap Analysis Topics(in pdf file)STANDARDSNeeded StandardsStandards for Installation and OperationStandards for CPV Tests (done?)Standards for connection of intelligent PV or DG systems to utility smart grids or microgrids.May require more than one standard.Limitations in the NEC for determining the ampacity of conductors operating over 80 degress C.Standards on Manufacturing Safety PracticesTest standards for non-PV solar technologies (apart from solar thermal). Safety, reliability and performance testing standards. Examples are dish sterling technology and solar thermal for absorption chillers.User education standards, e.g. specify, use, test, measure, install, operate, maintain, integrate, connect, analyze, trouble-shoot, repairEVA Gel Content Test Method Validation (Need to make standard acceptable for PVmanufacturer)Standards for connections between equipment including hardware, firmware, softwareStandards for packing, labeling, shipping and recyclingManufacturing Waste Practices: Defined standards on manufacturing waste stream andsubcontractor waste management (follow up from Washington Post article on Poly wastedisposal)Standards for shipping & recycling –consider voluntary industry product take-back standards as well.Clairfy the boundary between UL listing and local permitting requirements.Standards/Certification ProcessNeed cell qualification process (Why do component testing if you still have to do moduletesting?)Concern about new UL test facility and near monopoly of UL with testingSignificant Interpretations from UL are onerous and in some cases require UL lab testing. Not fair for other NRTLs who may interpretate differently. Changes of this magnitude should be run through STP and written into standard.Overall certification process takes too longRestructure the UL Standards writing process to allow it to better meet the needs of an industry where the technology is changing rapidly.Exact list of polymeric materials tests (as per UL 1703) for encapsulant, junction box, cable, connector and backsheet.Certification/QualificationDevelop QA Guidelines for deterining lifetime testingEncourage adoption of Solar ABCs qualification policyCODESFire Safety IssuesFire Codes vs Electrical Codes when dealing with batteriesNational Model Fire Safety Guidelines (so California Guidelines do not become the nationalmodel)Follow-up work to Fire Safety Research Project (recommendations, more research?)Fire Rating of PV LaminatesBIPV and Fire Safety issuesTesting for fire safety. Generic testing to answer questions firefighters have about interaction of PV and structural fires.Flammability Testing of Roofs and Rack-mounted PVs (follow-up to previous research) Test a large array rather than one module (what is the sensitivity of results to the size of the array?). One manufacturer for all modules in the array. Are the completed results with one module the same or different as a test with a large array.Vary the impingement location of the flame so the flame is at the top of the PV module.Test varying stand-off heights to determine at what threshold the roofs passedCharacterize the exposure of the roof from a room of content fire over the roof eave.Test the performance of Class C PV on concrete tile roof (plus maybe metal roofing) oncombustible decks (non-combustible roofing) (790 test) How does this construction differ with current test results?Test other typical commercial applications. Vary tilt of module relative to roof. Low slopeWhat is correlation between Class A brand and debris accumulated under solar array in the field.Caloric load. (do literature search first)What is the extra potential fire risk from PV installations? Address field data.Research possible solutions (testing mitigation measures).NECGap between NEC 690 for PV and non-PV Concentrating Solar Power SystemsSemi-conductor based disconnects: right now, a solid-state wwitch is not allowed as a system disconnectSmart grid connections realted to fire safety and the NECInitiate discussions with NFPA concerning the lack of current technical expertise on Code Making Panels, which is significantly hampering the development of codes that address the requirements for the application of sophisticated electrical and electronic power conversion devices as well as circuits containing these devises.Investigate whether or not the dc overcurrent devices currently used in outdoor PV combiner boxes are or are not suitable for use in the PV combiner box environment.Model CodesWind Load Testing, Analysis and Design Code DevelopmentWind loading codes for ballasted rooftop systemsExpedited permitting and/or best practices for systems which do not fall within the criteria of the current expedited permitting processCompanion report to Expedited Permitting Report dealing with utility permitting/inspection best practices or recommendations.Web-based Code Official TrainingModel code should be developed for seismic areas (Some stakeholders thought this is notnecessary)Building Codes (non-electrical)Model building codes regarding PVCoordinate with ICCon model building codesOSHA rules on PV set-backs on roofsCoordinate with ICC-ES, on code compliant testing standardsINTERCONNECTION AND NET METERINGUtility Rate Design/Net MeteringResidential Rate Structures and Solar (AB1x/flat or volumetric rates vs. TOU rates) InterconnectionPotential of AMI Data to Reduce Technical Issues Related to InterconnectionExamination of NREL RSI Studies and guidance to states adopting interconnection procedures and net metering lawsOwnership data from AMI SystemsStandard for access to AMI data for Smart Grid interconnection priorities related to energyavailability and energy useageIssue of large installations and high penetration on grid stability. Can beneficial voltage support requirements and anti-islanding provisions co-exist?Accuracy of electro-mechanical meters operating in the reverse direction is much lower than as designed for forward operationReview of costs associated with different interconnections standards (Ca’s Rule 21, FERC Small Generator Interconnection Protocol). In CA, solar participating in CSI is subject to fast-track interconnection (no interconnection study), whereas through AB 1969 feed-in tariff, generators are subject to FERC SGIP, and therefore may have to bear the costs of interconnection studies and system upgrades.Common SW & HW connection protocal from all inverter manufactures: Mechanical connection, refresh rates, minimum data transferred.GENERAL OR CROSS-CUTTINGInstallation Guidance/Best PracticesProvide guidance for sizing line-side interconnection conductorsBest practices for solar thermal permits and inspections - wide variation in Minn. Some require3 inspections (plumbing, mechanical, structural)Work with OSHA to get roof safety issues before PV stakeholdersWhat tools, methods, knowledge, training is required to design, assemble, install functional systems – handbooks for designers, installers, usersBIPV IssuesDevelop research agenda to create data on which to base BIPV Standards related to NOCT test.Could be based on CEC specifications.Add BIPV to list of issues for Product Safety PanelParametric certification of BIPVInclude in NEC: BIPV IssuesPerformance StudyStudy the effects of airborne debris on PV modules or solar heating panels. Is this in regards to soiling or impact resistance/reliability?Study the effects of shading on PV performance. In particular in the context of PV Incentive Programs where incentive calculators that include shading calculations.Thermal interaction of BIPV with the building envelope and the effective heat transfer through the building element into the conditioned spaceUtility-Scale Solar PoliciesLarge Generator Interconnection Policies and ProceduresStreamlined Environmental PermittingRenewable Energy Transmission Access Policies & ProceduresSolar ABCs PROCESS/PRODUCTSStart Industrial Affiliates Program to fund some additive codes and standards work fromindustry.Conduct more discussions/presentations/webinars on reportsRedesign web site – current website is confusing. Want to be able to find reports easily.Some “quick survey” work with the stakeholders involved in these reports might be a useful addition – no more than 5 questions – firefighters, utilities, city planning departments, code inspectors, etc.。