INTERFEROMETRIC SAR DEM CONSTRUCTION FOR LANDSCAPE PROCESS ANALYSES IN NORTH-EASTERN ICELAN
“空-天-地”一体化技术在滑坡隐患早期识别中的应用——以兰州普兰太公司滑坡为例
第31卷第6期2020年12月中国地质灾害与防治学报TheChineseJouenaoooGeooogicaoHaaaed and Conteoo Voo.31 No.6Dec.2020D0N10. 16031/j. cnki. issn. 1003-8035.2020. 06. 02空•天•地"一体化技术在滑坡隐患早期识别中的应用一*以兰州普兰太公司滑坡为例侯燕军,周小龙,石鹏卿,郭富赞(甘肃省地质环境监测院,甘肃 兰州 730050)摘要:长时间序列SBAS-nSAR 形变监测,能够减弱误差带来的影响,提高监测精度,有效识别地质灾害隐患#研究获取了兰州地区2019年9月至2020年4月的L 波段升轨ALOS-2编程数据,利用“空-天-地”一体化地质灾害监测体系,基于小基线集(SBAS-nSAR )技术对兰州市普兰太有限公司滑坡进行了有效识别#经现场核查,滑坡宏观变形迹象明显,并与同期C 波段Sentinei1A 升轨数据处理对比分析,表明基于L 波段的SBAS-nSAR 形变监测在兰州市典型滑坡早期识别中发挥了很好的作用,可以在区域滑坡早期识别中推广应用# 关键词:“空-天-地”一体化;早期识别;地质灾害;SBAS-InSAR中图分类号:P642. 22文献标识码:A文章编号#1003-8035 (2020) 06-0012-09Application of “ Air-Spacc-Ground & integrated technology in early idenhncahon of landslide hidden danger : taking LanzZou PulantaiCompany Landsline as an exampleHOU Yanjun , ZHOU Xiaolong , SHI Pengqing , GUO Fuyun(Gansu Institute of Geological Environment Monitoring , Lanzhou , Gansu 730050 , China )Abstract : The deformation monitoring of SBAS-nSAR with long time series can reduca the influenca of errors ,impeoeethe monito eing accueacy " and e o ectieeoy identioy the hidden dange e o ogeo oogica odisaste es. The peogeammingdataooL-band eoeeated oebitALOS-2 in themain ueban aeeaooLanahou oeom Septembee2019 toApeio2020 weeeobtained in this study. The oands oide o oLan ahou PuoantaiCo. " Ltd. was e o ecti ee oy identi oiedbased on the smal l baseline set ( SBAS-nSAR ) technology by using the intecrated geelogical disastermonito eing system oo % integeation ooAie-Space-Geound & .Theough on-site ee ei oication " the maceoscopic deooemation signs o othe oands oide a ee ob eious " and thecompaeison and ana oysis with thesentineo-1 A oebit eising data p eoce s ing o othe C-band du eing the same pe eiod show thattheDeooemation monito eing o oSBAS- InSAR based on the L-band plays a veg good role in the eagy identification of typical landslides in LanzhouCity " and can bepopuoaeiaed and appoied in the ea eoy identi oication ooeegionaooandsoides.Keywords : inteogtion of “ AimSpaca 天r ound ” ; esrly identification ; geelogical disaster ; SBAS-nSAR收稿日期:2020-08-23 '修订日期:2020-09-24基金项目:甘肃省科技重大专项-社会发展类(19ZD2FA002)第一作者:侯燕军(1979-),甘肃秦安人,高级工程师,硕士研究生,主要从事水文地质、地质灾害、地质环境评价、地质灾害信息化建设等方面的研究 # E-mail :tighyj@ 163. ccm通讯作者:周小龙(1995-),男,甘肃漳县人,遥感科学与技术专业,本科,助理工程师,主要从事遥感技术在地质灾害防治方面的应用研究 o E-mail :zhoulongwiser@ 163. com第6期中国地质灾害与防治学报-13-0引言黄土高原地区是以黄土为主体的区域地貌,在以新构造活动为主的内动力和流水为主的外动力作用下形成的黄土高原地貌,为地质灾害的形成提供了空间条件,再加上特殊的气候条件、植被属性和土体特征,决定了地质灾害在区域空间上的分布[1],因此黄土高原地区极易发生地质灾害,严重威胁到人民群众生命财产安全#兰州地处黄土高原西部,属于黄河上游地区,青藏高原隆起区的东北边缘,青藏高原和黄土高原的交会处,市区属特殊的“两山夹一谷”的河谷地貌-2]。
永久散射体雷达干涉技术
• 计算P在从影像中的像素坐标Ps(rs,cs),Ps和Pm就是 一对同名点。
• 粗配准:从两幅SAR影像中识别出少量同名 点,基于其像素坐标偏移量,通过简单平 移,使主从影像同名点基本对应于同一分 辨单元。 • 精配准:精确搜索同名点的准确位置,通 过对从影像进行坐标变换和像元值插值重 采样,实现同名像点精确对应于地面同一 分辨单元。 • 相干系数法、最大频谱法、相位差影像平 均波动函数法
D
振幅信息双阈值法
• 1.振幅阈值法探测PSC(强反射性) • 计算所有像素的时序振幅值,获得振幅阈值:
• 分析各像素在辐射定标且配准后的SAR影像上的振幅时间 2, N T 序列值Ak,如果 minA k 1, 确定为 PSC
k A
m n 1 TA min A k i,j k 1 , 2, ,N m n i 1 j1
The
end
InSAR简介
• 是什么? • InSAR是利用不同空间位置获取同一目标的至少两幅SAR 影像,开展干涉测量数据处理,通过同一目标两次回波信 号的相位差获取该目标的高程或形变信息。 • 为啥有? • 1.早期SAR影像只利用灰度信息,忽视相位信息; • 2.受杨氏双缝干涉实验启发。 • 怎么用?
基本原理
2~4幅影像即可
一般不作平滑处理 突然、形变量大的地表活 动
20~30幅SAR影像
PSInSAR存在的主要问题
• • • • 1.自然地表PS密度低 角反射器成本高,不适合大规模推广 2.大气相位估计精度低 大气相位受水汽、温度、地形等复杂因素 影响,并与基线误差相位、DEM误差相位 耦合,目前没有哪一种方法具有很高的普 适性。 • 3.形变检测性能分析理论尚不成熟。
合成孔径雷达差分干涉测量
1. 只有形变对干涉图收到形变的影响; 2. 形变对于干涉图中形变不会影响有地面高程产生
的相位发生跳跃; 3. 地形对干涉图可以获得精确的DEM。
差分干涉测量的原理
四轨法
基本思想是选择四幅SAR图像,用其中 的两幅来生成DEM,另外两幅作变形监测。
三种方法比较
两轨法
优点:不需要相位解缠,减少了数据处理 的工作 量;避免了相位解缠引入的误差。
来消除地形相位。 在两轨法中,外部DEM的精度、空
间分辨率、插值方法及干涉基线对形 变量的精度都有显著的影响。
差分干涉测量的原理
三轨法
是由1994年由Zebker等人提出的,由 于该方法可以直接从SAR图像中提取出地 表形变信息,被认为是差分干涉模型最经 典的方法。
差分干涉测量的原理
三轨法
原理是采用三幅SAR图像,以其中的一幅作 为主图像,另外两幅作为从图像,可与主图像分 别生成两幅干涉图。
差分干涉测量在地震监测的应用
差分干涉测量地震监测的应用
差分干涉测量地震监测的应用
地震可以引起电离层异常
差分干涉测量在地表沉降监测的应用
谢谢观赏
WPS Office
Make Presentation much more fun
合成孔径雷 达差分干涉
测量
引言
合成孔径雷达(Synthetic Aperture Radar,简称SAR),是一
种工作在微波波段的主动式微波成像传感器。它有效地解 决了雷达设计中高分辨率要求与大天线、短波长之间的矛 盾,使分辨率提高了数百倍。
合成孔径雷达干涉测量(Interferometric Synthetic Aperture
缺点:已知DEM与InSAR干涉图像的配准存 在很大 困难。
DInSAR技术资料整理

DInSAR全称Differential Interferometric Synthetic Aperture Radar,合成孔径雷达差分干涉测量技术。
➢InSAR技术提取地表DEM,需要假设两次成像期间,地表没有发生变化,地物产生的随机相位也是不变的。
➢而DInSAR则是一种根据多期SAR数据,获取地表形变信息的方法之一。
根据差分干涉所需影像的多少,DInSAR可以分为:二轨法,三轨法和四轨法。
⏹二轨法:利用两景影像,主影像为形变后获取的数据,辅影像为地表形变前获取的数据。
将两者进行干涉处理,生成干涉图,干涉图中包括地形相位和形变相位,然后引入外部DEM数据,将DEM数据模拟成地形相位,从干涉图中减去,即可得到地表的形变相位。
优点:所需SAR数据少缺点:外部引入的DEM包含的误差会影响最终的差分干涉结果流程图:⏹三轨法:利用三景影像,其中两景是形变发生前获取的数据,另一景是形变后获得的,选区形变前后两景影像中的一景为主影像,其余为辅影像,分别和主影像进行配准,这样便生成两组干涉相位,一组是形变前的,只有地形信息;一组是形变后的,包含形变信息和地形信息;然后将形变后干涉相位减去已经解缠的形变前的相位,得到只含有形变信息的干涉相位,最后进行相位解缠,相位转高程和地理编码,获取地表的形变信息。
优点:无需外部DEM数据及其引入的DEM误差;缺点:需要进行相位解缠,解缠结果的好坏直接影响差分的结果;流程图:四轨法:与二轨法类似,但是不需要外部引入的DEM数据,需要四景影像;基本思路是将形变发生前获取的两幅影像进行干涉处理,得到形变前的干涉相位,只包含地形信息;然后将形变后的两景影像进行干涉处理,得到形变后的干涉相位。
从形变后的干涉相位中减去形变前的干涉相位,得到地表的形变相位,然后相位解缠,得到差分干涉图。
流程图:InSAR获取DEM条件:两期影像获取期间地物没有明显的形变,且地物产生的随机相位是相同的;流程图:。
dem在insar中的作用
dem在insar中的作用
DEM(Digital Elevation Model,数字高程模型)在InSAR (Interferometric Synthetic Aperture Radar,合成孔径雷达干涉测量)中起着关键作用。
DEM是地球表面的三维高程模型,用于表示地面的海拔高度。
DEM在InSAR中的作用包括以下几个方面:
1. 坡度计算:基于DEM,可以计算每个点的坡度,从而帮助理解地表形态的变化。
2. 位移测量:使用InSAR进行干涉测量时,需要使用DEM来排除地球曲率对测量结果的影响,从而更精确地计算目标物体的位移。
3. 地形校正:DEM可以用于校正InSAR图像中的不同地形效应,如斜坡、山谷等,以获得更准确的地表变形信息。
4. 反演应力:借助DEM,可以获取地表的三维几何形态,结合InSAR的测量结果,可以反演地壳中的应力分布,进一步研究地壳运动和地震活动。
5. 地理信息系统(GIS)应用:DEM可以与其他空间数据集相结合,用于地理信息系统分析和应用,如地貌分析、水资源管理、土壤侵蚀研究等。
综上所述,DEM在InSAR中发挥了关键作用,为提供精确的地表变形信息和地球表面特征提供了重要数据基础。
多发多收干涉合成孔径雷达高程测量关键技术研究
多发多收干涉合成孔径雷达高程测量关键技术研究多发多收干涉合成孔径雷达高程测量关键技术研究摘要:合成孔径雷达(Synthetic Aperture Radar, SAR)是一种通过合成大尺寸的孔径实现高分辨率成像的雷达系统。
随着空间技术的发展和对高精度地面测绘需求的增加,干涉合成孔径雷达(Interferometric Synthetic Aperture Radar, InSAR)成为一种重要的高程测量技术。
本文结合多发多收干涉合成孔径雷达(Multi-Baseline InSAR, MB-InSAR)技术,探讨了干涉测量的原理、关键技术以及在高程测量中的应用。
一、引言合成孔径雷达技术作为一种无依托地面控制点的高程测量方法,在地质灾害监测、数字地形模型生成等领域具有广阔的应用前景。
干涉合成孔径雷达技术,通过多次雷达观测,利用相干性检测原理计算相位差,从而实现高程信息的提取。
本文重点研究多发多收干涉合成孔径雷达技术在高程测量中的关键技术。
二、多发多收干涉合成孔径雷达原理多发多收干涉合成孔径雷达是指通过多颗雷达卫星的多角度观测,利用双差技术消除大气影响,获取高精度的相位差信息。
首先,将两次观测的干涉相位差计算成干涉图像;然后,利用干涉图像进行相位解缠,得到相位差;最后,通过相位差转换为高程信息。
三、多发多收干涉合成孔径雷达关键技术1. 预处理技术:预处理是多发多收干涉合成孔径雷达的关键步骤,包括去除噪声、平滑滤波、相干性检测等。
预处理的质量直接影响后续高程测量的精度和可靠性。
2. 干涉图像配准:干涉图像配准是多发多收干涉合成孔径雷达的核心技术之一。
多源雷达数据的配准对于提高干涉相位差计算的精度至关重要。
3. 相位解缠技术:相位解缠是多发多收干涉合成孔径雷达中的难点之一。
相位解缠技术包括利用全局模型、局部模型以及非正则化方法解决相位闭合问题。
4. 大气校正技术:大气因素是多发多收干涉合成孔径雷达高程测量中的重要误差来源。
基于“天空地”一体化技术的安全监测系统建设与应用
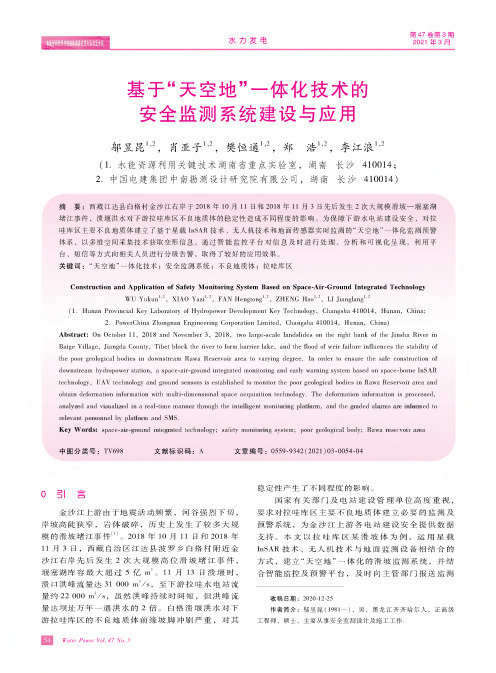
第 47 卷第 3 期2021 年 3 月水力发电基于$天空地%—体化技术的 安全监测系统建设与应用邬昱昆1,2 ,肖亚子1 2 ,樊恒通1 2 ,郑 浩1 '2 ,李江浪1 2(1.水能资源利用关键技术湖南省重点实验室,湖南长沙410014 ;2.中国电建集团中南勘测设计研究院有限公司,湖南长沙410014)摘 要:西藏江达县白格村金沙江右岸于2018年10月11日和2018年11月3日先后发生2次大规模滑坡一堰塞湖堵江事件,溃堰洪水对下游拉哇库区不良地质体的稳定性造成不同程度的影响#为保障下游水电站建设安全,对拉 哇库区主要不良地质体建立了基于星载InSAR 技术、无人机技术和地面传感器实时监测的“天空地”一体化监测预警体系,以多维空间采集技术获取变形信息,通过智能监控平台对信息及时进行处理、分析和可视化呈现,利用平台、短信等方式向相关人员进行分级告警,取得了较好的应用效果# 关键词:“天空地”一体化技术;安全监测系统;不良地质体;拉哇库区Construction and Application of Safety Monitoring System Based on Spacc-Air-Ground Integrated TechnologyWU Yukun 1'2, XIAO Yazi 1'2, FAN Hengtong 1'2, ZHENG Hao 1'2, LI Jianglang 1'2(1.Hunan Provincial Key Laboratoro of Hydropower Development Key Technoloay, Changsha 410014, Hunan, China;2. PowerChina Zhongnan Engineering Corporation Limited, Changsha 410014, Hunan, China)Abstract : On October 11 / 2018 and Novembee 3 / 2018, teo larae-sca1e landslides on the right bank of the Jinsha River inBaige Villaae, Jiangda County, Tibet block the rivee to form barrier lake, and the food of weir failure infuences the stabilita of the poor geeloaical bodies in d ownstream Raws Reserveir area to varying decree. In order to ensure the sate ccnstruction ofdownstream hydropower station, a space-aircround integrated monitoring and early warning system based on space-borne InSARtechnolocy, UAV technolocy and ground sensorr is established to monitor the poor geeloaicat bodies in Raws Reserveir area andobtain deformation information with multi-dimensional space acquisition technolocy. The deformation information is processed, analyeed and eiualieed in aoeal-timemanneothoou/h theinte l i/entmonitooin/plateoom,and the/oaded alaomGaoeineoomed tooeleeantpeoGonnelbyplatooom and SMS.Key Wordt Gpace-aio-/oound inte/oated technolo/y; Ga oety monito oin/ GyGtem; poo o/eolo/ical body; Rawa oeGe oeoi oa oea中图分类号:TV698文献标识码:A文章编号:0559-9342 (2021) 03-0054-040引言金沙江上游由于地震活动频繁,河谷强烈下切, 岸坡高陡狭窄,岩体破碎,历史上发生了较多大规 模的滑坡堵江事件⑴# 2018年10月11日和2018年 11月3日,西藏自治区江达县波罗乡白格村附近金沙江右岸先后发生2次大规模高位滑坡堵江事件, 堰塞湖库容最大超过5亿m 3 # 11月13日溃堰时, 溃口洪峰流量达31 000 m 3/s ,至下游拉哇水电站流 量约22 000 m 3/s ,虽然洪峰持续时间短,但洪峰流量达坝址万年一遇洪水的2倍。
基于卫星实景三维和InSAR技术的地质灾

基于卫星实景三维和InSAR技术的地质灾害隐患识别监测文|涂宽 郑健 马卫胜 文强二十一世纪空间技术应用股份有限公司摘要:我国地质灾害频发,地质灾害隐患识别对提高地质灾害防治业务能力、保护人民的生命财产安全具有重要意义。
光学卫星遥感图像可判读性强、信息量丰富,被广泛运用在地质灾害隐患早期识别工作中。
甚高—高分辨率卫星立体三维产品能为地质灾害易发区的三维重建提供数据基础,实现从二维图像到三维数据体的提升,大大提高卫星遥感地质灾害隐患识别和监测能力。
本文结合北京系列卫星甚高—高分辨率卫星实景三维产品和星载合成孔径雷达差分干涉测量技术(InSAR),论述综合遥感技术在地质灾害调查和监测中的应用,通过开展地质灾害隐患早期识别,为地方地质灾害防治及突发地质灾害应急响应工作提供参考。
一、前言地质灾害是由于地质运动或人类工程活动,引发危害人类生命财产安全、破坏自然资源环境的现象或过程。
常见的地质灾害包括滑坡、崩塌、泥石流、塌陷、地裂缝等。
中国幅员辽阔,地形地貌和地质构造复杂,崩塌、滑坡、泥石流等地质灾害具有高隐蔽性、强突发性的特点。
开展地质灾害隐患的早期识别工作,对地质灾害监测预警、灾害风险区把控、防灾减灾工作有着重要的指导意义。
2020年我国开展了首轮“国家级”大规模地灾隐患综合遥感识别工作,经过充分论证与应用实践,确立了综合应用空天地多源遥感观测技术,以“形态、形变、形势”为识别内容的重大隐蔽性地灾隐患早期识别技术思路,形成了包括专题信息提取、隐患特征识别、野外核查验证的业务流程,丰富了地灾调查评价业务工作方式[1]。
高分辨率光学遥感影像具有要素清晰、形象直观等特点,广泛应用于地质灾害隐患识别领域。
基于多源多时相的甚高—高分辨率光学遥感影像,动态监测分析地面目标的光谱、纹理等信息差异,识别地质灾害隐患。
合成孔径雷达干涉测量技术(interferometric synthetic aperture radar, InSAR)[3]利用合成孔径雷达卫星(synthetic aperture radar, SAR)在同一地区获取重复轨道上两景或多景影像进行干涉处理获取地表形变信息。
- 1、下载文档前请自行甄别文档内容的完整性,平台不提供额外的编辑、内容补充、找答案等附加服务。
- 2、"仅部分预览"的文档,不可在线预览部分如存在完整性等问题,可反馈申请退款(可完整预览的文档不适用该条件!)。
- 3、如文档侵犯您的权益,请联系客服反馈,我们会尽快为您处理(人工客服工作时间:9:00-18:30)。
INTERFEROMETRIC SAR DEM CONSTRUCTION FOR LANDSCAPE PROCESSANALYSES IN NORTH-EASTERN ICELANDArto Vuorela(1) and Jukka Käyhkö(2)(1)Novosat LtdOpastinsilta 12 B, 00520 Helsinki, FinlandEmail: arto.vuorela@(2) Department of GeographyUniversity of Turku, 20014 Turku, FinlandEmail: jukka.kayhko@utu.fiINTRODUCTIONThis project concerns the origin and dynamics of the severe land degradation in north-eastern Iceland. The entire project (no. 187) within the ERS-AO3 scheme is titled “Environmental history of the severely eroded north-eastern Icelandic semi-desert – a multi-disciplinary approach utilising remotely sensed data combined with detailed investigations on palaeoecological, sedimentological and cultural aspects“. The sub-project described here aims at modelling the flood routes based on in-house produced InSAR digital elevation model (DEM). The modelling procedure can be divided into three main phases:•Producing a high-accuracy DEM based on SAR interferometry•Mapping the potential catastrophic flood routes using the DEM and a hydrological flow model in GIS environment.•Mapping the lava types, sediment cover on the lava fields, ancient flood routes and, specifically with the aid of ERS-SAR data, quantifying and correcting the effects of moisture and shadow responses in the opticaldata interpretation.This report describes the rationale of the project, the DEM production environment of Novosat and the DEM construction phase of this project. It points out some general limitations and problems of InSAR and aims at assessing potential methods and strategies for resolving them and to improve the accuracy.STUDY AREAThe study area is located in northern Iceland (Fig. 1). The region is characterised by severe erosion processes, volcanic activity, glaciofluvial processes and aridity due to the Vatnajökull rain-shadow. Most of the area is completely devoid of vegetation, whereas shrub heaths occupy the northern fringes along the coast. The area serves as a type example of an enigmatic region, where it is difficult to assess to what extent ecosystem changes or processes take place naturally, or as consequence of human interference.Catastrophic floods (jökulhlaups)Volcanic phenomena are common along the Northern Rift Zone of Iceland. Vigorous volcanic activity occurs beneath the Vatnajökull ice cap to the south of the study area [1] producing recurrently widespread tephra layers as well as catastrophic floods (jökulhlaup Icel.) [2]. Two major volcanic centres lie beneath the ice: the Barðarbunga and the Grimsvötn volcanic centre, both of which exhibit large subglacial caldera depressions. The Grimsvötn volcanic centre is the more active of the two with an eruption frequency close to one eruption per decade. The eruption in September-Data provided by ESA. Financial support provided by Jenny and Antti Wihuri Foundation and the British Council.November 1996 resulted in a catastrophic flood of nearly 4 km3 of meltwater, which covered the uninhabited Skeiðarársandur region in the south (c.f. Fig. 1). The flood caused substantial material damage by destroying roads and bridges with an estimated cost of 10-15 million USD [3].Had the October 1996 eruption taken place slightly further north, water would have resulted in jökulhlaup on the northern margin of the Vatnajökull [3]. The fact that traces of the meltwater from the 1996 eruption were detected in the northern rivers illustrates how close meltwater was to draining in a northerly direction. It is widely acknowledged that the Vatnajökull area is entering a period of renewed volcanic activity [3]. It is therefore probable that future eruptions will drain northwards posing a considerable hazard to communities. Based on preliminary investigations, it is hypothesised [4] that ancient catastrophic floods may have triggered some of the present day environmental (erosion) processes in the study area.Landscape evolutionIn addition to interferometry, ERS-SAR data allow determining the aerodynamic roughness of lava surfaces, which is an important parameter in studies of sand transport. Smooth pahoehoe lavas act as significant pathways for aeolian transport, whereas rough aa lavas appear sediment sinks, and barriers for the advancing sand. There are no previous maps of lava surface roughness in Iceland (or elsewhere) and the research group is in the process of developing new techniques in this field. An attempt will be made to divide lava flows into relative age classes by using remote sensing data. In addition, the techniques applied here will allow estimates of the impact of lava flows on drainage systems and vegetation. Thorough mapping of the surface roughness will also allow more accurate sand transport prediction, being of great aid in land reclamation.The DEM will be used in estimates of eruption volumes. The calculations will be refined with morphological measurements in the field (thickness and width of lava flows). The research group is aware of the many complications in the calculation of volcanic eruption volumes [5], [6]. Therefore, many of our results on the eruptive volumes will be given as order-of-magnitude estimates rather than in absolute figures. These estimates will then be used in assessing environmental stresses and landscape evolution. The digital elevation model will also be used in tracking current and ancient routes of jökulhlaups. The elevation model can also be used in prediction of likely routes of future lava flows and jökulhlaups and is therefore useful in hazard assessment. Finally, the data on the relative and absolute age lava flow fields, volume calculations of eruptions and mapping of the extent of flow fields allow us to construct a general model on the landscape evolution of the area.Fig. 1. Map of Iceland showing the active volcanic zone, the largest ice caps and the borders of the four ERS tandem pairs applied so far in the DEM construction.MATERIAL AND METHODSERS-SAR dataFour ERS-1/2 tandem SLC image pairs were employed in the DEM construction. In the first phase, images with snow cover on the ground (October-February) were ordered (Table 1). Later, a set of snow-free images was ordered, as the coherence of the latter proved to be better. See Discussion for further details on the problems of the material selection. Topographic maps on scales 1:50 000 and 1:100 000 were employed in the combining of the individual models. The 1:50 000 map set did not cover the whole study area. Furthermore, the projection and datum of the 1:100 000 maps were inconsistent with the other data, and were used mainly for elevation assessment.Table 1. The ERS tandem pairs processed. The highlighted images showed poor coherence and were discarded after pre-processing (see text for details)SAT ORBIT FRAME SHIFT ACQ.DATEE124045225909960219E204372225909960220EI240452295-2960219E2043722295-2960220E1275441305-2961020E2078711305-2961021E1275441323-2961020E2078711323-2961021E1217692277-1950913E2020962277-1950914E1217692295-1950913E2020962295-1950914MethodsThe interferometric processing was carried out by Novosat Ltd, Helsinki, Finland. The software employed in the process is an in-house product, implemented by Dr. Einar-Arne Herland at the Remote Sensing Group of the Technical Research Centre (VTT) of Finland [7]. The modus operandi is based on the long-term research on SAR data and techniques at VTT, and the method was implemented in collaboration with Novosat. Currently, the software is in operational use for commercial projects, and Novosat is marketing large-area DEM’s based on ERS SLCI data. Comparison procedures against a 25 m raster DEM extracted from a 1:20 000 topographic map (National Land Survey of Finland) have revealed that the InSAR elevation models show typically a vertical accuracy of 5–15 m [8]. In South Finland, a 4 metre RMSE has been accomplished previously.The software offers highly automated pre-processing of the data. Correlation, slave interpolation, fringe and coherence calculation, fringe filtering, breakpoint and contour generation are carried out automatically. For phase unwrapping, fully automated - but also less reliable - methods were not employed. Instead, unwrapped phase is manually integrated over the total interferogram area, based on branch and cut methods (Fig. 2). Various tools help in this task; e.g. the coherence image is used as a threshold mask and can be viewed in parallel during the work. In addition, the slant and map rectification and advanced joining of the independent models are conducted. The interface has been designed as user-friendly, and the icon-based alternatives offer in-built state-of-the-art InSAR techniques. Due to general limitations of SAR interferometry, Novosat has lately also adapted radargrammetry processes as a complementary alternative for DEM production.Fig. 2. A colour image, showing the unwrapping of a relatively good-coherence interferogram. Lakes, wetlands and the instrument side of the hills show low coherence. The coherence image can be used as an aid to conduct the unwrapping. The fringe disconnections and the extra fringes on the instrument side of hill can be interpreted and drawn with the blue mask area, remaining wrapped. These hollows can be interpolated later. The yellow mask is the so far unwrapped area. Coherence images can be also used in weighting the DEM mosaicking as well as in thresholding the blue mask for the unwrapping.Interferometric coherence images are orthorectified and hence, can be used for land cover analyses in combination with optical satellite images. A relative presentation of the DEM reliability can be yielded with the aid of a variance image from the joined models.RESULTSAfter the data selection and the subsequent careful analysis of the available data, a relatively satisfactory elevation model was produced using two winter image pairs and two snow-free pairs (Fig. 3). The final model shows spatially variable variance and some holes on the western edge (c.f. Fig. 3), in location where there were lines missing in the original data. The image pair margins are visible in some parts of the mosaic (see Discussion and Fig. 5), indicating that the match between the individual models is not perfect. Based on mere GCP measurements, an individual model may still tilt about 1:1000, causing a threshold of a few tens of metres. Further adjustments are being carried out to flatten out these thresholds at the individual model margins, by adjusting the tilt of whole individual models. Fig. 4 shows a potential application of the DEM for interpretation of land cover types in combination with a TM image.Fig. 3. The DEM mosaic of the study region at its current state. The bright area in the south is the Vatnajökull ice cap, which contains elevations well over 1000 metres. At the glacier margin, wet snow and sediment plus melt water streams give rise to poor coherence and hollows in the model. Lake basins such as Askja caldera (the semicircular spot in the middle of the lower half of the figure, surrounded by highlands) appear also as discontinuities. The Upper Pleistocene mountain arc to the right fringes the Volcanic rift zone and acts as a dam to the potential flood water bursting from the south (see also Fig. 4).Fig. 4. A perspective view towards the northwest with Landsat TM image (432 RGB) draped over the InSAR DEM. Red colour denotes vegetated surface. Askja caldera with snowy rims is visible on the left. The ash (tephra) layer (in pale blue) originated in the 1875 eruption at Askja. Subsequent floods have disintegrated the tephra deposit in the east.A black lava flow from the 1961 eruption sits on the northern rim of Askja. In the middle of the scene rises a table mountain Herðubreið (1682 m). Perspective images with shading are particularly sensitive in revealing any artefacts in the DEM. With the given illumination angle, the threshold between the two individual models appears as a dark linear band crossing the view from east to west (see text for further details).DISCUSSIONImage pair selectionSeason and weather effectsCareful InSAR image selection turned out to be a crucial step in the DEM production. Based on earlier experience from northern Fennoscandia (Lapland) [8], it was assumed that the seasonal snow cover would have a stabilising effect on e.g. the vegetated areas and hence, data from wintertime would show good coherence. Therefore, baseline values and weather conditions during the wintertime ERS-1/2 tandem flights were assessed at first instance, and successive acquisition dates showing as little change as possible in the temperature and wind conditions were selected. A request was also made to ESA to obtain an access to the Interferometric Quick Looks (IQL's) [9] in order to help assessing the data quality before placing the order. There were, however, no IQL’s available for our candidate pairs. Only after the scenes had been received and processed, an offer was made to the authors about testing the IQL system with data stored at the UK-PAF. IQL processing is subject to start there in January 2001.The quality of the wintertime images proved unsatisfactory and subsequently, severe problems were encountered with the interferometric coherence. Together with some pitfalls in the project funding, these caused delay in the analyses. The first part of the project was carried out in 1998–1999 with four SAR SLCI image pairs requested and received. Only two of the pairs qualified for further processing. The two other image pairs demonstrated too low coherence and were consequently not used (c.f. Table 1). Low coherence is believed to be due to the highly variable weather and snow conditions in the area. The absolute elevation rises from sea level to well over 1000 m in the south, creating a steep spatial gradient in both temperature and humidity. At high altitude, snow may be dry, whereas in the warmer coastal region the water content of the snow may be distinctively higher. High cyclone activity in North Atlantic induces variable climatic conditions in Iceland during winter and therefore, it is practically impossible to find suitable tandem acquisitions with stable weather conditions. Unfortunately, the image pair, which showed the best coherence for winter images, had some bad (missing) lines, resulting to a section of poor coherence in the final DEM (this problem was, however, recognised before placing the order, but could not be avoided due to the initial wintertime constraint). In the year 2000, two snow-free pairs (acquired in September) were ordered and processed, and the models were finally combined.Based on the advice from ESA [10] and the experience described above, late summer images seem to offer a better option for InSAR in Iceland. This is controversial with the situation in Fennoscandia, where winter images typically show better coherence. It is hypothesised here that one should avoid highly variable weather conditions (e.g. Oceanic subarctic and subantarctic areas during the hemispheric winter) and instead try to find the most stable season for data acquisition. It is obvious that arid areas devoid of vegetation show a good coherence on snow-free pairs, but these images showed a good coherence also for the Icelandic shrubs. Holes in the models cannot be thoroughly avoided as with the global ERS tandem data, the coherence is only rarely good enough throughout the whole scene area for the production of a reliable elevation model. Some of the gaps are so large that interpolation is not feasible.Number of image pairs employedAnother option for improving the quality of the final DEM may be an employment of a large number of image pairs from the same area. In order to identify and eliminate any atmospheric artefacts, it is recommended to use three to four overlapping pairs from both ascending and descending tracks, as this gives better results than using only one or two pairs.Ground control points and mosaickingThe horizontal accuracy of the ERS-SAR data is initially about 100 m throughout the world when using the PRC orbit products. Therefore, in principle, a single elevation point will suffice the georeferencing, without a need for additional GCP's. However, by incorporating GCP’s from maps and other databases, the horizontal accuracy can be improved to 20-30 metres (although identifying and measuring representative points on a DEM can prove difficult). Atmospheric artefacts may cause difficulties, as a GCP measured at an artefact may result to a tilt in the model. Hydrological models are most demanding applications and therefore, additional relative points can be measured to smoothen the edges as much as possible. In Fig. 5, the image threshold effect is no more systematic and is therefore presumably due to atmospheric artefacts and varying coherence within an image, rather than a true mismatch in model rectification. Designing a procedure where the GCP’s could be measured directly on the initial images might prove beneficial.Fig. 5. An example of the effect of atmospheric artefacts at a model border. The threshold between models runs diagonally across the scene from upper left to lower right, indicating an elevation difference of up to several tens of metres. Any systematic incompatibility has already been removed from the mosaic by adjusting the tilt of the models. Thus, the remaining (non-systematic) mismatch is presumably due to atmospheric artefacts and varying coherence rather than a rectification error.InSAR-based elevation models have a good cost/benefit ratio compared to traditional photogrammetric methods, but one has to acknowledge the fact that the application cannot be employed readily in all regions. In addition to the land cover types known to suffer from limited C-band coherence (e.g. rain forests) and atmospheric artefacts (e.g. deserts), also areas in the Subarctic with steep climatic gradients and variable weather conditions may bring about difficulties in DEM construction.The next step in the project at hand is fine-tuning the DEM by adding more GCP's and using more image pairs. Thereafter, the DEM will be employed in the modelling of catastrophic flood routes with the aid of GIS techniques. Of specific interest with regard to the modelling exercise will be the high momentum, variable viscosity (due to high sediment load) and the point-source (either single or multi) character of the floodwater bursting from the ice sheet margin. Therefore, a normal hydrological modelling, such as described in e.g. [11] will most probably prove insufficient.CONCLUSIONSBased on the case study reported here, the following conclusions can be drawn with regard to the interferometric DEM construction:1.In the current study region, snow-free image pairs show better coherence than winter pairs, and are thereforesuggested for DEM construction even in moderately vegetated areas. In Boreal forest region, however, the coherence is generally better during the snow period.2.Areas with steep climatic gradients and highly variable weather conditions (e.g. melting/re-freezing snow) degradethe image coherence and prove to result in problems in the analyses of the data acquired in ERS tandem flights. 3.The use of only two overlapping image pairs and a limited number and distribution of GCP's failed to produce atotally threshold-free DEM mosaic. Increasing the number of overlapping pairs from 1-2 to 3-4 will improve the total DEM quality. Adjacent models can also be fit to one another, or to a reference DEM, where available.4.An access to the IQL’s prior to placing a data order would be of great benefit as otherwise, the only way to assessthe applicability of a pair is to purchase and pre-process it. If the IQL’s are not available, it is advisable to order justa single image pair from a particular track at first hand, to allow preliminary investigation of the coherence. Theavailability of IQL's will improve in the near future, as the data from Northern Europe will be processed from January 2001 onwards at UK-PAF.ACKNOWLEDGEMENTSThis study would not have been possible without the close collaboration of the whole research team: P. Alho (Turku), O. Arnalds (Reykjavík), J. Hendriks (Turku), M. Rossi (Turku), A. Russell (Keele), H. Seppä (Uppsala) and G. Wiggs (Sheffield). The authors thank T. Ikola (Novosat) for fruitful comments on the manuscript and E. Forsvik (Novosat) for invaluable assistance in image processing.REFERENCES[1] G. Larsen, M.T.Gudmundsson, and H Björnsson, "Eight centuries of periodic volcanism at the center of the Iceland hotspot revealed by glacier tephrostratigraphy, " Geology, 26, pp. 943-946, 1998.[2] H. Björnsson, "Jökulhlaups in Iceland: prediction, characteristics and simulation, " Ann. Glaciol., 16, 95-106, 1992.[3] M.T Guðmundsson, F. Sigmundsson, and H. Björnsson, "Ice-volcano interaction of the 1996 Gjálp subglacial eruption, Vatnajökull, Iceland, " Nature, 389, pp. 954-957, 1997.[4] J.Käyhkö and P. Worsley, "Sediment distribution and transport processes on Holocene lava fields in north-eastern Iceland, " Supplementi di Geografia Fisica e Dinamica Quaternaria, Supplemento III, Tomo 1, p. 226 (Abstracts of the Fourth International Conference on Geomorphology, Bologna, Italia, 28.08.-03.09.1997).[5] M.J. Rossi, "Morphology and mechanism of eruption of postglacial shield volcanoes in Iceland. " Bulletin of Volcanology, 57, pp. 530-540, 1996.[6] M.J. Rossi, "Morphology of the 1984 open-channel lava flow at Krafla volcano, northern Iceland", Geomorphology, 20, pp. 95-112, 1997.[7] E.-A. Herland and A. Vuorela, "Operational DEM generation by means of SAR interferometry", IGARSS’97 Proceedings, Singapore, 03-08 August, IEEE1997, Volume III pp. 1344–1346, 1997[8] A. Vuorela, E.-A. Herland, and A. Saarikoski, "SarDEM – Production Process and Applicability of SarDEM Digital Elevation Models Based on Interferometric ERS SAR Images", Report, National Land Survey of Finland 1998. 50 p.[9] "INSI SAR Interferometry Sample Image Browser", (ERS-1 and ERS-2 Tandem Interferometric Quick-Looks), http://earth.esa.int/insi, ESA, 2000[10] D. Massonnet, CNES, pers. communication, 20 January 1999[11] A. Walker, Using the LANDMAP British Isles 1" IfSAR DEM for Hyrdographical Network Derivation. ERS -ENVISAT SYMPOSIUM, 16 - 20 October, 2000。