statistical software vocabulary
十中常用统计数据分析软件

常用的十款统计数据分析软件——中国数据分析培训网一、SAS统计软件SAS 是英文Statistical Analysis System的缩写,翻译成汉语是统计分析系统,最初由美国北卡罗来纳州立大学两名研究生开始研制,1976 年创立SAS公司, 2003年全球员工总数近万人,统计软件采用按年租用制,年租金收入近12亿美元。
SAS系统具有十分完备的数据访问、数据管理、数据分析功能。
在国际上, SAS被誉为数据统计分析的标准软件。
SAS系统是一个模块组合式结构的软件系统,共有三十多个功能模块。
SAS是用汇编语言编写而成的,通常使用SAS 需要编写程序, 比较适合统计专业人员使,而对于非统计专业人员学习SAS比较困难。
二、SPSS统计软件SPSS是英文Statistical package for the social science 的缩写,翻译成汉语是社会学统计程序包,20世纪60年代末由美国斯坦福大学的三位研究生研制,1975年在芝加哥组建SPSS总部。
SPSS系统特点是操作比较方便,统计方法比较齐全,绘制图形、表格较有方便,输出结果比较直观。
SPSS是用FORTRAN语言编写而成。
适合进行从事社会学调查中的数据分析处理。
三、BMDP统计软件BMDP是英文Biomedical computer programs 的缩写,翻译成汉语是生物医学计算程序,美国加州大学于1961年研制,是世界上最早的统计分析软件。
特点是统计方法齐全,功能强大。
但1991年的7.0版后没有新的版本推出,使用不太普及,最后被SPSS 公司收购。
四、Stata统计软件Stata统计软件由美国计算机资源中心(Computer Resource Center)1985年研制。
特点是采用命令操作,程序容量较小,统计分析方法较齐全,计算结果的输出形式简洁,绘出的图形精美。
不足之处是数据的兼容性差,占内存空间较大,数据管理功能需要加强。
学生籍贯信息记录簿系统课程设计报告

C语言课程设计学生籍贯信息记录簿系统院(系)别班级学号姓名指导教师时间2010-6-12—2008-6-24课程设计任务书题目学生籍贯信息记录簿考试系统系(部)专业班级学生姓名学号6 月12 日至 6 月24 日共 2 周指导教师(签字)系主任(签字)年月日成绩评定表摘要这次程序设计,我选择的是设计学生籍贯信息记录簿系统的程序,之所以选择要设计这个程序首先因为我自己认为这个程序非常实用,虽然说老师给我们的每一个程序都很实用,但是在平时籍贯信息比较常用。
其次,通过向信息的同学了解,建立这个程序有一个方法就是利用链表,而我们的C语言课还没有学到这一步呢,我自己觉得挺有挑战性的,就打算在同学的帮助下编写这个程序了。
其实,刚拿到这个题目,真的没有什么头绪,但是在同学的帮助下,通过自己看课本,通过上网查资料,通过向老师询问,根据自己制定的进程安排,我还是完成了任务。
通过为期一周的课程设计,我对编程有了更加深刻的认识,也让我学到了一些关于用指针处理链表的知识,增强了自己的动手操作能力。
这一周的课程设计,让我对以前学过的知识有了一个更好的巩固,同时也增加了我的新的知识,使我受益匪浅,也让我对Visual C++ 6.0有了进一步的了解,而且,在编程过程中我也学到了许多的东西,也让我明白了一个道理:不管做什么事情,态度是最重要的。
关键字:学生籍贯信息记录簿,链表,指针AbstractTo increase the capacity of practices we have created more going to be able to operate the knowledge learned, the school has arranged for two weeks, especially our Visual C + + to carry out a practical design courses Masu.Detailed description of this file under Visual C + +6.0 environment, the process of designing a single software, this software is that the number of different data statistics.This software features, users enter a single-stage character, the software records the number of letters in each kind of data, the number of data in English, the number of numeric data, empty data include the number of the number and types of data that shows clear them.The following courses through the design and description, data description and statistical software to adjust the program description, and to develop overall direction, describes the process of making the program more, action , can perform various operations.Keyword:Multiple Choice,Head Files,VC++6.0目录前言 (1)第1章软件设计内容 (2)1.1软件达到的目的 (2)1.2软件功能说明 (2)1.2.1功能分析说明图 (2)1.2.2各项功能说明 (3)第2章软件设计环境与原理 (12)2.1设计环境与模块的划分 (12)2.1.1软件设计环境 (12)2.1.2软件模块的划分 (12)2.2软件设计主要原理 (13)2.2.1采用的主要数据结构类型 (13)第3章软件的设计过程 (14)3.1各软件模块之间的调用方式 (14)3.3数据保存方式以及格式 (14)第4章运行程序并截图以及对应的编程 (14)第5章总结 ................................................................... 错误!未定义书签。
CHISS统计软件介绍
CHISS的功能和结构 三、 CHISS的功能和结构
CHISS采用模块组合式结构,目前已 开发了如下十个模块: 数据管理模块 统计分析模块 图形制作模块 试验设计模块 结果编辑模块 科学评价模块 数学模型模块 多元分析模块 重复测量模块 电子教室模块
四、CHISS主要特点 CHISS主要特点
1. 友好的视窗界面
在国内,目前医学统计学统计教学和统计 分析,大部分采用国外的软件(占98%)。 但是,一方面,由于这些软件的价格非常 昂贵。另一方面,这些现有的软件功能有 很多不完善之处,操作不太方便。另外, 英文界面和说明让不少学生难以了解其功 能。
统计软件现况调查
2003年对中国人民解放军总医院 2003年对中国人民解放军总医院 医学博士进行问卷调查, 医学博士进行问卷调查,参加学员 135名,调查统计软件使用情况。 名 调查统计软件使用情况。
时间 1994年-1998年 1999年-2002年 2003年- 统计工具 计算机软件SAS 计算机软件Stata 计算机软件CHISS
讲课教授: 童新元
301医院博士研究生现代统计学方 法课教学工具情况
时间 1995年-1998年 1999年-2002年 2003年-
统计工具 计算机软件SAS 计算机软件Stata 计算机软件CHISS
医学博士愿意使用的统计软件种类
乱用统计软件的问题
一方面,很多人不管统计方法的前提条 件是否満足,将数据直接代入计算机软 件中,得出的结果与实际相差堪远。 另一方面,现有的一些外国统计软件使 用不太方便,造成用户的误用。
中国统计教育的现况
1 不少学校仍用手工或计算器进行应用统 计教学; 2 统计教学大量使用英文软件,但在中国 学生需要有中文统计软件进行辅助教学;
六西格玛术语中英文对照
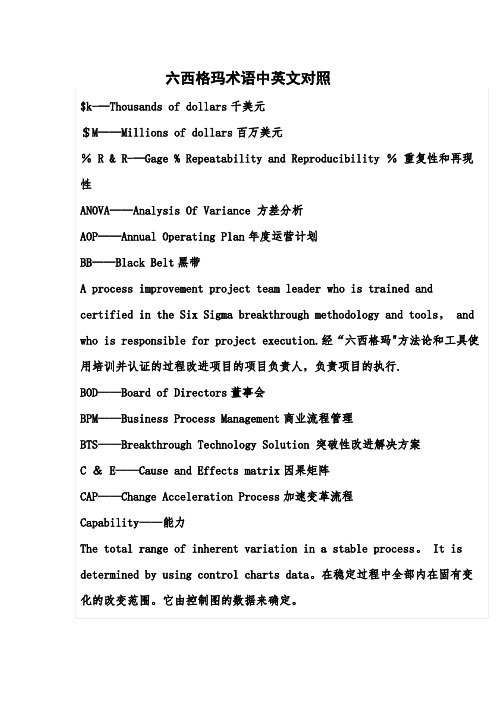
六西格玛术语中英文对照$k-—Thousands of dollars千美元$M——Millions of dollars百万美元% R & R-—Gage % Repeatability and Reproducibility %重复性和再现性ANOVA——Analysis Of Variance 方差分析AOP——Annual Operating Plan年度运营计划BB——Black Belt黑带A process improvement project team leader who is trained and certified in the Six Sigma breakthrough methodology and tools, and who is responsible for project execution.经“六西格玛"方法论和工具使用培训并认证的过程改进项目的项目负责人,负责项目的执行. BOD——Board of Directors董事会BPM——Business Process Management商业流程管理BTS——Breakthrough Technology Solution 突破性改进解决方案C & E——Cause and Effects matrix因果矩阵CAP——Change Acceleration Process加速变革流程Capability——能力The total range of inherent variation in a stable process。
It is determined by using control charts data。
在稳定过程中全部内在固有变化的改变范围。
它由控制图的数据来确定。
CapabilityIndex—-能力指数A calculated value used to compare process variation to a specification。
与自闭症相关英文缩写简介
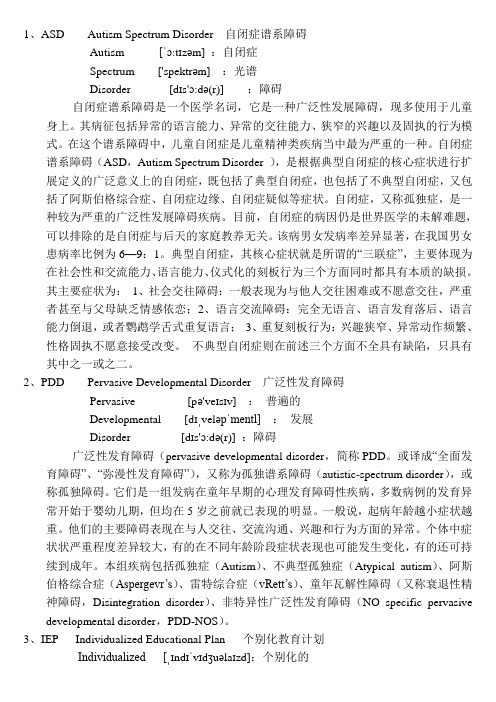
1、ASD Autism Spectrum Disorder 自闭症谱系障碍Autism [ˈɔ:tɪzəm] :自闭症Spectrum ['spektrəm] :光谱Disorder [dɪs'ɔ:də(r)] :障碍自闭症谱系障碍是一个医学名词,它是一种广泛性发展障碍,现多使用于儿童身上。
其病征包括异常的语言能力、异常的交往能力、狭窄的兴趣以及固执的行为模式。
在这个谱系障碍中,儿童自闭症是儿童精神类疾病当中最为严重的一种。
自闭症谱系障碍(ASD,Autism Spectrum Disorder ),是根据典型自闭症的核心症状进行扩展定义的广泛意义上的自闭症,既包括了典型自闭症,也包括了不典型自闭症,又包括了阿斯伯格综合症、自闭症边缘、自闭症疑似等症状。
自闭症,又称孤独症,是一种较为严重的广泛性发展障碍疾病。
目前,自闭症的病因仍是世界医学的未解难题,可以排除的是自闭症与后天的家庭教养无关。
该病男女发病率差异显著,在我国男女患病率比例为6—9:1。
典型自闭症,其核心症状就是所谓的“三联症”,主要体现为在社会性和交流能力、语言能力、仪式化的刻板行为三个方面同时都具有本质的缺损。
其主要症状为:1、社会交往障碍:一般表现为与他人交往困难或不愿意交往,严重者甚至与父母缺乏情感依恋;2、语言交流障碍:完全无语言、语言发育落后、语言能力倒退,或者鹦鹉学舌式重复语言;3、重复刻板行为:兴趣狭窄、异常动作频繁、性格固执不愿意接受改变。
不典型自闭症则在前述三个方面不全具有缺陷,只具有其中之一或之二。
2、PDD Pervasive Developmental Disorder 广泛性发育障碍Pervasive [pə'veɪsɪv] :普遍的Developmental [dɪˌveləpˈmentl] :发展Disorder [dɪs'ɔ:də(r)] :障碍广泛性发育障碍(pervasive developmental disorder,简称PDD。
Stata软件应用1---【Stata软件基本操作】

二、Stata常用基本操作
方式 2:直接将结果存入Word或Excel等文本编辑软件 中,即在Stata结果窗口中选择上述计算结果→ 鼠标右 键→Copy Table →打开Excel窗口粘帖,结果按表格方式 呈现。 计算相关系数(基本命令:corr) 键入 corr rjgdp rjcap 回车→显示两个变量的相关系数 矩阵 →依据前述两种方式保存运行结果; 进行简单回归分析(基本命令:reg) 键入 reg rjgdp rjcap 回车(第一个变量rjgdp为被解释变 量,第二个变量rjcap为解释变量) →显示回归结果→依 据前述两种方式保存运行结果;
二、Stata常用基本操作 Stata数据管理 在对数据进行分析时,经常会遇到这些事情:合并两个文 件;删除某个变量;重新生成一个新变量;计算某个变量的 函数值等。这些事情的处理就是数据管理。这里介绍一些常 用的数据管理命令,其他的可参考Stata帮助文件或User’s Guide。常用的数据管理命令包括以下几类:
二、Stata 常用基本操作
启动 Stata
下载Stata10压缩包,解压后,在Stata10文件夹中,找 到wsestata图标,鼠标双击它即会出现Stata的界面。今 后大部分工作都将在这个界面上完成。
Stata 窗口简介
Stata窗口主要由以下几部分构成: 1、Command(命令,右下部分)窗口:用于向Stata键入 需要执行的命令,回车后即开始执行,相应的结果则会 在结果窗口中显示出来。 2、Stata results(结果,右上部分)窗口:显示运行结 果、所执行的命令以及出错信息等。窗口中会使用不同 的颜色区分不同的文本,如白色表示命令,红色表示错 误信息。
2、数据文件的合并
数理统计 教材 英文

数理统计教材英文IntroductionStatistics is a fundamental branch of mathematics that deals with the collection, analysis, interpretation, presentation, and organization of data. It plays a crucial role in various fields such as science, business, economics, social sciences, and healthcare. In this article, we will explore the importance of statistics in the field of education and discuss the significance of English textbooks for teaching statistics.1. The Role of Statistics in EducationStatistics provides educators and researchers with essential tools to gather data and draw meaningful conclusions. It helps in understanding students' learning patterns and identifying areas of improvement. By analyzing data, educators can adapt their teaching methods to provide a more effective learning experience.2. Importance of English Textbooks in Teaching StatisticsEnglish textbooks in the field of statistics play a significant role in conveying statistical concepts to students. They provide a structured and organized approach to learning statistical theory and methods. Let's delve into some aspects that make English textbooks essential in teaching statistics.2.1 Clarity in ExplanationEnglish textbooks in statistics ensure clear and concise explanations of statistical concepts. They provide step-by-step instructions, examples, and illustrations to help students grasp complex ideas easily. The use of plainlanguage and a logical progression of concepts aid in comprehending statistical theories.2.2 Variety of ExercisesThe inclusion of a wide range of exercises in English textbooks allows students to practice what they have learned. These exercises reinforce the understanding of statistical concepts and help in applying them to real-world scenarios. Engaging exercises promote critical thinking and problem-solving skills among students.2.3 Visual RepresentationEnglish textbooks incorporate visual aids such as graphs, charts, and tables, which facilitate data interpretation. These visual representations enhance students' ability to analyze and draw conclusions from the data. With the support of visuals, complex statistical relationships become more accessible to comprehend.2.4 Real-World ExamplesEnglish textbooks often include real-world examples and case studies to illustrate the application of statistical concepts. These examples contextualize statistical theories, making them more relevant and relatable to students' lives. Real-world examples also foster students' ability to use statistics in practical situations.3. Challenges in Teaching StatisticsThe teaching of statistics can pose certain challenges for both educators and students. Let's discuss a few of these challenges and how English textbooks can address them effectively.3.1 Theory-Practice GapThere is often a gap between theoretical knowledge and its practical application in statistics. English textbooks bridge this gap by providing clear explanations and practical examples that allow students to understand how statistical concepts are used in various settings.3.2 Statistical Software UsageStatistics makes extensive use of software programs for data analysis. English textbooks often introduce and guide students on utilizing statistical software effectively. This equips students with the necessary skills to analyze data sets and draw conclusions using available tools.3.3 Conceptual ClarityStatistics can be challenging for students due to its abstract nature. English textbooks present statistical concepts in a structured and systematic manner, ensuring clarity of ideas. They break down complex concepts into smaller, more manageable components, enabling students to build a solid foundation.ConclusionEnglish textbooks play a crucial role in teaching statistics, providing a comprehensive and structured approach to learning statistical concepts. They enhance students' understanding through clear explanations, variousexercises, visual representation, and real-world examples. By utilizing these textbooks, educators can effectively teach statistics and equip students with valuable analytical skills that are applicable across various disciplines.。
常用电脑专业英语1500词

IP Address DNS URL
Browser
A unique identifier for a device on the internet, consisting of four numbers separated by periods.
Stands for Domain Name System, which translates human-readable domain names into machine-readable IP
IoT
Internet of Things, refers to the interconnection of physical devices with the internet, allowing them to collect and exchange data.
API
Application Programming Interface, a set of rules and protocols that allows software applications to communicate with each other.
01 03
Keyboard and mouse
Input devices for entering data and navigating the computer interface.
- 1、下载文档前请自行甄别文档内容的完整性,平台不提供额外的编辑、内容补充、找答案等附加服务。
- 2、"仅部分预览"的文档,不可在线预览部分如存在完整性等问题,可反馈申请退款(可完整预览的文档不适用该条件!)。
- 3、如文档侵犯您的权益,请联系客服反馈,我们会尽快为您处理(人工客服工作时间:9:00-18:30)。
statistical software vocabularyAbsolute deviation, 绝对离差Absolute number, 绝对数Absolute residuals, 绝对残差Acceleration array, 加速度立体阵Acceleration in an arbitrary direction, 任意方向上的加速度Acceleration normal, 法向加速度Acceleration space dimension, 加速度空间的维数Acceleration tangential, 切向加速度Acceleration vector, 加速度向量Acceptable hypothesis, 可接受假设Accumulation, 累积Accuracy, 准确度Actual frequency, 实际频数Adaptive estimator, 自适应估计量Addition, 相加Addition theorem, 加法定理Additive Noise, 加性噪声Additivity, 可加性Adjusted rate, 调整率Adjusted value, 校正值Admissible error, 容许误差Aggregation, 聚集性Alpha factoring,α因子法Alternative hypothesis, 备择假设Among groups, 组间Amounts, 总量Analysis of correlation, 相关分析Analysis of covariance, 协方差分析Analysis Of Effects, 效应分析Analysis Of Variance, 方差分析Analysis of regression, 回归分析Analysis of time series, 时间序列分析Analysis of variance, 方差分析Angular transformation, 角转换ANOVA (analysis of variance), 方差分析ANOVA Models, 方差分析模型ANOVA table and eta, 分组计算方差分析Arcing, 弧/弧旋Arcsine transformation, 反正弦变换Area 区域图Area under the curve, 曲线面积AREG , 评估从一个时间点到下一个时间点回归相关时的误差ARIMA, 季节和非季节性单变量模型的极大似然估计Arithmetic grid paper, 算术格纸Arithmetic mean, 算术平均数Arrhenius relation, 艾恩尼斯关系Assessing fit, 拟合的评估Associative laws, 结合律Asymmetric distribution, 非对称分布Asymptotic bias, 渐近偏倚Asymptotic efficiency, 渐近效率Asymptotic variance, 渐近方差Attributable risk, 归因危险度Attribute data, 属性资料Attribution, 属性Autocorrelation, 自相关Autocorrelation of residuals, 残差的自相关Average, 平均数Average confidence interval length, 平均置信区间长度Average growth rate, 平均增长率Bar chart, 条形图Bar graph, 条形图Base period, 基期Bayes' theorem , Bayes定理Bell-shaped curve, 钟形曲线Bernoulli distribution, 伯努力分布Best-trim estimator, 最好切尾估计量Bias, 偏性Binary logistic regression, 二元逻辑斯蒂回归Binomial distribution, 二项分布Bisquare, 双平方Bivariate Correlate, 二变量相关Bivariate normal distribution, 双变量正态分布Bivariate normal population, 双变量正态总体Biweight interval, 双权区间Biweight M-estimator, 双权M估计量Block, 区组/配伍组BMDP(Biomedical computer programs), BMDP统计软件包Boxplots, 箱线图/箱尾图Breakdown bound, 崩溃界/崩溃点Canonical correlation, 典型相关Caption, 纵标目Case-control study, 病例对照研究Categorical variable, 分类变量Catenary, 悬链线Cauchy distribution, 柯西分布Cause-and-effect relationship, 因果关系Cell, 单元Censoring, 终检Center of symmetry, 对称中心Centering and scaling, 中心化和定标Central tendency, 集中趋势Central value, 中心值CHAID -χ2 Automatic Interaction Detector, 卡方自动交互检测Chance, 机遇Chance error, 随机误差Chance variable, 随机变量Characteristic equation, 特征方程Characteristic root, 特征根Characteristic vector, 特征向量Chebshev criterion of fit, 拟合的切比雪夫准则Chernoff faces, 切尔诺夫脸谱图Chi-square test, 卡方检验/χ2检验Choleskey decomposition, 乔洛斯基分解Circle chart, 圆图Class interval, 组距Class mid-value, 组中值Class upper limit, 组上限Classified variable, 分类变量Cluster analysis, 聚类分析Cluster sampling, 整群抽样Code, 代码Coded data, 编码数据Coding, 编码Coefficient of contingency, 列联系数Coefficient of determination, 决定系数Coefficient of multiple correlation, 多重相关系数Coefficient of partial correlation, 偏相关系数Coefficient of production-moment correlation, 积差相关系数Coefficient of rank correlation, 等级相关系数Coefficient of regression, 回归系数Coefficient of skewness, 偏度系数Coefficient of variation, 变异系数Cohort study, 队列研究Collinearity, 共线性Column, 列Column effect, 列效应Column factor, 列因素Combination pool, 合并Combinative table, 组合表Common factor, 共性因子Common regression coefficient, 公共回归系数Common value, 共同值Common variance, 公共方差Common variation, 公共变异Communality variance, 共性方差Comparability, 可比性Comparison of bathes, 批比较Comparison value, 比较值Compartment model, 分部模型Compassion, 伸缩Complement of an event, 补事件Complete association, 完全正相关Complete dissociation, 完全不相关Complete statistics, 完备统计量Completely randomized design, 完全随机化设计Composite event, 联合事件Composite events, 复合事件Concavity, 凹性Conditional expectation, 条件期望Conditional likelihood, 条件似然Conditional probability, 条件概率Conditionally linear, 依条件线性Confidence interval, 置信区间Confidence limit, 置信限Confidence lower limit, 置信下限Confidence upper limit, 置信上限Confirmatory Factor Analysis , 验证性因子分析Confirmatory research, 证实性实验研究Confounding factor, 混杂因素Conjoint, 联合分析Consistency, 相合性Consistency check, 一致性检验Consistent asymptotically normal estimate, 相合渐近正态估计Consistent estimate, 相合估计Constrained nonlinear regression, 受约束非线性回归Constraint, 约束Contaminated distribution, 污染分布Contaminated Gausssian, 污染高斯分布Contaminated normal distribution, 污染正态分布Contamination, 污染Contamination model, 污染模型Contingency table, 列联表Contour, 边界线Contribution rate, 贡献率Control, 对照, 质量控制图Controlled experiments, 对照实验Conventional depth, 常规深度Convolution, 卷积Corrected factor, 校正因子Corrected mean, 校正均值Correction coefficient, 校正系数Correctness, 正确性Correlation coefficient, 相关系数Correlation, 相关性Correlation index, 相关指数Correspondence, 对应Counting, 计数Counts, 计数/频数Covariance, 协方差Covariant, 共变Cox Regression, Cox回归Criteria for fitting, 拟合准则Criteria of least squares, 最小二乘准则Critical ratio, 临界比Critical region, 拒绝域Critical value, 临界值Cross-over design, 交叉设计Cross-section analysis, 横断面分析Cross-section survey, 横断面调查Crosstabs , 交叉表Crosstabs 列联表分析Cross-tabulation table, 复合表Cube root, 立方根Cumulative distribution function, 分布函数Cumulative probability, 累计概率Curvature, 曲率/弯曲Curvature, 曲率Curve Estimation, 曲线拟合Curve fit , 曲线拟和Curve fitting, 曲线拟合Curvilinear regression, 曲线回归Curvilinear relation, 曲线关系Cut-and-try method, 尝试法Cycle, 周期Cyclist, 周期性D test, D检验Data acquisition, 资料收集Data bank, 数据库Data capacity, 数据容量Data deficiencies, 数据缺乏Data handling, 数据处理Data manipulation, 数据处理Data processing, 数据处理Data reduction, 数据缩减Data set, 数据集Data sources, 数据来源Data transformation, 数据变换Data validity, 数据有效性Data-in, 数据输入Data-out, 数据输出Dead time, 停滞期Degree of freedom, 自由度Degree of precision, 精密度Degree of reliability, 可靠性程度Degression, 递减Density function, 密度函数Density of data points, 数据点的密度Dependent variable, 应变量/依变量/因变量Dependent variable, 因变量Depth, 深度Derivative matrix, 导数矩阵Derivative-free methods, 无导数方法Design, 设计Determinacy, 确定性Determinant, 行列式Determinant, 决定因素Deviation, 离差Deviation from average, 离均差Diagnostic plot, 诊断图Dichotomous variable, 二分变量Differential equation, 微分方程Direct standardization, 直接标准化法Direct Oblimin, 斜交旋转Discrete variable, 离散型变量DISCRIMINANT, 判断Discriminant analysis, 判别分析Discriminant coefficient, 判别系数Discriminant function, 判别值Dispersion, 散布/分散度Disproportional, 不成比例的Disproportionate sub-class numbers, 不成比例次级组含量Distribution free, 分布无关性/免分布Distribution shape, 分布形状Distribution-free method, 任意分布法Distributive laws, 分配律Disturbance, 随机扰动项Dose response curve, 剂量反应曲线Double blind method, 双盲法Double blind trial, 双盲试验Double exponential distribution, 双指数分布Double logarithmic, 双对数Downward rank, 降秩Dual-space plot, 对偶空间图DUD, 无导数方法Duncan's new multiple range method, 新复极差法/Duncan新法Error Bar, 均值相关区间图Effect, 实验效应Eigenvalue, 特征值Eigenvector, 特征向量Ellipse, 椭圆Empirical distribution, 经验分布Empirical probability, 经验概率单位Enumeration data, 计数资料Equal sun-class number, 相等次级组含量Equally likely, 等可能Equivariance, 同变性Error, 误差/错误Error of estimate, 估计误差Error type I, 第一类错误Error type II, 第二类错误Estimand, 被估量Estimated error mean squares, 估计误差均方Estimated error sum of squares, 估计误差平方和Euclidean distance, 欧式距离Event, 事件Event, 事件Exceptional data point, 异常数据点Expectation plane, 期望平面Expectation surface, 期望曲面Expected values, 期望值Experiment, 实验Experimental sampling, 试验抽样Experimental unit, 试验单位Explained variance (已说明方差)Explanatory variable, 说明变量Exploratory data analysis, 探索性数据分析Explore Summarize, 探索-摘要Exponential curve, 指数曲线Exponential growth, 指数式增长EXSMOOTH, 指数平滑方法Extended fit, 扩充拟合Extra parameter, 附加参数Extrapolation, 外推法Extreme observation, 末端观测值Extremes, 极端值/极值F distribution, F分布F test, F检验Factor, 因素/因子Factor analysis, 因子分析Factor Analysis, 因子分析Factor score, 因子得分Factorial, 阶乘Factorial design, 析因试验设计False negative, 假阴性False negative error, 假阴性错误Family of distributions, 分布族Family of estimators, 估计量族Fanning, 扇面Fatality rate, 病死率Field investigation, 现场调查Field survey, 现场调查Finite population, 有限总体Finite-sample, 有限样本First derivative, 一阶导数First principal component, 第一主成分First quartile, 第一四分位数Fisher information, 费雪信息量Fitted value, 拟合值Fitting a curve, 曲线拟合Fixed base, 定基Fluctuation, 随机起伏Forecast, 预测Four fold table, 四格表Fourth, 四分点Fraction blow, 左侧比率Fractional error, 相对误差Frequency, 频率Frequency polygon, 频数多边图Frontier point, 界限点Function relationship, 泛函关系Gamma distribution, 伽玛分布Gauss increment, 高斯增量Gaussian distribution, 高斯分布/正态分布Gauss-Newton increment, 高斯-牛顿增量General census, 全面普查Generalized least squares, 综合最小平方法GENLOG (Generalized liner models), 广义线性模型Geometric mean, 几何平均数Gini's mean difference, 基尼均差GLM (General liner models), 通用线性模型Goodness of fit, 拟和优度/配合度Gradient of determinant, 行列式的梯度Graeco-Latin square, 希腊拉丁方Grand mean, 总均值Gross errors, 重大错误Gross-error sensitivity, 大错敏感度Group averages, 分组平均Grouped data, 分组资料Guessed mean, 假定平均数Half-life, 半衰期Hampel M-estimators, 汉佩尔M估计量Happenstance, 偶然事件Harmonic mean, 调和均数Hazard function, 风险均数Hazard rate, 风险率Heading, 标目Heavy-tailed distribution, 重尾分布Hessian array, 海森立体阵Heterogeneity, 不同质Heterogeneity of variance, 方差不齐Hierarchical classification, 组内分组Hierarchical clustering method, 系统聚类法High-leverage point, 高杠杆率点High-Low, 低区域图Higher Order Interaction Effects,高阶交互作用HILOGLINEAR, 多维列联表的层次对数线性模型Hinge, 折叶点Histogram, 直方图Historical cohort study, 历史性队列研究Holes, 空洞HOMALS, 多重响应分析Homogeneity of variance, 方差齐性Homogeneity test, 齐性检验Huber M-estimators, 休伯M估计量Hyperbola, 双曲线Hypothesis testing, 假设检验Hypothetical universe, 假设总体Image factoring,, 多元回归法Impossible event, 不可能事件Independence, 独立性Independent variable, 自变量Index, 指标/指数Indirect standardization, 间接标准化法Individual, 个体Inference band, 推断带Infinite population, 无限总体Infinitely great, 无穷大Infinitely small, 无穷小Influence curve, 影响曲线Information capacity, 信息容量Initial condition, 初始条件Initial estimate, 初始估计值Initial level, 最初水平Interaction, 交互作用Interaction terms, 交互作用项Intercept, 截距Interpolation, 内插法Interquartile range, 四分位距Interval estimation, 区间估计Intervals of equal probability, 等概率区间Intrinsic curvature, 固有曲率Invariance, 不变性Inverse matrix, 逆矩阵Inverse probability, 逆概率Inverse sine transformation, 反正弦变换Iteration, 迭代Jacobian determinant, 雅可比行列式Joint distribution function, 分布函数Joint probability, 联合概率Joint probability distribution, 联合概率分布K-Means Cluster逐步聚类分析K means method, 逐步聚类法Kaplan-Meier, 评估事件的时间长度Kaplan-Merier chart, Kaplan-Merier图Kendall's rank correlation, Kendall等级相关Kinetic, 动力学Kolmogorov-Smirnove test, 柯尔莫哥洛夫-斯米尔诺夫检验Kruskal and Wallis test, Kruskal及Wallis检验/多样本的秩和检验/H检验Kurtosis, 峰度Lack of fit, 失拟Ladder of powers, 幂阶梯Lag, 滞后Large sample, 大样本Large sample test, 大样本检验Latin square, 拉丁方Latin square design, 拉丁方设计Leakage, 泄漏Least favorable configuration, 最不利构形Least favorable distribution, 最不利分布Least significant difference, 最小显著差法Least square method, 最小二乘法Least Squared Criterion,最小二乘方准则Least-absolute-residuals estimates, 最小绝对残差估计Least-absolute-residuals fit, 最小绝对残差拟合Least-absolute-residuals line, 最小绝对残差线Legend, 图例L-estimator, L估计量L-estimator of location, 位置L估计量L-estimator of scale, 尺度L估计量Level, 水平Leveage Correction,杠杆率校正Life expectance, 预期期望寿命Life table, 寿命表Life table method, 生命表法Light-tailed distribution, 轻尾分布Likelihood function, 似然函数Likelihood ratio, 似然比line graph, 线图Linear correlation, 直线相关Linear equation, 线性方程Linear programming, 线性规划Linear regression, 直线回归Linear Regression, 线性回归Linear trend, 线性趋势Loading, 载荷Location and scale equivariance, 位置尺度同变性Location equivariance, 位置同变性Location invariance, 位置不变性Location scale family, 位置尺度族Log rank test, 时序检验Logarithmic curve, 对数曲线Logarithmic normal distribution, 对数正态分布Logarithmic scale, 对数尺度Logarithmic transformation, 对数变换Logic check, 逻辑检查Logistic distribution, 逻辑斯特分布Logit transformation, Logit转换LOGLINEAR, 多维列联表通用模型Lognormal distribution, 对数正态分布Lost function, 损失函数Low correlation, 低度相关Lower limit, 下限Lowest-attained variance, 最小可达方差LSD, 最小显著差法的简称Lurking variable, 潜在变量Main effect, 主效应Major heading, 主辞标目Marginal density function, 边缘密度函数Marginal probability, 边缘概率Marginal probability distribution, 边缘概率分布Matched data, 配对资料Matched distribution, 匹配过分布Matching of distribution, 分布的匹配Matching of transformation, 变换的匹配Mathematical expectation, 数学期望Mathematical model, 数学模型Maximum L-estimator, 极大极小L 估计量Maximum likelihood method, 最大似然法Mean, 均数Mean squares between groups, 组间均方Mean squares within group, 组内均方Means (Compare means), 均值-均值比较Median, 中位数Median effective dose, 半数效量Median lethal dose, 半数致死量Median polish, 中位数平滑Median test, 中位数检验Minimal sufficient statistic, 最小充分统计量Minimum distance estimation, 最小距离估计Minimum effective dose, 最小有效量Minimum lethal dose, 最小致死量Minimum variance estimator, 最小方差估计量MINITAB, 统计软件包Minor heading, 宾词标目Missing data, 缺失值Model specification, 模型的确定Modeling Statistics , 模型统计Models for outliers, 离群值模型Modifying the model, 模型的修正Modulus of continuity, 连续性模Morbidity, 发病率Most favorable configuration, 最有利构形MSC(多元散射校正)Multidimensional Scaling (ASCAL), 多维尺度/多维标度Multinomial Logistic Regression , 多项逻辑斯蒂回归Multiple comparison, 多重比较Multiple correlation , 复相关Multiple covariance, 多元协方差Multiple linear regression, 多元线性回归Multiple response , 多重选项Multiple solutions, 多解Multiplication theorem, 乘法定理Multiresponse, 多元响应Multi-stage sampling, 多阶段抽样Multivariate T distribution, 多元T分布Mutual exclusive, 互不相容Mutual independence, 互相独立Natural boundary, 自然边界Natural dead, 自然死亡Natural zero, 自然零Negative correlation, 负相关Negative linear correlation, 负线性相关Negatively skewed, 负偏Newman-Keuls method, q检验NK method, q检验No statistical significance, 无统计意义Nominal variable, 名义变量Nonconstancy of variability, 变异的非定常性Nonlinear regression, 非线性相关Nonparametric statistics, 非参数统计Nonparametric test, 非参数检验Nonparametric tests, 非参数检验Normal deviate, 正态离差Normal distribution, 正态分布Normal equation, 正规方程组Normal P-P, 正态概率分布图Normal Q-Q, 正态概率单位分布图Normal ranges, 正常范围Normal value, 正常值Normalization 归一化Nuisance parameter, 多余参数/讨厌参数Null hypothesis, 无效假设Numerical variable, 数值变量Objective function, 目标函数Observation unit, 观察单位Observed value, 观察值One sided test, 单侧检验One-way analysis of variance, 单因素方差分析Oneway ANOVA , 单因素方差分析Open sequential trial, 开放型序贯设计Optrim, 优切尾Optrim efficiency, 优切尾效率Order statistics, 顺序统计量Ordered categories, 有序分类Ordinal logistic regression , 序数逻辑斯蒂回归Ordinal variable, 有序变量Orthogonal basis, 正交基Orthogonal design, 正交试验设计Orthogonality conditions, 正交条件ORTHOPLAN, 正交设计Outlier cutoffs, 离群值截断点Outliers, 极端值OVERALS , 多组变量的非线性正规相关Overshoot, 迭代过度Paired design, 配对设计Paired sample, 配对样本Pairwise slopes, 成对斜率Parabola, 抛物线Parallel tests, 平行试验Parameter, 参数Parametric statistics, 参数统计Parametric test, 参数检验Pareto, 直条构成线图(又称佩尔托图)Partial correlation, 偏相关Partial regression, 偏回归Partial sorting, 偏排序Partials residuals, 偏残差Pattern, 模式PCA(主成分分析)Pearson curves, 皮尔逊曲线Peeling, 退层Percent bar graph, 百分条形图Percentage, 百分比Percentile, 百分位数Percentile curves, 百分位曲线Periodicity, 周期性Permutation, 排列P-estimator, P估计量Pie graph, 构成图,饼图Pitman estimator, 皮特曼估计量Pivot, 枢轴量Planar, 平坦Planar assumption, 平面的假设PLANCARDS, 生成试验的计划卡PLS(偏最小二乘法)Point estimation, 点估计Poisson distribution, 泊松分布Polishing, 平滑Polled standard deviation, 合并标准差Polled variance, 合并方差Polygon, 多边图Polynomial, 多项式Polynomial curve, 多项式曲线Population, 总体Population attributable risk, 人群归因危险度Positive correlation, 正相关Positively skewed, 正偏Posterior distribution, 后验分布Power of a test, 检验效能Precision, 精密度Predicted value, 预测值Preliminary analysis, 预备性分析Principal axis factoring,主轴因子法Principal component analysis, 主成分分析Prior distribution, 先验分布Prior probability, 先验概率Probabilistic model, 概率模型probability, 概率Probability density, 概率密度Product moment, 乘积矩/协方差Profile trace, 截面迹图Proportion, 比/构成比Proportion allocation in stratified random sampling, 按比例分层随机抽样Proportionate, 成比例Proportionate sub-class numbers, 成比例次级组含量Prospective study, 前瞻性调查Proximities, 亲近性Pseudo F test, 近似F检验Pseudo model, 近似模型Pseudosigma, 伪标准差Purposive sampling, 有目的抽样QR decomposition, QR分解Quadratic approximation, 二次近似Qualitative classification, 属性分类Qualitative method, 定性方法Quantile-quantile plot, 分位数-分位数图/Q-Q图Quantitative analysis, 定量分析Quartile, 四分位数Quick Cluster, 快速聚类Radix sort, 基数排序Random allocation, 随机化分组Random blocks design, 随机区组设计Random event, 随机事件Randomization, 随机化Range, 极差/全距Rank correlation, 等级相关Rank sum test, 秩和检验Rank test, 秩检验Ranked data, 等级资料Rate, 比率Ratio, 比例Raw data, 原始资料Raw residual, 原始残差Rayleigh's test, 雷氏检验Rayleigh's Z, 雷氏Z值Reciprocal, 倒数Reciprocal transformation, 倒数变换Recording, 记录Redescending estimators, 回降估计量Reducing dimensions, 降维Re-expression, 重新表达Reference set, 标准组Region of acceptance, 接受域Regression coefficient, 回归系数Regression sum of square, 回归平方和Rejection point, 拒绝点Relative dispersion, 相对离散度Relative number, 相对数Reliability, 可靠性Reparametrization, 重新设置参数Replication, 重复Report Summaries, 报告摘要Residual sum of square, 剩余平方和residual variance (剩余方差)Resistance, 耐抗性Resistant line, 耐抗线Resistant technique, 耐抗技术R-estimator of location, 位置R估计量R-estimator of scale, 尺度R估计量Retrospective study, 回顾性调查Ridge trace, 岭迹Ridit analysis, Ridit分析Rotation, 旋转Rounding, 舍入Row, 行Row effects, 行效应Row factor, 行因素RXC table, RXC表Sample, 样本Sample regression coefficient, 样本回归系数Sample size, 样本量Sample standard deviation, 样本标准差Sampling error, 抽样误差SAS(Statistical analysis system ), SAS统计软件包Scale, 尺度/量表Scatter diagram, 散点图Schematic plot, 示意图/简图Score test, 计分检验Screening, 筛检SEASON, 季节分析Second derivative, 二阶导数Second principal component, 第二主成分SEM (Structural equation modeling), 结构化方程模型Semi-logarithmic graph, 半对数图Semi-logarithmic paper, 半对数格纸Sensitivity curve, 敏感度曲线Sequential analysis, 贯序分析Sequence, 普通序列图Sequential data set, 顺序数据集Sequential design, 贯序设计Sequential method, 贯序法Sequential test, 贯序检验法Serial tests, 系列试验Short-cut method, 简捷法Sigmoid curve, S形曲线Sign function, 正负号函数Sign test, 符号检验Signed rank, 符号秩Significant Level, 显著水平Significance test, 显著性检验Significant figure, 有效数字Simple cluster sampling, 简单整群抽样Simple correlation, 简单相关Simple random sampling, 简单随机抽样Simple regression, 简单回归simple table, 简单表Sine estimator, 正弦估计量Single-valued estimate, 单值估计Singular matrix, 奇异矩阵Skewed distribution, 偏斜分布Skewness, 偏度Slash distribution, 斜线分布Slope, 斜率Smirnov test, 斯米尔诺夫检验Source of variation, 变异来源Spearman rank correlation, 斯皮尔曼等级相关Specific factor, 特殊因子Specific factor variance, 特殊因子方差Spectra , 频谱Spherical distribution, 球型正态分布Spread, 展布SPSS(Statistical package for the social science), SPSS统计软件包Spurious correlation, 假性相关Square root transformation, 平方根变换Stabilizing variance, 稳定方差Standard deviation, 标准差Standard error, 标准误Standard error of difference, 差别的标准误Standard error of estimate, 标准估计误差Standard error of rate, 率的标准误Standard normal distribution, 标准正态分布Standardization, 标准化Starting value, 起始值Statistic, 统计量Statistical control, 统计控制Statistical graph, 统计图Statistical inference, 统计推断Statistical table, 统计表Steepest descent, 最速下降法Stem and leaf display, 茎叶图Step factor, 步长因子Stepwise regression, 逐步回归Storage, 存Strata, 层(复数)Stratified sampling, 分层抽样Stratified sampling, 分层抽样Strength, 强度Stringency, 严密性Structural relationship, 结构关系Studentized residual, 学生化残差/t化残差Sub-class numbers, 次级组含量Subdividing, 分割Sufficient statistic, 充分统计量Sum of products, 积和Sum of squares, 离差平方和Sum of squares about regression, 回归平方和Sum of squares between groups, 组间平方和Sum of squares of partial regression, 偏回归平方和Sure event, 必然事件Survey, 调查Survival, 生存分析Survival rate, 生存率Suspended root gram, 悬吊根图Symmetry, 对称Systematic error, 系统误差Systematic sampling, 系统抽样Tags, 标签Tail area, 尾部面积Tail length, 尾长Tail weight, 尾重Tangent line, 切线Target distribution, 目标分布Taylor series, 泰勒级数Test(检验)Test of linearity, 线性检验Tendency of dispersion, 离散趋势Testing of hypotheses, 假设检验Theoretical frequency, 理论频数Time series, 时间序列Tolerance interval, 容忍区间Tolerance lower limit, 容忍下限Tolerance upper limit, 容忍上限Torsion, 扰率Total sum of square, 总平方和Total variation, 总变异Transformation, 转换Treatment, 处理Trend, 趋势Trend of percentage, 百分比趋势Trial, 试验Trial and error method, 试错法Tuning constant, 细调常数Two sided test, 双向检验Two-stage least squares, 二阶最小平方Two-stage sampling, 二阶段抽样Two-tailed test, 双侧检验Two-way analysis of variance, 双因素方差分析Two-way table, 双向表Type I error, 一类错误/α错误Type II error, 二类错误/β错误UMVU, 方差一致最小无偏估计简称Unbiased estimate, 无偏估计Unconstrained nonlinear regression , 无约束非线性回归Unequal subclass number, 不等次级组含量Ungrouped data, 不分组资料Uniform coordinate, 均匀坐标Uniform distribution, 均匀分布Uniformly minimum variance unbiased estimate, 方差一致最小无偏估计Unit, 单元Unordered categories, 无序分类Unweighted least squares, 未加权最小平方法Upper limit, 上限Upward rank, 升秩Vague concept, 模糊概念Validity, 有效性VARCOMP (Variance component estimation), 方差元素估计Variability, 变异性Variable, 变量Variance, 方差Variation, 变异Varimax orthogonal rotation, 方差最大正交旋转Volume of distribution, 容积W test, W检验Weibull distribution, 威布尔分布Weight, 权数Weighted Chi-square test, 加权卡方检验/Cochran检验Weighted linear regression method, 加权直线回归Weighted mean, 加权平均数Weighted mean square, 加权平均方差Weighted sum of square, 加权平方和Weighting coefficient, 权重系数Weighting method, 加权法W-estimation, W估计量W-estimation of location, 位置W估计量Width, 宽度Wilcoxon paired test, 威斯康星配对法/配对符号秩和检验Wild point, 野点/狂点Wild value, 野值/狂值Winsorized mean, 缩尾均值Withdraw, 失访Youden's index, 尤登指数Z test, Z检验Zero correlation, 零相关Z-transformation, Z变换。