9. 040301_DTE-MS-JK_R3-Wear_Paper Published_Rev 0
等速技术和弹力带阻抗运动在脑卒中康复领域应用的研究进展

实用临床医药杂志Journal of Clinical Medicine in Practice 2220年第24卷第10期・28・等速技术和弹力带阻抗运动在脑卒中康复领域应用的研究进展吕俊良,王志强,于莉莉,张萍(中国医科大学附属盛京医院康复医学中心,辽宁沈阳,110006)摘要:等速技术在康复医学领域中具有高安全性、可重复性、客观性等优点,在临床得到了广泛应用。
本文重点阐述近年来等速技术应用于脑卒中患者康复评定和康复训练的研究进展,并综述弹力带阻抗运动训练对脑卒中偏瘫患者肌力、耐力等运动功能的影响,对比两种训练方法的优缺点,探讨弹力带阻抗运动训练替代等速肌力训练作为偏瘫肌力训练器材的可能性。
关键词:等速技术;弹力带;阻抗运动;脑卒中;偏瘫;康复医学中图分类号:R743文献标志码:A文章编号:1072-2353(2222)10-024-05D0I:10.7619/jcmp.222010007Research progress of isokinetic technique andresistance exercise of elastic band inreCabilitation of cereXrol strokeLYU Junliang,WANG Zhiqiang,YU Lilt,ZHANG Ping(Rehabilitation Medical Center,Shengjing Hospital Affiliated to China MedicalUniversity,Shenyang,Liaoning,110006)ABSTRACT:IsoUiaeda technique has beed widely used in the field of redabilitatiou medicine, which hco thd abvantagdo of high safety ,npdhbility ani oUjechvity.Thio pdpd focasdo ou thd n-sedrch prooresa of isoUiaeda techniqrd in redabilitatiou assessmedi ant redabilitatiou trainina of stroUd patiedia in recedi yua,ani sammanzda thd effecia of resistaica exercise by elastia bani ou mrscid $1:011£止,ani。
Pearson Edexcel GCE 6FT03 Paper 01 商品说明说明书

Examiners’ Report/Principal Examiner Feedback Summer 2014Pearson Edexcel GCE inDesign & Technology6FT03 Paper 01Food Products, Nutrition and ProductDevelopmentEdexcel and BTEC QualificationsEdexcel and BTEC qualifications are awarded by Pearson, the UK’s largest awarding body. We provide a wide range of qualifications including academic, vocational, occupational and specific programmes for employers. For further information visit our qualifications websites at or . Alternatively, you can get in touch with us using the details on our contact us page at /contactus.Pearson: helping people progress, everywherePearson aspires to be the world’s leading learning company. Our aim is to help everyone progress in their lives through education. We believe in every kind of learning, for all kinds of people, wherever they are in the world. We’ve been involved in education for over 150 years, and by working across 70 countries, in 100 languages, we have built an international reputation for our commitment to high standards and raising achievement through innovation in education. Find out more about how we can help you and your students at: /ukSummer 2014Publications Code UA038510All the material in this publication is copyright© Pearson Education Ltd 2014UNIT 6FT03Food Products, Nutrition and Product DevelopmentThe focus of the 6FT03 paper is to examine students on the knowledge they have developed on a range of food commodities, aspects of nutrition, product development and food innovation. Students are required to have a comprehensive knowledge of the main food commodities, their composition, basic processing and typical spoilage patterns.A sound knowledge of nutrition and its influence on the diet, contemporary lifestyle issues and new product development is particularly important for food technologists. Similarly, consumer behaviour, demographics, modern lifestyles, cultural changes and sustainable issues have an influence on new product development. It is also important for students to be aware of the influence of new technologies and materials on the development of new food products.The coverage of this paper effectively tested the students’ knowledge and understanding of the topic areas. The 'ramped' nature of the exam paper and variety of question styles and command words promoted accessibility to students of all ability levels. Progression, application of knowledge and understanding within the subject area was evident, promoting stretch and challenge opportunities for higher ability students. Marks were scored evenly across all areas of the paper, with effective differentiation across the paper.Question 1(a)In Q1(a) students were required to identify the component proteins which form muscle. Most students correctly identified actin and myosin. The paper is ramped, with the challenge increasing as the paper progresses; this question elicited a very good response from students, with nearly all being able to achieve full marks.Question 1(b)This question focused on ‘the breakdown of fish tissues after catching’ and ‘the development of odours’. Good responses identified that LITTLE glycogen is present in the fish after catching due to it being used up in the movement of fish as they are caught. This results in little lactic acid being produced and then a relatively high pH resulting leading to the rapid bacterial spoilage of fish. Good responses used technical terms frequently e.g. ‘trimethylamine oxide changes to trimethylamine’. This seems to be a popular topic with students; many did well demonstrating a good understanding of the changes which occur in fish after catching. Where students did less well, they had an attempt at the question but showed little understanding of the changes which occur after death. Superficial knowledge was shown; students who did not do as well would write about anything to do with fish, not specific to the question. A focus on ‘slimy’ skin, change in colour rather than more technical changes was apparent inmiddling answers. Many students wrote about changes occurring in meat rather than the specific changes in fish. This was a common issue where students had learnt previous answers to past questions but applied this knowledge incorrectly thus showing little understanding.Question 2(a)This question required that students could identify the enzymes needed to enable digestion of the macro-nutrients. This proved to be a very good differentiation question with top students being able to identify these enzymes correctly. It was a recall question with no explanations or discussions required; as such those who had learned the process of digestion were able to achieve well.Question 2(b)Students were required to identify the final components the macro-nutrients are broken down into in the digestive process in order to enable absorption to occur. Some students revealed high level knowledge of the process, achieving full marks. Such knowledge is fundamental to a good understanding of the digestive process. Many students scored poorly on this question simply due to a lack of knowledge rather than lack of understanding. Very few achieved highly; students seemed to list a number of hopeful, but incorrect answers. Fatty acids alone was the most common incorrect answer for fat, while starch or glycerol were the most common incorrect responses for carbohydrates.Question 2(c)This question focused on the role of bile as a key component in the digestive system. Good responses focused on the role of bile as an emulsifier of fat, enabling it to be broken down thus facilitating the role of lipase. It was pleasing to see many students achieve well with this question. Question 3(a)This question focused on the characteristic composition and behaviour of climacteric and non–climacteric fruits during storage and ripening. Many students showed a good understanding, being able to describe differences and relate the behaviour to the storage and/or shelf life of fruit.Question 3(b)This also focused on changes during storage and ripening. It steps up in difficulty as students are now expected to ‘explain’ the ripening process. It is not enough in an ‘explain’ question to simply state the changes; to achieve full marks students would need to explain why colour, texture, sweetness etc changes as a fruit ripens. For example, by stating that ‘starch breaks down to simple sugars to become sweeter’, or that ‘colour changes due to chlorophyll pigments breaking down to release other pigments’, then being able to name these pigments eg carotonoids or anthocyanins ensured students were awarded high marks. At A2 level, it is expected thatstudents will have developed this knowledge and understanding; it is not enough to simply state that the changes occur.Question 4(a)There have been many cultural changes impacting new product development; students who achieved well identified and described this, often giving appropriate reasons for such changes and went on to give specific examples of relevant new products.Question 4(b)(i) and (ii)Several students were able to identify correctly the stages of the life cycle; less were able to apply the correct marketing plan to the identified stage. Where this was done well, it was very pleasing to witness excellent knowledge and understanding demonstrated. The students who scored highly on this question tended to write about the introduction and decline stages, although good responses were also sometimes seen for the maturity and growth stages. The most common reason for not achieving marks was to identify the ‘growth’ stage but write about marketing plans implemented in the ‘introduction’ stage, thus confusing the two.Question 5(a)This question focused on the role of iron in the diet; students were expected to be able to give the functions of iron in the diet and state good food sources. Higher achieving students could frequently give 2 functions with formation of haemoglobin and prevention of anaemia being the most common correct answers. It would have been good to see more students mention myoglobin or iron’s role in enzyme systems. Although the majority of students were able to identify sources of both haem iron and non-haem iron, many failed to achieve a mark by simply writing ‘meat’ as a good food source of haem iron. ‘Meat’ alone is not specific enough at A2 level; to achieve a mark, students should have written ‘red meat’ or given a named red meat.Question 5(b)Students were required to discuss the role of dietary fibre in the diet. Dietary fibre is a very important component of the diet. As Food Technology students, students should be able to demonstrate high level knowledge of this component and be able to discuss its role. However, there seemed to be much confusion about this component with several students being unable to discuss its role beyond preventing constipation. Good responses could identify a variety of correct functions, as well as discuss the implications of too much fibre in the diet. It would have been good to see more development of answers e.g. how dietary fibre can be useful in the control of obesity or how dietary fibre may help prevent diabetes type II rather than simply stating that it does these things.Questions 6(a) and 6(b)Many students could identify the uses of energy, but it would have been good to have seen more technical terms used, eg Basal metabolism rather than ‘ for bodily functions’. Good responses were frequently given for Q6(b) with many students being able to clearly explain the concept of negative energy balance. Some students unfortunately confused negative energy balance with positive energy balance, thus not gaining any marks. Question 6(c)Obesity is a diet related disease and Food Technology students should have a clear awareness of the implications of this illness not just for the individual but also for society as a whole. The question was generally very well answered with most students identifying obesity related diseases as well as commenting on the burden on the NHS or the cost to the economy. Many students suggested ways health professionals could promote healthy lifestyles.Question 6(d)Linked to the previous question but it also specifically requires students to apply their knowledge of new materials on new food products, specifically those focused on reduced-calorie diets. All the materials studied in the specification; modified starches, encapsulated materials and meat analogues or novel proteins, have been used to provide the consumer with reduced calorie products. An understanding of the function of these materials and how they can be applied is expected at this level. There was a very good range of answers with all these new materials covered. Most students referred to the low fat/high protein nature of meat analogues. Some wrote about modified starches, especially their role as fat replacers in low-fat meals to give a creamy mouthfeel. There were a few good answers focusing on the role of encapsulated materials, although it would have been good to see these particular responses developed more, especially as encapsulation is one of the growing sectors in new food materials. Some good responses focused on artificial sweeteners, which although not on the 6FT03 specification, is still a valid response as examples of new food materials widely used in reduced-calorie food products. Q6(d) was either answered very well or students tended to miss the point of the question and instead of writing about a new food material and how these can be used in food products aimed at those on a reduced-calorie diet, wrote about low-fat products or slimming diets in general.Question 7(a)For this question, students were required to state the three main parts of a cereal grain and most could give three correct answers.Question 7(b)Students were required to relate their knowledge of wheat, the different types, whether hard or soft, and then apply this knowledge to the processesinvolved in bread making, biscuit making and pasta making. There were many excellent responses and it is good to see that centres are very evidently using practical work to teach theory work very successfully. Good responses showed an excellent understanding of the different wheats and their properties, revealing how these properties are put to use in the processes of making these important products. It seems that perhaps this question was frequently misread. Students who did not achieve well with this question answered by writing about different types of flour used in these processes rather than focusing on the different types of wheat. For instance, there was much description of white flour as opposed to wholemeal, or plain or even self-raising. 00 flour was frequently mentioned for pasta making, correct but not relevant to the question. Some students spent time writing about different cereal grains such as rye, not even focusing on wheat. It is important to be able to understand the materials used in order to understand the processes involved in the making of bread, biscuits and pasta. Good responses showed an excellent understanding of the different types of wheat and their properties, applying this knowledge to the processes involved.It was very pleasing to see the depth of detail included in questions which required explanation and discussion. Successful students were able to demonstrate high level knowledge and understanding in their responses to the questions. It is very evident that centres are teaching the specification well and training students to appropriately recognise and use the command words which are used to differentiate questions. Less successful students frequently had difficulty in achieving marks in the questions which required explanations. It is not sufficient to simply provide descriptions; underlying explanations also need to be provided at this level. Less successful students appeared to sometimes misread questions, for instance question 7b.Centres need to be aware of the necessity to prepare students for this exam by ensuring that they have a full understanding of the requirements of different question types: name, state, give, describe, outline, compare, contrast, discuss, evaluate and explain.Centres must ensure full coverage of the specification as any area could be tested. It would be useful for all centres to ensure the ‘Subject Content Guide’ for 6FT03 is referred to by both teachers and students. This can be accessed on the Pearson Edexcel website, on the GCE Food Technology page, under Teacher Support Materials.Grade BoundariesGrade boundaries for this, and all other papers, can be found on the website on this link:/iwantto/Pages/grade-boundaries.aspxPearson Education Limited. Registered company number 872828 with its registered office at Edinburgh Gate, Harlow, Essex CM20 2JE。
GCF Field Trial requirements for GSM_GPRS_EGPRS

GLOBAL CERTIFICATION FORUM (GCF) LtdWork Item DescriptionField Trial requirements for GSM/GPRS/EGPRSReference: GCF WI-108Version: v3.1.0Date: 29.01.2010Document Type: Technical1 ScopeThe scope of this work item covers the renewal of Field Trial requirements for GSM/(E)GPRS including SIM/USIM.2 DescriptionThis Work Item description has been created to handle the renewal of GSM/(E)GPRS including SIM/USIM Field Trial requirements.3 JustificationField Trials are an integral part of the GCF scheme and therefore are required to evolve in conjunction with the implementation of associated mobile technology.4 Supporting companiesCSR, Ericsson Mobile Platforms, Motorola, NEC, Nokia, O2 UK, Orange France, RIM, Sony Ericsson, Vodafone Group, Broadcom, TIM, TeliaSonera5 RapporteurMarc OuwehandNokia CorporationTelephone: +358 40828 0908E-mail: marc.ouwehand@6 Affected bandsNote: GSM 850 and 1900 are outside the GCF certification scheme.7 Core Specifications8 Test SpecificationsNote: The operator expectations on each identified Field Trial Requirement can be derived from the GSMA PRD DG 11 ‘DG Field and Lab Trial Guidelines’, It is emphasised that DG.11 is only a guideline and that manufacturers may use their own test procedures.9 Work Item Certification Entry9.1 Work Item Certification Entry Criteria (CEC)N/A.9.2 Target Work Item Certification Entry Date / GCF-CC versionN/A10 Work Item Freeze and Completion CriteriaDuring the next PRP review this WI should be set to ‘Completed’.11 Conformance Test RequirementsN/A12 IOP Test RequirementsN/A13 Field Trial RequirementsFor BSS/MSC network dependent Field Trial Requirements (BM)For GPRS network dependent Field Trial Requirements (GPRS)For SIM/UICC dependent Field Trial Requirements (2GSIM)For SMSC dependent Field Trial Requirements (SMS)For Network/SIM/UICC/Client independent Field Trial Requirements (NI)14 Periodic Review PointsThe next PRP-review for this WI will be held at the t FT AG meeting during Q3 2010.15 Other commentsThe information below is coming from both WI’s, which during the FT AG #15 meeting has been merged into this WI.Former WI-028 Comments:- During the SG 25 meeting a concern was raised about the approval of this Work Item as well as the CR’s attached to this Work Item via 10 day rule process. The SG made clear that this approval process is not conform the official GCF rules. The SG supposed to approve this Work Item and CR’s. During the SG 25 meeting document S-06-053 was created and approved by the SG to give a mandate for approval via 10 day rule. This mandate applies only for CR’s concerning this Work Item.- Due to the introduction of this Work Item and Work Item 27 (HSDPA) it is required that GCF operators re-declare their status as GCF Qualified operator by using the new Annex B, which should be available in thePRD GCF-OP released in April 2006. The CR for this renewed Annex B is a part of this Work Item and will be uploaded as CR FT-06-022r4During the teleconference of 20.3.2006 there was agreed that an agenda point will be made for FT AG #04,3-4 May 2006 concerning re-declaration.- During the teleconference of 20.3.2006, there was noticed that the mandate for this Work Item didn’t include the EGPRS feature. Therefore it was agreed that the EGPRS topic will be put on the agendafor FT AG #04.Mr. M. Ouwehand (Nokia) will take care that there will be a discussion/input documentavailable for the FT AG #04.When WI-028 has been activated there was agreed to put a ‘transition period’ in place, due the fact that bythat time there were no enough FTQ ANNEX B documents available.During the FT AG #08, 2-3 May 2007, there has been agreed that the ‘transition period’ is ended by therelease of GCF-CC 3.26.0.Former WI-048 Comments:It was suggested during the FTAG meeting discussions of this WI that the most effective method ofadministrating and executing the EDGE classified test requirements while maintaining confidence in GCF FTfor both GPRS and EDGE networks is:a) Introduce a new classification called EDGEb) Copy all existing GPRS requirements to the EDGE Requirements.c) FT on GPRS NW Configurations do not need to perform the EDGE classified test requirementsd) FT on EDGE NW Configurations do not need to perform the GPRS classified test requirements.When this WI meet the CEC and therefore will be activated, it should be considered by FT AG to merge the EDGE Field Trial requirements table into the existing GPRS Field Trial requirements table as has been done with PS, HSDPA & EUL requirements table merge.The CR’s to GCF-CC related to this Work Item need to be submitted at the same time that CR to activate this Work item will be submitted.16 Document Change Record。
Guidance document on pesticide residue

EUROPEAN COMMISSION12Directorate General Health and Consumer Protection345SANCO/825/00 rev. 8.1 616/11/2010 78Guidance document on pesticide residue 9analytical methods10111213141516[Revision 8 is the version of this guidance document that is currently valid. It is, however, under1718continuous review and will be updated when necessary. The document is aimed at 19manufacturers seeking pesticides authorisations and parties applying for setting or modification 20of an MRL. It gives requirements for methods that would be used in post-registration 21monitoring and control by the competent authorities in Member States in the event that 22authorisations are granted. For authorities involved in post-registration control and monitoring, the document may be considered as being complementary to the documents: Method Validation2324and Quality Control Procedures for Pesticide Residues Analysis in Food and Feed (for the valid revision visit http://ec.europa.eu/food/plant/protection/resources/publications_en.htm) and the2526OECD document “Guidance Document on pesticide residue analytical methods”, 2007.27(ENV/JM/ ENV/JM/MONO(2007)17).1Preamble (4)28292General (5)302.1Good Laboratory Practice (5)312.2Selection of analytes for which methods are required (5)322.3Description of an analytical method and its validation results (5)332.4Hazardous reagents (6)342.5Acceptable analytical techniques considered commonly available (6)352.6Multi-residue methods (7)362.7Single methods and common moiety methods (7)372.8Single methods using derivatisation (7)382.9Method validation (8)392.9.1Calibration (8)2.9.2Recovery and Repeatability (9)40412.9.3Selectivity (11)422.10Confirmation (11)432.10.1Confirmation simultaneous to primary detection (11)442.10.2Confirmation by an independent analytical technique (12)452.11Independent laboratory validation (ILV) (12)2.12Availability of standards (13)46472.13Extraction Efficiency (13)483Analytical methods for residues in plants, plant products, foodstuff (of plant origin),feedingstuff (of plant origin) (Annex IIA Point 4.2.1 of Directive 91/414/EEC; Annex Point IIA,4950Point 4.3 of OECD) (14)513.1Purpose (14)523.2Selection of analytes (14)533.3Commodities and Matrix Groups (14)543.4Limit of quantification (15)553.5Independent laboratory validation (ILV) (15)564Analytical methods for residues in foodstuff (of animal origin) (Annex IIA Point 4.2.1 of 57Directive 91/414/EEC; Annex Point IIA, Point 4.3 of OECD) (16)584.1Purpose (16)594.2Selection of analytes (16)604.3Commodities (16)614.4Limit of quantification (16)4.5Independent laboratory validation (ILV) (16)62635Analytical methods for residues in soil (Annex IIA, Point 4.2.2 of Directive 91/414/EEC;64Annex Point IIA, Point 4.4 of OECD) (17)655.1Purpose (17)665.2Selection of analytes (17)675.3Samples (17)685.4Limit of quantification (17)696Analytical methods for residues in water (Annex IIA, Point 4.2.3 of Directive 91/414/EEC;70Annex Point IIA; Point 4.5 of OECD) (19)716.1Purpose (19)726.2Selection of analytes (19)736.3Samples (19)746.4Limit of quantification (19)756.5Direct injection (20)767Analytical methods for residues in air (Annex IIA, Point 4.2.4 of Directive 91/414/EEC; 77Annex Point IIA; Point 4.7 of OECD) (21)7.1Purpose (21)78797.2Selection of analytes (21)807.3Samples (21)7.4Limit of quantification (21)81827.5Sorbent characteristics (22)837.6Further validation data (22)7.7Confirmatory methods (22)84858Analytical methods for residues in body fluids and tissues (Annex IIA, Point 4.2.5 of86Directive 91/414/EEC; Annex Point IIA Point 4.8 of OECD) (23)8.1Purpose (23)87888.2Selection of analytes (23)898.3Samples (23)908.4Sample set (23)918.5Limit of quantification (23)929Summary - List of methods required (24)10Abbreviations (25)939411References (27)951Preamble96This document provides guidance to applicants, Member States and EFSA on the data 97requirements and assessment for residue analytical methods for post-registration control and 98monitoring purposes. It is not intended for biological agents such as bacteria or viruses. It 99recommends possible interpretations of the provisions of section 3.5.2 of Annex II of 100Regulation (EC) No 1107/2009 [1] and of the provisions of section 4, part A of Annex II and 101section 5, part A of Annex III of Council Directive 91/414/EEC [2]. It also applies to 102applications for setting or modification of an MRL within the scope of Regulation (EC) No 103396/2005 [3]. It has been elaborated in consideration of the ‘Guidance Document on pesticide 104residue analytical methods’ of the OECD [4] and SANCO/10684/2009 “Method validation 105and quality control procedures for pesticide residue analysis in food and feed” [5].106This document has been conceived as an opinion of the Commission Services and elaborated 107in co-operation with the Member States. It does not, however, intend to produce legally 108binding effects and by its nature does not prejudice any measure taken by a Member State nor 109any case law developed with regard to this provision. This document also does not preclude 110the possibility that the European Court of Justice may give one or another provision direct 111effect in Member States.112This guidance document must be amended at the latest if new data requirements as referred to 113in Article 8 (1)(b) and 8 (1)(c) of Regulation (EC) No 1107/2009 will have been established 114in accordance with the regulatory procedure with scrutiny referred to in Article 79 (4).1152General1162.1Good Laboratory Practice117According to Guidance Document 7109/VI/94-Rev. 6.c1 (Applicability of Good Laboratory 118Practice to Data Requirements according to Annexes II, Part A, and III, Part A, of Council 119Directive 91/414/EEC) [6] the development and validation of an analytical method for 120monitoring purposes and post-registration control is not subject to GLP. However, where the 121method is used to generate data for registration purposes, for example residue data, these 122studies must be conducted to GLP.1232.2Selection of analytes for which methods are required124The definition of the residues relevant for monitoring in feed and food as well as in 125environmental matrices and air is not the subject matter of this document. Criteria for the 126selection of analytes in case that no legally binding definition is available are given in the 127respective sections 3 - 8. In addition, sections 5.2, 6.2, 7.2 and 8.2 clarify under which 128circumstances analytical methods for residues may not be necessary.1292.3Description of an analytical method and its validation results130Full descriptions of validated methods shall be provided. The submitted studies must include 131the following points:132•Itemisation of the fortified compounds and the analytes, which are quantified133•Description of the analytical method134•Validation data as described in more detail below135•Description of calibration including calibration data136•Recovery and Repeatability137•Data proving the selectivity of the method138•Confirmatory data, if not presented in a separate study139•References (if needed)140141The following information should be offered in the description of the analytical method:142•An introduction, including the scope of the method143•Outline/summary of method, including validated matrices, limit of quantification (LOQ), 144range of recoveries, fortification levels and number of fortifications per level145•Apparatus and reagents146•instrument parameters used as example if appropriate147•Description of the analytical method, including extraction, clean-up, derivatisation (if148appropriate), chromatographic conditions (if appropriate) and quantification technique149•Hazards or precautions required150•Time required for one sample set151•Schematic diagram of the analytical method152•Stages where an interruption of the method is possible153•Result tables (if results are not presented in separate studies)154•Procedure for the calculation of results from raw data155•Extraction efficiency of solvents used156•Important points and special remarks (e.g. volatility of analyte or its stability with regard 157to pH)158•Information on stability of fortified/incurred samples, extracts and standard solutions (If 159the recoveries in the fortified samples are within the acceptable range of 70-120 %,160stability is sufficiently proven.)161Sometimes it may be necessary for other information to be presented, particularly where 162special methods are considered.1632.4Hazardous reagents164Hazardous reagents (carcinogens category I and II [7]) shall not be used. Among these 165compounds are diazomethane, chromium (VI) salts, chloroform and benzene.1662.5Acceptable analytical techniques considered commonly available167Analytical methods shall use instrumentation regarded as "commonly available":168•GC detectors: FPD, NPD, ECD, FID, MS, MS n (incl. Ion Traps and MS/MS), HRMS169•GC columns: capillary columns170•HPLC detectors: MS, MS/MS, HRMS, FLD, UV, DAD171•HPLC columns: reversed phase, ion-exchange, normal phase172•AAS, ICP-MS, ICP-OES173Other techniques can be powerful tools in residue analysis, therefore the acceptance of 174additional techniques as part of enforcement methods should be discussed at appropriate 175intervals. Whilst it is recognised that analytical methodology is constantly developing, some 176time elapses before new techniques become generally accepted and available.1772.6Multi-residue methods178Multi-residue methods that cover a large number of analytes and that are based on GC-MS 179and/or HPLC-MS/MS are routinely used in enforcement laboratories for the analysis of plant 180matrices. Therefore, validated residue methods submitted for food of plants, plant products 181and foodstuff of plant origin (Section 3) should be multi-residue methods published by an 182international official standardisation body such as the European Committee for 183Standardisation (CEN) (e.g. [8 - 12]) or the AOAC International (e.g. [13]). Single residue 184methods should only be provided if data show and are reported that multi-residue methods 185involving GC as well as HPLC techniques cannot be used.186If validation data for the residue analytical method of an analyte in at least one of the 187commodities of the respective matrix group have been provided by an international official 188standardisation body and if these data have been generated in more than one laboratory with 189the required LOQ and acceptable recovery and RSD data (see Section 2.9.2), no additional 190validation by an independent laboratory is required.1912.7Single methods and common moiety methods192Where a pesticide residue cannot be determined using a multi-residue method, one or where 193appropriate more alternative method(s) must be proposed. The method(s) should be suitable 194for the determination of all compounds included in the residue definition. If this is not 195possible and an excessive number of methods for individual compounds would be needed, a 196common moiety method may be acceptable, provided that it is in compliance with the residue 197definition. However, common moiety methods shall be avoided whenever possible.1982.8Single methods using derivatisation199For the analysis of some compounds by GC, such as those of high polarity or with poor 200chromatographic properties, or for the detection of some compounds in HPLC, derivatisation 201may be required. These derivatives may be prepared prior to chromatographic analysis or as 202part of the chromatographic procedure, either pre- or post-column. Where a derivatisation 203method is used, this must be justified.204If the derivatisation is not part of the chromatographic procedure, the derivative must be 205sufficiently stable and should be formed with high reproducibility and without influence of 206matrix components on yield. The efficiency and precision of the derivatisation step should be 207demonstrated with analyte in sample matrix against pure derivative. The storage stability of 208the derivative should be checked and reported. For details concerning calibration refer to 209Section 2.9.1.210The analytical method is considered to remain specific to the analyte of interest if the 211derivatised species is specific to that analyte. However, where – in case of pre-column 212derivatisation – the derivative formed is a common derivative of two or more active 213substances or their metabolites or is classed as another active substance, the method should be 214considered non-specific and may be deemed unacceptable.2152.9Method validation216Validation data must be submitted for all analytes included in the residue definition for all 217representative sample matrices to be analysed at adequate concentration levels.218Basic validation data are:219•Calibration data220•Concentration of analyte(s) found in blank samples221•Concentration level(s) of fortification experiments222•Concentration and recovery of analyte(s) found in fortified samples223•Number of fortification experiments for each matrix/level combination224•Mean recovery for each matrix/level combination225•Relative standard deviation (RSD) of recovery, separate for each matrix/level combination 226•Limit of quantification (LOQ), corresponding to the lowest validated level227•Representative clearly labelled chromatograms228•Data on matrix effects, e.g. on the response of the analyte in matrix as compared to pure 229standards230.Further data may be required in certain cases, depending on the analytical method used, and 231the residue definition to be covered.2322.9.1Calibration233The calibration of the detection system shall be adequately demonstrated at a minimum of 3 234concentration levels in duplicate or (preferably) 5 concentration levels with single 235determination. Calibration should be generated using standards prepared in blank matrix 236extracts (matrix matched standards) for all sample materials included in the corresponding 237validation study (Sections 3 - 8). Only, if experiments clearly demonstrate that matrix effects 238are not significant (i.e. < 20 %), calibration with standards in solvent may be used. Calibration 239with standards in solvent is also acceptable for methods to detect residues in air (Section 7). 240In case that aqueous samples are analysed by direct injection HPLC-MS/MS calibration shall 241be performed with standards in aqueous solution.242The analytical calibration must extend to at least the range which is suitable for the 243determination of recoveries and for assessment of the level of interferences in control 244samples. For that purpose a concentration range shall be covered from 30 % of the LOQ to 24520 % above the highest level (Section 2.9.2).246All individual calibration data shall be presented together with the equation of the calibration. 247Concentration data should refer to both, the mass fraction in the original sample (e.g. mg/kg) 248and to the concentration in the extract (e.g. µg/L). A calibration plot should be submitted, in 249which the calibration points are clearly visible. A plot showing the response factor1 versus the 250concentration for all calibration points is preferred over a plot of the signal versus the 251concentration.252Linear calibrations are preferred if shown to be acceptable over an appropriate concentration 253range. Other continuous, monotonically increasing functions (e.g. exponential/power, 254logarithmic) may be applied where this can be fully justified based on the detection system 255used.256When quantification is based on the determination of a derivative, the calibration shall be 257conducted using standard solutions of the pure derivative generated by weighing, unless the 258derivatisation step is an integral part of the detection system. If the derivative is not available 259as a reference standard, it should be generated within the analytical set by using the same 260derivatisation procedure as that applied for the samples. Under these circumstances, a full 261justification should be given.2622.9.2Recovery and Repeatability263Recovery and precision data must be reported for the following fortification levels, except for 264body fluids and body tissues (Section 8):265•LOQ 5 samples266•10 times LOQ, or MRL (set or proposed) or other relevant level (≥ 5 x LOQ)2675 samples268Additionally, for unfortified samples residue levels must be reported:269samples•blankmatrix 2270According to the residue definition the LOQ of chiral analytes usually applies to the sum of 271the two enantiomers. In this case it is not necessary to determine the enantiomers separately. 2721 The response factor is calculated by dividing the signal area by the respective analyte concentration.Enantioselective methods would only be required if a single enantiomer is included in the 273residue definition.274In cases of complex residue definitions (e.g. a residue definition which contains more than 275one compound) the validation results shall be reported for the single parts of the full residue 276definition, unless the single elements cannot be analysed separately.277The mean recovery at each fortification level and for each sample matrix should be in the 278range of 70 % - 120 %. In certain justified cases mean recoveries outside of this range will be 279accepted.280For plants, plant products, foodstuff (of plant and animal origin) and in feeding stuff recovery 281may deviate from this rule as specified in Table 1.2282Table 1: Mean recovery and precision criteria for plant matrices and animal matrices [4]283Concentration level Range of mean recovery(%)Precision, RSD(%)> 1 µg/kg ≤ 0.01 mg/kg 60 - 120 30> 0.01 mg/kg ≤ 0.1 mg/kg 70 - 120 20> 0.1 mg/kg ≤ 1.0 mg/kg 70 - 110 15> 1 mg/kg 70 - 110 10284If blank values are unavoidable, recoveries shall be corrected and reported together with the 285uncorrected recoveries.286The precision of a method shall be reported as the relative standard deviation (RSD) of 287recovery at each fortification level. For plants, plant products, foodstuff (of plant and animal 288origin) and feeding stuff the RSD should comply with the values specified in Table 1. In other 289cases the RSD should be ≤ 20 % per level. In certain justified cases, e.g. determination of 290residues in soil lower than 0.01 mg/kg, higher variability may be accepted.291When outliers have been identified using appropriate statistical methods (e.g. Grubbs or 292Dixons test), they may be excluded. Their number must not exceed 1/5 of the results at each 293fortification level. The exclusion should be justified and the statistical significance must be 2942 According to Annex IIA 4.2 of Directive 91/414/EEC the mean recovery should normally be 70 % - 110 % andthe RSD should preferably be ≤ 20 %.clearly indicated. In that case all individual recovery data (including those excluded) shall be 295reported.2962.9.3Selectivity297Representative clearly labelled chromatograms of standard(s) at the lowest calibrated level, 298matrix blanks and samples fortified at the lowest fortification level for each analyte/matrix 299combination must be provided to prove selectivity of the method. Labelling should include 300sample description, chromatographic scale and identification of all relevant components in the 301chromatogram.302When mass spectrometry is used for detection, a mass spectrum (in case of MS/MS: product 303ion spectrum) should be provided to justify the selection of ions used for determination.304Blank values (non-fortified samples) must be determined from the matrices used in 305fortification experiments and should not be higher than 30 % of the LOQ. If this is exceeded, 306detailed justification should be provided.3072.10Confirmation308Confirmatory methods are required to demonstrate the selectivity of the primary method for 309all representative sample matrices (Sections 3 – 8). It has to be confirmed that the primary 310method detects the right analyte (analyte identity) and that the analyte signal of the primary 311method is quantitatively correct and not affected by any other compound.3122.10.1Confirmation simultaneous to primary detection313A confirmation simultaneous to the primary detection using one fragment ion in GC-MS and 314HPLC-MS or one transition in HPLC-MS/MS may be accomplished by one of the following 315approaches:316•In GC-MS, HPLC-MS, by monitoring at least 2 additional fragment ions (preferably317m/z > 100)for low resolution system and at least 1 additional fragment ion for high318resolution/accurate mass system319•In GC-MS n (incl. Ion Traps and MS/MS), HPLC-MS/MS, by monitoring at least 1320additional SRM transition321The following validation data are required for the additional fragment ions (MS and HRMS) 322or the additional SRM transition (MS n and MS/MS): calibration data (Section 2.9.1), recovery 323and precision data according to Section 2.9.2 for samples fortified at the respective LOQ (n = 3245) and for 2 blank samples.325For all mass spectrometric techniques a mass spectrum (in case of single MS) or a product ion 326spectrum (in case of MS n) should be provided to justify the selection of the additional ions. 3272.10.2Confirmation by an independent analytical technique328Confirmation can also be achieved by an independent analytical method. The following are 329considered sufficiently independent confirmatory techniques:330•chromatographic principle different from the original method331• e.g. HPLC instead of GC332•different stationary phase and/or mobile phase with significantly different selectivity333•the following are not considered significantly different:334•in GC: stationary phases of 100 % dimethylsiloxane and of 95 % dimethylsiloxane 335+ 5 % phenylpolysiloxane336•in HPLC: C18- and C8-phases337•alternative detector338• e.g. GC-MS vs. GC-ECD, HPLC-MS vs. HPLC-UV/DAD339•derivatisation, if it was not the first choice method340•high resolution/accurate mass MS341•in mass spectrometry an ionisation technique that leads to primary ions with different m/z 342ratio than the primary method (e.g. ESI negative ions vs. positive ions)343It is preferred that confirmation data are generated with the same samples and extracts used 344for validation of the primary method.345The following validation data are required: calibration data (Section 2.9.1), recovery and 346precision data (Section 2.9.2) for samples fortified at the respective LOQ (n ≥ 3) and of a 347blank sample and proof of selectivity (Section 2.9.3).3482.11Independent laboratory validation (ILV)349A validation of the primary method in an independent laboratory (ILV) must be submitted for 350methods used for the determination of residues in plants, plant products, foodstuff (of plant 351and animal origin) and in feeding stuff. The ILV shall confirm the LOQ of the primary 352method, but at least the lowest action level (MRL).353The extent of independent validation required is given in detail in sections 3 and 4.354In order to ensure independence, the laboratory chosen to conduct the ILV trials must not 355have been involved in the method development and in its subsequent use. In case of multi-356residue methods it would be accepted if the ILV is performed in a laboratory that has already 357experience with the respective method.358The laboratory may be in the applicant’s organisation, but should not be in the same location. 359In the exceptional case that the lab chosen to conduct the ILV is in the same location, 360evidence must be provided that different personnel, as well as different instrumentation and 361stocks of chemicals etc have been used.362Any additions or modifications to the original method must be reported and justified. If the 363chosen laboratory requires communication with the developers of the method to carry out the 364analysis, this should be reported.3652.12Availability of standards366All analytical standard materials used in an analytical method must be commonly available. 367This applies to metabolites, derivatives (if preparation of derivatives is not a part of the 368method description), stable isotope labelled compounds or other internal standards.369If a standard is not commercially available the standard should be made generally available by 370the applicant and contact details be provided.3712.13Extraction Efficiency372The extraction procedures used in residue analytical methods for the determination of residues 373in plants, plant products, foodstuff (of plant and animal origin) and in feeding stuff should be 374verified for all matrix groups for which residues ≥ LOQ are expected, using samples with 375incurred residues from radio-labelled analytes.376Data or suitable samples may be available from pre-registration metabolism studies or 377rotational crop studies or from feeding studies. In cases where such samples are no longer 378available to validate an extraction procedure, it is possible to "bridge" between two solvent 379systems (details in [4]). The same applies if new matrices are to be included.3803Analytical methods for residues in plants, plant products, foodstuff (of 381plant origin), feedingstuff (of plant origin)382(Annex IIA Point 4.2.1 of Directive 91/414/EEC; Annex Point IIA, Point 3834.3 of OECD)3843.1Purpose385•Analysis of plants and plant products, and of foodstuff and feeding stuff of plant origin for 386compliance with MRL [3].3873.2Selection of analytes388The selection of analytes for which methods for food and feed are required depends upon the 389definition of the residue for which a maximum residue level (MRL) is set or is applied for 390according to Regulation (EC) No 396/2005.3913.3Commodities and Matrix Groups392Methods validated according to Section 2.9 and 2.10 must be submitted for representative 393commodities (also called “matrices” by analytical chemists) of all four matrix groups in 394Table 2.395396Table 2: Matrix groups and typical commoditiesMatrix group Examples for commoditiesbarley, rice, rye, wheat, dry legume vegetables dry commodities (high protein/highstarch content)commodities with high water content apples, bananas, cabbage, cherries, lettuce, peaches,peppers, tomatoescommodities with high oil content avocados, linseed, nuts, olives, rape seedcommodities with high acid content grapefruits, grapes, lemons, oranges397Important Note: This list of commodities is not a comprehensive list of commodities/matrices.398Applicants may consult regulatory authorities for advice on the use of other commodities.If samples with high water content are extracted at a controlled pH a particular method or 399validation for commodities with high acid content is not required.400Where a previously validated method has been adopted to a new matrix group, validation data 401must be submitted for representative matrices of this group.402。
rSAFE包说明说明书

Package‘rSAFE’October14,2022Title Surrogate-Assisted Feature ExtractionVersion0.1.4DescriptionProvides a model agnostic tool for white-box model trained on features extracted from a black-box model.For more information see:Gosiewska et al.(2020)<doi:10.1016/j.dss.2021.113556>. Depends R(>=3.5.0)License GPL-3Encoding UTF-8LazyData trueRoxygenNote7.2.1Imports DALEX,dendextend,ggplot2,ggpubr,grDevices,ingredients,sets,statsSuggests gbm,knitr,pander,randomForest,rmarkdown,spelling,testthat,vdiffrVignetteBuilder knitrURL https:///ModelOriented/rSAFEBugReports https:///ModelOriented/rSAFE/issuesLanguage en-USNeedsCompilation noAuthor Alicja Gosiewska[aut,cre],Anna Gierlak[aut],Przemyslaw Biecek[aut,ths],Michal Burdukiewicz[ctb](<https:///0000-0001-8926-582X>)Maintainer Alicja Gosiewska<*************************>Repository CRANDate/Publication2022-08-1313:20:02UTC12apartments R topics documented:apartments (2)HR_data (3)plot.safe_extractor (3)print.safe_extractor (4)safely_detect_changepoints (5)safely_detect_interactions (6)safely_select_variables (7)safely_transform_categorical (8)safely_transform_continuous (9)safely_transform_data (11)safe_extraction (12)Index14 apartments Apartments dataDescriptionDatasets apartments and apartmentsTest are artificial,generated from the same model.Structure of the dataset is copied from real dataset from PBImisc package,but they were generated in a way to mimic effect of Anscombe quartet for complex black box models.Usagedata(apartments)Formata data frame with1000rows and6columnsDetails•m2.price-price per square meter•surface-apartment area in square meters•no.rooms-number of rooms(correlated with surface)•district-district in which apartment is located,factor with10levels(Bemowo,Bielany,Moko-tow,Ochota,Praga,Srodmiescie,Ursus,Ursynow,Wola,Zoliborz)•floor-floor•construction.year-construction yearHR_data3HR_data Why are our best and most experienced employees leaving prema-turely?DescriptionA dataset from Kaggle competition Human Resources Analytics.https:/// FormatA data frame with14999rows and10variablesDetails•satisfaction_level Level of satisfaction(0-1)•last_evaluation Time since last performance evaluation(in Years)•number_project Number of projects completed while at work•average_monthly_hours Average monthly hours at workplace•time_spend_company Number of years spent in the company•work_accident Whether the employee had a workplace accident•left Whether the employee left the workplace or not(1or0)Factor•promotion_last_5years Whether the employee was promoted in the lastfive years•sales Department in which they work for•salary Relative level of salary(high)SourceDataset HR-analytics from https://plot.safe_extractor Plotting Transformations of the SAFE Extractor ObjectDescriptionPlotting Transformations of the SAFE Extractor ObjectUsage##S3method for class safe_extractorplot(x,...,variable=NULL)4print.safe_extractor Argumentsx safe_extractor object containing information about variables transformations cre-ated with safe_extraction()function...other parametersvariable character,name of the variable to be plottedValuea plot objectprint.safe_extractor Printing Summary of the SAFE Extractor ObjectDescriptionPrinting Summary of the SAFE Extractor ObjectUsage##S3method for class safe_extractorprint(x,...,variable=NULL)Argumentsx safe_extractor object containing information about variables transformations cre-ated with safe_extraction()function...other parametersvariable character,name of the variable to be plotted.If this argument is not specified then transformations for all variables are printedValueNo return value,prints the structure of the objectsafely_detect_changepoints5 safely_detect_changepointsIdentifying Changes in a Series Using PELT AlgorithmDescriptionThe safely_detect_changepoints()function calculates the optimal positioning and number of change-points for given data and penalty.It uses a PELT algorithm with a nonparametric cost function based on the empirical distribution.The implementation is inspired by the code available on https:///rkillick/changepoint.Usagesafely_detect_changepoints(data,penalty="MBIC",nquantiles=10)Argumentsdata a vector within which you wish tofind changepointspenalty penalty for introducing another changepoint,one of"AIC","BIC","SIC","MBIC", "Hannan-Quinn"or numeric non-negative valuenquantiles the number of quantiles used in integral approximationValuea vector of optimal changepoint positions(last observations of each segment)See Alsosafely_transform_continuousExampleslibrary(rSAFE)data<-rep(c(2,7),each=4)safely_detect_changepoints(data)set.seed(123)data<-c(rnorm(15,0),rnorm(20,2),rnorm(30,8))safely_detect_changepoints(data)safely_detect_changepoints(data,penalty=25)6safely_detect_interactions safely_detect_interactionsDetecting Interactions via Permutation ApproachDescriptionThe safely_detect_interactions()function detects second-order interactions based on predictions made by a surrogate model.For each pair of features it performs values permutation in order to evaluate their non_additive effect.Usagesafely_detect_interactions(explainer,inter_param=0.5,inter_threshold=0.5,verbose=TRUE)Argumentsexplainer DALEX explainer created with explain()functioninter_param numeric,a positive value indicating which of single observation non-additive effects are to be regarded as significant,the higher value the higher non-additiveeffect has to be to be taken into accountinter_thresholdnumeric,a value from[0,1]interval indicating which interactions should be re-turned as significant.It corresponds to the percentage of observations for whichinteraction measure is greater than inter_param-if this percentage is less thaninter_threshold then interaction effect is ignored.verbose logical,if progress bar is to be printedValuedataframe object containing interactions effects greater than or equal to the specified inter_threshold See Alsosafe_extractionExampleslibrary(DALEX)library(randomForest)library(rSAFE)safely_select_variables7 data<-apartments[1:500,]set.seed(111)model_rf<-randomForest(m2.price~construction.year+surface+floor+no.rooms+district,data=data)explainer_rf<-explain(model_rf,data=data[,2:6],y=data[,1])safely_detect_interactions(explainer_rf,inter_param=0.25,inter_threshold=0.2,verbose=TRUE)safely_select_variablesPerforming Feature Selection on the Dataset with Transformed Vari-ablesDescriptionThe safely_select_variables()function selects variables from dataset returned by safely_transform_data() function.For each original variable exactly one variable is chosen•either original one or transformed one.The choice is based on the AIC value for linear model(regression)or logistic regression(classification).Usagesafely_select_variables(safe_extractor,data,y=NULL,which_y=NULL,class_pred=NULL,verbose=TRUE)Argumentssafe_extractor object containing information about variables transformations created with safe_extraction() functiondata data,original dataset or the one returned by safely_transform_data()function.Ifdata do not contain transformed variables then transformation is done inside thisfunction using’safe_extractor’argument.Data may contain response variable ornot-if it does then’which_y’argument must be given,otherwise’y’argumentshould be provided.y vector of responses,must be given if data does not contain itwhich_y numeric or character(optional),must be given if data contains response valuesclass_pred numeric or character,used only in multi-classification problems.If responsevector has more than two levels,then’class_pred’should indicate the class ofinterest which will denote failure-all other classes will stand for success.verbose logical,if progress bar is to be printed8safely_transform_categorical Valuevector of variables names,selected based on AIC valuesSee Alsosafely_transform_dataExampleslibrary(DALEX)library(randomForest)library(rSAFE)data<-apartments[1:500,]set.seed(111)model_rf<-randomForest(m2.price~construction.year+surface+floor+no.rooms+district,data=data)explainer_rf<-explain(model_rf,data=data[,2:6],y=data[,1])safe_extractor<-safe_extraction(explainer_rf,verbose=FALSE)safely_select_variables(safe_extractor,data,which_y="m2.price",verbose=FALSE)safely_transform_categoricalCalculating a Transformation of Categorical Feature Using Hierar-chical ClusteringDescriptionThe safely_transform_categorical()function calculates a transformation function for the categorical variable using predictions obtained from black box model and hierarchical clustering.The gap statistic criterion is used to determine the optimal number of clusters.Usagesafely_transform_categorical(explainer,variable,method="complete",B=500,collapse="_")Argumentsexplainer DALEX explainer created with explain()functionvariable a feature for which the transformation function is to be computedmethod the agglomeration method to be used in hierarchical clustering,one of:"ward.D", "ward.D2","single","complete","average","mcquitty","median","centroid"B number of reference datasets used to calculate gap statisticscollapse a character string to separate original levels while combining them to the new oneValuelist of information on the transformation of given variableSee Alsosafe_extractionExampleslibrary(DALEX)library(randomForest)library(rSAFE)data<-apartments[1:500,]set.seed(111)model_rf<-randomForest(m2.price~construction.year+surface+floor+no.rooms+district,data=data)explainer_rf<-explain(model_rf,data=data[,2:6],y=data[,1])safely_transform_categorical(explainer_rf,"district")safely_transform_continuousCalculating a Transformation of a Continuous Feature UsingPDP/ALE PlotDescriptionThe safely_transform_continuous()function calculates a transformation function for the continuous variable using a PD/ALE plot obtained from black box model.Usagesafely_transform_continuous(explainer,variable,response_type="ale",grid_points=50,N=200,penalty="MBIC",nquantiles=10,no_segments=2)Argumentsexplainer DALEX explainer created with explain()functionvariable a feature for which the transformation function is to be computedresponse_type character,type of response to be calculated,one of:"pdp","ale".If features are uncorrelated,one can use"pdp"type-otherwise"ale"is strongly recommended.grid_points number of points on x-axis used for creating the PD/ALE plot,default50N number of observations from the dataset used for creating the PD/ALE plot, default200penalty penalty for introducing another changepoint,one of"AIC","BIC","SIC","MBIC", "Hannan-Quinn"or numeric non-negative valuenquantiles the number of quantiles used in integral approximationno_segments numeric,a number of segments variable is to be divided into in case of founding no breakpointsValuelist of information on the transformation of given variableSee Alsosafe_extraction,safely_detect_changepointsExampleslibrary(DALEX)library(randomForest)library(rSAFE)data<-apartments[1:500,]set.seed(111)model_rf<-randomForest(m2.price~construction.year+surface+floor+no.rooms+district,data=data)explainer_rf<-explain(model_rf,data=data[,2:6],y=data[,1])safely_transform_continuous(explainer_rf,"construction.year")safely_transform_data11safely_transform_data Performing Transformations on All Features in the DatasetDescriptionThe safely_transform_data()function creates new variables in dataset using safe_extractor object.Usagesafely_transform_data(safe_extractor,data,verbose=TRUE)Argumentssafe_extractor object containing information about variables transformations created with safe_extraction() functiondata data for which features are to be transformedverbose logical,if progress bar is to be printedValuedata with extra columns containing newly created variablesSee Alsosafe_extraction,safely_select_variablesExampleslibrary(DALEX)library(randomForest)library(rSAFE)data<-apartments[1:500,]set.seed(111)model_rf<-randomForest(m2.price~construction.year+surface+floor+no.rooms+district,data=data)explainer_rf<-explain(model_rf,data=data[,2:6],y=data[,1])safe_extractor<-safe_extraction(explainer_rf,verbose=FALSE)safely_transform_data(safe_extractor,data,verbose=FALSE)safe_extraction Creating SAFE Extractor-an Object Used for Surrogate-AssistedFeature ExtractionDescriptionThe safe_extraction()function creates a SAFE-extractor object which may be used later for surro-gate feature extraction.Usagesafe_extraction(explainer,response_type="ale",grid_points=50,N=200,penalty="MBIC",nquantiles=10,no_segments=2,method="complete",B=500,collapse="_",interactions=FALSE,inter_param=0.25,inter_threshold=0.25,verbose=TRUE)Argumentsexplainer DALEX explainer created with explain()functionresponse_type character,type of response to be calculated,one of:"pdp","ale".If features are uncorrelated,one can use"pdp"type-otherwise"ale"is strongly recommended.grid_points number of points on x-axis used for creating the PD/ALE plot,default50N number of observations from the dataset used for creating the PD/ALE plot, default200penalty penalty for introducing another changepoint,one of"AIC","BIC","SIC","MBIC", "Hannan-Quinn"or numeric non-negative valuenquantiles the number of quantiles used in integral approximationno_segments numeric,a number of segments variable is to be divided into in case of founding no breakpointsmethod the agglomeration method to be used in hierarchical clustering,one of:"ward.D", "ward.D2","single","complete","average","mcquitty","median","centroid"B number of reference datasets used to calculate gap statisticscollapse a character string to separate original levels while combining them to the newoneinteractions logical,if interactions between variables are to be taken into accountinter_param numeric,a positive value indicating which of single observation non-additiveeffects are to be regarded as significant,the higher value the higher non-additiveeffect has to be to be taken into accountinter_thresholdnumeric,a value from[0,1]interval indicating which interactions should be re-turned as significant.It corresponds to the percentage of observations for whichinteraction measure is greater than inter_param-if this percentage is less thaninter_threshold then interaction effect is ignored.verbose logical,if progress bar is to be printedValuesafe_extractor object containing information about variables transformationSee Alsosafely_transform_categorical,safely_transform_continuous,safely_detect_interactions, safely_transform_dataExampleslibrary(DALEX)library(randomForest)library(rSAFE)data<-apartments[1:500,]set.seed(111)model_rf<-randomForest(m2.price~construction.year+surface+floor+no.rooms+district,data=data)explainer_rf<-explain(model_rf,data=data[,2:6],y=data[,1],verbose=FALSE)safe_extractor<-safe_extraction(explainer_rf,grid_points=30,N=100,verbose=FALSE) print(safe_extractor)plot(safe_extractor,variable="construction.year")Index∗apartmentsapartments,2∗datasetsHR_data,3apartments,2apartmentsTest(apartments),2HR_data,3plot.safe_extractor,3print.safe_extractor,4safe_extraction,6,9–11,12safely_detect_changepoints,5,10safely_detect_interactions,6,13safely_select_variables,7,11safely_transform_categorical,8,13safely_transform_continuous,5,9,13safely_transform_data,8,11,1314。
K-ROSET机器人模拟器应用说明书
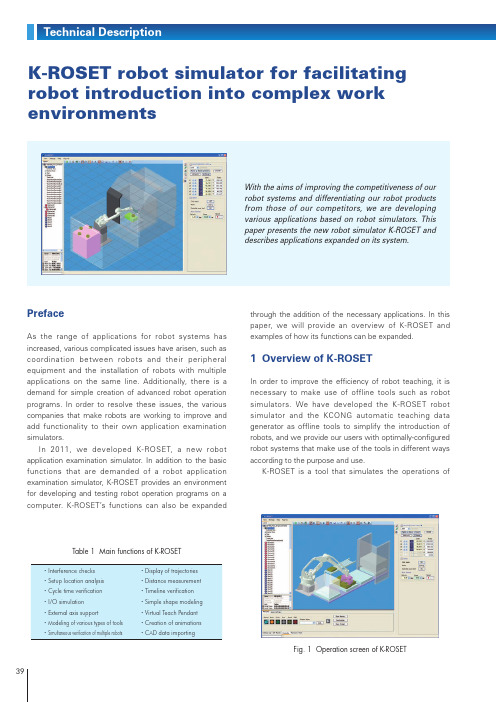
With the aims of improving the competitiveness of our robot systems and differentiating our robot products from those of our competitors, we are developing various applications based on robot simulators. This paper presents the new robot simulator K-ROSET and describes applications expanded on its system.K-ROSET robot simulator for facilitating robot introduction into complex work environmentsPrefaceAs the range of applications for robot systems has increased, various complicated issues have arisen, such as coordination between robots and their peripheral equipment and the installation of robots with multiple applications on the same line. Additionally, there is a demand for simple creation of advanced robot operation programs. In order to resolve these issues, the various companies that make robots are working to improve and add functionality to their own application examination simulators.In 2011, we developed K-ROSET, a new robot application examination simulator. In addition to the basic functions that are demanded of a robot application examination simulator, K-ROSET provides an environment for developing and testing robot operation programs on a computer. K-ROSET’s functions can also be expandedthrough the addition of the necessary applications. In this paper, we will provide an overview of K-ROSET and examples of how its functions can be expanded.1 O verview of K-ROSETIn order to improve the efficiency of robot teaching, it is necessary to make use of offline tools such as robot simulators. We have developed the K-ROSET robot simulator and the KCONG automatic teaching data generator as offline tools to simplify the introduction of robots, and we provide our users with optimally-configured robot systems that make use of the tools in different ways according to the purpose and use.K-ROSET is a tool that simulates the operations ofFig. 1 Operation screen of K-ROSETTable 1 Main functions of K-ROSETactual robots on a computer. It enables operating robots using the same methods, and executing operation plans using the same logic, as with the actual robots. Furthermore, by adding necessary applications, it is possible to automate the actual work of robot teaching, eliminating teaching work based on experiences and trial and error that used to be performed by humans.The main functions of K-ROSET are shown in Table 1, while its operation screen is shown in Fig. 1.(1) StructureWith K-ROSET, we have improved operability by adopting a software structure that integrates 3D rendering software with high processing speed and low memory requirements, complete with an operating interface that is conveniently laid out around it. By placing the robots, workpieces, teaching points, etc. on the screen, the operator can intuitively generate an operation program for the robot and simulate an actual system on the computer.(2) ApplicationsActual robot systems can be used for a wide variety of tasks that include handling, arc welding and painting, and on K-ROSET, simulations can be performed separately by application (Fig. 2). It is also possible to simulate robot systems in which robots with different applications (such as arc welding and handling, or handling and sealing) are installed simultaneously (Fig. 3).Handling robot Sealing robotSealing robotHandling robotFig. 3 Simulation example of multiple applications(a) Arc welding(b) Spot weldingFig. 2 Simulation examples of applicable targets2 C haracteristics of K-ROSETWith complex robot systems that include multiple robots or things like external axes, conveyors and peripheral equipment, it is vital to be able to study the operation without using the actual robots and equipment. When doing so, making use of the following robot simulator functions can be expected to have the benefits shown in Table 2during the various steps of introducing manufacturing equipment.①L ayout examination②C reation and verification of robot operation programs③C ycle-time verificationThe parts of K-ROSET that compute robot operations make use of the same operation software that is used in robot controllers. Additionally, because its simulation speed is several times faster than the operation speed of actual robots, it can carry out high-precision and high-speed computation of cycle time.Making use of K-ROSET’s functions eliminates the trouble of guiding the robot into a proper position through manual operation, making it possible to reduce teaching time. For example, it is possible to click on a workpiece on the screen to create a teaching point in that location and drag and drop that teaching point into the program area (the edit screen area) to create an operationinstruction.Table 2 Merits of robot simulatorsDisplay of painting operationsCoordinate system ofeach teaching pointFig. 4 Simulation example of teaching points creationFig. 5 Simulation example of real applicationFig. 4 shows an example in which teaching points have been created for a workpiece, while an example of operation based on the teaching points created is shown in Fig. 5. The operation trajectory of the robot tool tip is shown in Fig. 5.3 E xamples of customizationWith K-ROSET, users can create their own operation interfaces, expand functionality and otherwise customize the program (using plugins). In addition to using K-ROSET’s main simulation function, it is possible to use new functions and custom functions along with K-ROSET.Actual examples of additional applications that have been developed using customization functions are given below.( i ) CS-Configurator (Fig. 6)Parameters for the safety monitoring unit can be set easily based on visual representation. For example, a 3D display enables intuitive configuration of the monitoring space. (ii) K-SPARC (Fig. 7)Palletization patterns are automatically generated by K-SPARC, and K-ROSET is used to arrange robots and equipment. Additionally, the operation program can be run to confirm the loading operation.(iii) Interference prediction function (Fig. 8)When changing programs after robot installation, connecting to this function online makes it possible to predict interference between robots, workpieces and surrounding equipment during operation and to easily check the locations of predicted interference using a 3Ddisplay, preventing interference before it occurs.Fig. 8 Example of interference prediction functionFig. 6 Example of CS-Configurator setting screenFig. 7 Example of K-SPARC setting screen(iv) Electrical consumption simulation function (Fig. 9)This function can be used to run a robot operation program on K-ROSET, estimate the current and power used during operation, and display the results in tabular format. (v) Picking robot simulation (K-PET)In recent years, the use of robots in consumer products industries such as food, drugs and cosmetics has expanded rapidly, and it is particularly common to use them in combination with vision systems for the high-speed transfer of small-item workpieces. Quick verification of a robot’s transfer ability is one of the keys to the expansion into these markets. Because of this, we are working to develop systems that are specialized for this kind of application and can carry out setup and simulation in a more simplified manner. K-PET, a specialized tool for the computer simulation of picKstar, a high-speed picking robot developed by Kawasaki, is shown in Fig. 10. K-PET features a menu that can be used to easily set up feed and discharge conveyors, feeding and discharge methods for the workpiece in question, etc. Additionally, it makes iteasy to determine how multiple picKstar units will be arranged.4 L inkage with other applications(1) Linkage with vision systemsLinking K-ROSET with other applications makes it possible to carry out more advanced application verifications. Development is now underway for a simulation function that combines K-ROSET with K-VFinder, a 2D visual recognition system that is used with products such as picKstar. Doing so will make it possible to simultaneously carry out studies of vision system installation on a computer and operation verification of robots that are combined with vision systems.An example of a linkage with a vision system is shown in Fig. 11. The workpiece information generated by K-ROSET on the left side of the screen is sent to K-VFinder on the right side, and a simulation is carried out as if the workpiece had been recognized with an actual camera.Fig. 9 Example of power consumption simulationFig. 10 Example of K-PET setting screenWorkpieceFig. 11 Example of K-ROSET and K-VFinder(2) Linkage with automatic teaching systemsThe KCONG software for automatic teaching data generator comes with a built-in 3D CAD program, and K-ROSET uses the same 3D CAD program so that it can be linked with KCONG. We have thus enabled linking data between the two systems to merge the application study function (including peripheral equipment) of K-ROSET with KCONG’s function for automatically generating teaching data based on 3D workpiece data.Figure 12 shows this linkage. KCONG automatically generates teaching points based on the data for the system layout created using K-ROSET. Additionally, the data created is given to K-ROSET for operation verification.Concluding remarksWe do not simply develop tools for robot application study and simulation. We are also working to make use of robot simulation technology as a tool to differentiate our robot systems.We intend to continue to differentiate ourselves from other companies through the development of offline study systems and a range of other applications, in order to provide our customers with more desirable and effective robot systems.Shogo HasegawaFA System Department,FA and Clean Group,Robot Division,Precision Machinery CompanyMasayuki WatanabeFA System Department,FA and Clean Group,Robot Division,Precision Machinery CompanyTakayuki YoshimuraFA System Department,FA and Clean Group,Robot Division,Precision Machinery CompanyHiroki KinoshitaControl System Department,System Technology Development Center,Corporate Technology DivisionProfessional Engineer (Information Engineering)Fumihiro HondaNew Energy and Industrial Technology Development OrganizationHironobu UrabeIT System Department,System Development Division,Kawasaki Technology Co., Ltd.KCONG screenFig. 12 Example of K-ROSET and KCONG。
TopWorx 智能阀门控制解决方案说明书

2D-Series, DXP, DXR & DXSDXP TropicalizedAluminumDXR Composite Resin("S" SiliconeO-Rings only;Stainless steelconduit entries)(Area Classification"0" only available withATEX/IECEx approv-als)DXS316Stainless steel (Onlyavailable with R & Mshaft options) Bus NetworkAS AS-Interface w(2) SPDT GOSwitches(Area class cannot be 0)*FF FoundationFieldbus w/ 0 -10K Pot*FL Foundation Fieldbus w/(2)SPDT GO Switches*FP Foundation Fieldbus w/(2)SPDT GO Switches and0-10K PotDN DeviceNet w(2) SPDTGO Switches(Area class cannot be 0)PB Profibus w/(2) SPDT GOSwitches (Area class cannotbe 0)Partial Stroke TestES ESD/PSTModule w/GO Switch(Area class cannot be 0)GO SwitchesL2 (2)GO SwitchesSPDT hermetic sealL4 (4)GO SwitchesSPDT hermetic seal(not available with pilot)Z2 (2)GO SwitchesDPDT hermetic sealZ4 (4)GO SwitchesDPDT hermetic seal, (notavailable with pilot)Mechanical Switches(Area class cannot be 2, DXR withG approval not available with pilot)M2 (2)Mech SPDTM4 (4)Mech SPDTM6 (6)Mech SPDTT2 (2)Mech DPDTK2 (2)Mech SPDTgold contactsK4 (4)Mech SPDTgold contactsProximity SwitchesR2 (2) SPDT Prox switchesR4 (4) SPDT Prox switches(R2 & R4 only available withDXR and Ex me certification)Inductive SensorsE2 (2) p+f NJ2-V3-Ninductive NAMURE4 (4) p+f NJ2-V3-Ninductive NAMURAnalog Output(Available with 2-switchoptions only for L,Z,M,K,E,T)_X 4-20mAtransmitter_H 4-20mAtransmitter with HART(Not available with switchoption T; LH not availablew/pilot valve) (LH, ZH Notavailable with DXR)Example:LH =(2) GO Switcheswith HART™ transmitter* *FF, *FL and *FP with AreaClassification "0" has an ibprotection0Intrinsically safe(Bus/sensor cannot beAS, DN, ES, PB, or _X;Requires appropriateI.S. barrier)- North AmericaClass I Div 1&2Groups A, B, C, DType 4, 4X- ATEX/IECExZone 0II2GD, T6/T4Ex ia IICEx tb IIIC, IP66/67(Foundation Fieldbus)Zone 1, Ex ib IIC T4, IP671 Explosion proof /Flame proof (DXP/S only)- North AmericaClass I Div 1Groups C, D;Class I Div 2,Groups A, B, C, D.(Groups A & B must behermetically sealed)Type 4, 4X,- ATEX/IECExZone 1II2G, II2GD, T6/T4/T3Ex d IIB+H2Ex tb IIIC IP66/67(O-Rings must be S forDUST certification)2Non-incendive(Bus/sensor must beL, Z, P, E, AS, FF,_X, _H, _Eor DN)- North AmericaClass I Div 2Groups A, B, C, D;Class II Div 2Groups F,G- ATEX (DXP/S only)II3G Ex nA nC tb, IP66/67(O-Rings must be S forDUST certification)G General Purpose Type 4, 4X(not available with DXR withmechanical switches)C Flameproof(DXS not available withvalve; Conduit entries mustbe E or M) ATEX/IECExII2G, II2GD, T6/T4/T3Ex d IICEx tb IIIC IP66/67M Flameproof (only availablewith R2 and R4 sensoroptions) (DXR only)ATEX/IECEx Zone 1, II2GDEx e mb IIC T4, Ex tb IIICT66 IP67 (Not available w/pilot)W No approvals; Type 4, 4XIP66/683 way, 180OT Port 3 positionOrdering Guide Fill in the boxes to create your 'ordering number.'3BlankNo Spool Valve A AluminumHard coat anodized(IP65)6 316 Stainless steel (IP65)BlankNo Spool Valve 2 .86 Cv (1/4" NPT Ports)3 3.7 Cv (1/2" NPT Ports) (For manual override consult factory) (Spool Valve A)(Spool Valve 6)BlankNo override1 Single Pushbutton Momentary/Latching2 Dual Pushbutton Momentary/LatchingT Partial stroke test button with lockable cover (Sensor ES only) (Not avail w/ Area Class C) (DXP/S - Conduit Entries 4 or 3 only. DXR - consult factory)Pneumatic AccessoriesFlow Control, 1/8" NPT (1 per kit) AL-M20Flow Control, 1/4" NPT (1 per kit) AL-M21 Flow Control, 1/2" NPT (1 per kit) AL-M22 Exhaust Protectors, 1/4" NPT (2 per kit) AL-M32 Exhaust Protectors, 1/2" NPT (2 per kit) AL-M33Miscellaneous TopWorx Demo CaseATK2(In cludes Valvetop DXP , TXP , TVA, cutaway GO Switch models 20, 35, & 70, and accessories)ESD Demo Case ATK-ESD(Includes working DXP-ES1GN4B1A2T mounted to rack and pinion actuator with control box)BlankNo Regional Cert B InMetro (Area Class 0,1 and C only)N NEPSI F FISCO(Bus/Sensor must be FF; Area Class must be 0)K KOSHA(DXP/S only) (Area class 1 or C)R EAC (DXP/S only)(O-Rings must be B or S, B= Gas Approved;S = Gas/Dust Approved) A ANZEx Ex d IIC, Ex d IIB+H2 (DXP/S only) P PESO (India) (Gas approval only)。
PacBio SEQUELII 准备 HiFi SMRTbell 库说明书

Procedure & Checklist – Preparing HiFi SMRTbell®Libraries using the SMRTbell Express Template Prep Kit 2.0This procedure describes the construction of HiFi SMRTbell libraries for de novo assembly and variant detection applications using the SMRTbell Express Template Prep Kit 2.0 and recommended HiFi sequencing conditions using PacBio’s new Sequel® II Binding Kit 2.2. A minimum input amount of 5 µg of high-molecular weight genomic DNA is recommended for generating HiFi library yields sufficient for running multiple SMRT®Cells on the Sequel II or Sequel IIe System (Sequel II Systems). Note that final HiFi library construction yields will be dependent on the specific size-selection method employed.We recommend fragmenting the gDNA so that the target size distribution mode is between 15 kb - 18 kb. To reduce the presence of fragments >30 kb, PacBio recommends a 2-cycle shearing method on the Megaruptor 3 system. Generally, a narrower fragment size distribution results in more uniform and higher-quality HiFi data. Details regarding DNA shearing conditions (e.g., buffers and DNA sample concentration) are described in the “DNA Requirements for Shearing” section.RequiredEquipment Vendor Throughput Run TimeFemto Pulse AgilentTechnologies Process up to 11 samples per runBatch process up to 88 samples 85 minsMegaruptor 3 Diagenode Shear up to 8 samples at a time40 mins(for 1 cycle of shearing)PippinHT Sage Science Maximum of 20 samples per instrument run 2 hrsBluePippin Sage Science Maximum of 4 samples per instrument run 4.5 hrsSageELF Sage Science Maximum of 2 samples per instrument run 4.5 hrs Table 1: Recommended equipment for HiFi SMRTbell library construction for de novo assembly and variant detection applications.Required MaterialsDNA SizingFemto Pulse Agilent Technologies, Inc. P-0003-0817DNA QuantitationQubit™ Fluorometer ThermoFisher Scientific Q33238Qubit 1X dsDNA HS Assay Kit ThermoFisher Scientific Q33230DNA ShearingMegaruptor 3 System Diagenode B06010003Megaruptor 3 Shearing Kit Diagenode E07010003SMRTbell Library PreparationSMRTbell® Express Template Prep Kit 2.0 PacBio 100-938-900AMPure® PB Beads PacBio 100-265-900SMRTbell® Enzyme Clean Up Kit 2.0 (New*) PacBio 101-932-600Sequencing Primer v5 (New*) PacBio 102-067-400100% Ethanol, Molecular Biology Grade Any MLSWide Orifice Tips (Tips LTS W-O 200UL Fltr RT-L200WFLR) Rainin 30389241Lo-Bind 0.2 mL tube strips USA Scientific, TempAssure1402-4708Multi-channel Pipette Rainin, 17013810Magnetic separation rack V&P Scientific, Inc, VP 772F4-1Thermal Cycler that is 100 µL and 8-tube strip compatible Any MLSSize-selection (One of the following systems)PippinHT System Sage Science HTP00010.75% Agarose Gel Cassettes, Marker 75E Sage Science HPE7510BluePippin System Sage Science BLU00010.75% Agarose Cassettes, Marker S1 Sage Sciences BLF7510SageELF System Sage Science ELF00010.75% Agarose Cassettes Sage Science ELD7510SequencingSequel® II Binding Kit 2.2 (New*)PacBio 101-894-200Sequel® II Sequencing Kit 2.0 PacBio 101-820-200SMRT® Cell 8M Tray PacBio 101-389-001* To obtain a copy of the previous version of this Procedure & Checklist that specifies use of SMRTbell Enzyme Clean Up Kit (PN 101-746-400) and Sequencing Primer v2 (PN 101-847-900), contact ****************.HiFi Library Construction WorkflowPacBio recommends that gDNA samples be resuspended in an appropriate buffer (e.g., Qiagen Elution Buffer) before proceeding with DNA shearing.Figure 1: Workflow for preparing HiFi libraries using the SMRTbell Express Template Prep Kit 2.0.Reagent HandlingSeveral reagents in the SMRTbell Express Template Prep Kit 2.0 (shown in Table 2 below) are sensitive to temperature and vortexing. We recommend to:•Never leave reagents at room temperature.•Always work on ice when preparing master mixes.•Finger-tap followed by a quick spin prior to use.Reagent Where UsedDNA Prep Additive Remove single-strand overhangsDNA Prep Enzyme Remove single-strand overhangs DNA Damage Repair Mix v2 DNA Damage RepairEnd Prep Mix End-Repair/A-tailingOverhang Adapter v3 LigationLigation Mix LigationLigation Additive LigationLigation Enhancer LigationSMRTbell Enzyme Clean Up Mix Nuclease TreatmentSMRTbell Enzyme Cleanup Buffer 2.0 Nuclease TreatmentTable 2: Temperature sensitive reagentsGenomic DNA (gDNA) Quality EvaluationThis procedure requires high-quality, high-molecular weight input gDNA with a majority of the DNA fragments >50 kb as determined by pulsed-field gel or capillary electrophoresis. Any of the three commercially available systems listed in Table 4 below may be used to evaluate gDNA quality, but the Femto Pulse system is highly recommended for high-throughput library construction due to its ability to rapidly process multiple samples in a single run using very low amounts (<1 ng) of DNA per sample. Links to recommended procedures for each system are also provided in the table. Examples of gDNA quality assessment using Bio-Rad’s CHEF Mapper (2A) and Agilent Technologies’ Femto Pulse (2B) are shown in Figure 2. Lanes A3 and B1 correspond to high-quality gDNA samples that are suitable for HiFi library construction using this procedure. Lanes A4 and B2 show degraded gDNA samples that not suitable for use in this procedure.Method ProcedureFemto Pulse Agilent Technologies, Inc.Bio-Rad CHEF Mapper XA Pulsed Field Electrophoresis System Procedure & Checklist - Using the BIO-RAD® CHEF Mapper® XA Pulsed Field Electrophoresis SystemSage Science Pippin Pulse Procedure & Checklist - Using the Sage Science PippinPulse Electrophoresis Power Supply SystemTable 3. gDNA Quality Evaluation Methods and Procedures.Figure 2: Evaluation of high-molecular weight gDNA quality using two DNA sizing analysis systems. A) Bio-Rad CHEF Mapper and B) Agilent Technologies’ Femto Pulse.165.510 kb 50 kb 42 kb33 kb 21 kb 17.7 kb 1.3 kb1 bpLane 1: 8 kb - 48 kb Ladder (Bio-Rad) Lane 2: 5 kb ladder (Bio-Rad) Lane 3: HMW gDNA Lane 4: Degraded gDNALane 1: HMW gDNALane 2: Degraded gDNA Lane 3: 165 kb ladder48 kb-20 kb-80 kb----------10 kb-14322 1 3ABDNA Requirements for ShearingBefore shearing, ensure that the genomic DNA is in an appropriate buffer (e.g.,Qiagen Elution Buffer, 10 mM Tris-Cl, pH 8.5 or PacBio EB buffer). If you are unsure of the buffer composition or if the gDNA is not in Elution Buffer, perform a 1X AMPure PB bead purification followed by elution with Elution Buffer or an equivalent low salt buffer (i.e., 10 mM Tris-Cl, pH 8.5- 9.0).PacBio highly recommends Diagenode’s Megaruptor 3 system for shearing gDNA. The Megaruptor 3 system allows up to 8 gDNA samples to be processed simultaneously with a consistent fragment size distribution across multiple hydropore-syringes. Furthermore, the Megaruptor 3 system generates a narrower size distribution than the g-TUBE device (Covaris).Shearing Using Diagenode’s Megaruptor 3 SystemTo maximize HiFi yield per SMRT Cell, PacBio recommends fragmenting the gDNA to a size distribution mode between 15 kb – 18 kb for human whole genome sequencing. Libraries with a size distribution mode larger than 20 kb are not recommended for HiFi sequencing. Recommended library insert size distributions to use for different WGS applications are summarized in Table 4 below.Application Recommended Library Insert SizeHuman Variant Detection 15 – 18 kbHuman de Novo15 – 18 kbPlant/Animal de Novo15 – 20 kbTable 4: Library size recommendations for Human variant detection and de novo assembly.To shear gDNA on the Megaruptor 3 system, use a two-cycle shear method, which requires running a second round of shearing immediately following the first fragmentation step in the same hydropore-syringe. The recommended concentration is 83.3 ng/µL (5 µg of input DNA in 60 µL Elution Buffer).The DNA shearing guidelines below have been tested by PacBio on the Megaruptor 3 system only. The response of individual gDNA samples to the shearing recommendations described below may differ; therefore, performing a small-scale test shear is highly recommended, including the Megaruptor 3 system.For the Megaruptor and Megaruptor 2 systems, shearing optimization is necessary before proceeding with this Procedure & Checklist. The shearing procedure described in the “Shearing Using Diagenode’s Megaruptor 3 system” section below is not compatible with the Megaruptor or Megaruptor 2 systems. For Megaruptor and Megaruptor 2 systems, follow Diagenode’s DNA shearing recommendations described in their manual. For additional guidance, contact Technical Support or your local FAS.The g-TUBE device generates a broader DNA fragment size-distribution compared to the Megaruptor 3 system. Note that HiFi read quality and overall HiFi data yield may be reduced due to the residual presence of large DNA fragments generated by g-TUBEs. For additional guidance, contact Technical Support or your local FAS.Figure 3: Examples of human genomic DNA samples sheared to a target 15 kb - 18 kb size distribution mode using a 2-cycle shear method on the Megaruptor 3 system.Prepare SMRTbell LibrariesAlways work on ice throughout the library construction process. To process multiple samples at a time, the following equipment are required:• Lo-Bind tube strips• Multi-channel pipette• Wide-bore tips• Magnetic rack compatible with tube strips• Thermocycler compatible with tube stripsRemove Single-Strand OverhangsThe sample volume recovered from the Megaruptor 3 system after shearing is used directly in the single-strand overhang digestion step. Before proceeding, ensure that the sheared DNA is in Elution Buffer or an equivalent low salt buffer (i.e., 10 mM Tris-Cl, pH 8.5- 9.0). In this step, DNA Prep Additive is diluted first followed by digestion. Scale up the reaction volumes for digestion if working with multiple samples.1. Prepare the DNA Prep Additive. The DNA Prep Additive is diluted with Enzyme Dilution Buffer toa total volume of 5 µL. This amount is sufficient for processing 1 to 4 samples. The volume maynot be sufficient for 5 samples due to pipetting errors. We recommend scaling up the dilutionvolume based on the number of samples to be processed (example: prepare 2X volume for 8samples and 4X volume for 16 samples).Note: The diluted DNA Prep Additive should be used immediately and should not be stored.2. Prepare the digestion by following the reaction table below. For multiple samples, prepare amaster mix, followed by addition of 10.0μL master mix to each sheared DNA sample.3. Add 10.0 µL of the above master mix to the tube-strips containing 45.0 µL - 53.0 µL of shearedDNA. The total volume in this step is 55.0 µL - 63.0 µL.4. Using a multi-channel pipette, mix the reaction wells by pipetting up and down 10 times with wide-orifice pipette tips.5. Spin down the contents of the tube strips with a quick spin in a microfuge.6. Incubate at 37°C for 15 minutes, then return the reaction to 4°C.7. Proceed to the next step.Repair DNA DamageTo each Reaction Mix 1, add 2.0 µL of DNA Damage Repair Mix v2.1. Mix the reaction well by pipetting up and down 10 times with wide-orifice pipette tips.2. Spin down the contents of the tube strips with a quick spin in a microfuge.3. Incubate at 37°C for 30 minutes, then return the reaction to 4°C.4. Proceed to the next step.End-Repair/A-tailingTo each Reaction Mix 2, add 3.0 µL of End Prep Mix.1. Mix the reaction well by pipetting up and down 10 times with wide-orifice pipette tips.2. Spin down the contents of the tube strips with a quick spin in a microfuge.3. Incubate at 20°C for 10 minutes.4. Incubate at 65°C for 30 minutes, then return the reaction to 4°C.5. Proceed to the next step.Adapter LigationIn this step, 5.0 µL of Overhang Adapter is added to each Reaction Mix 3 (from the previous step). Then, 32.0 µL of the ligase master mix is added to each Reaction Mix 3/Adapter Mix for incubation. Always work on ice. 1. To each Reaction Mix 3, add 5.0 µL of Overhang Adapter.2. Mix the reaction well by pipetting up and down 10 times with wide-orifice pipette tips. Leave the tube strips on ice.3. Prepare a Master Mix containing Ligation Enhancer, Ligation Additive and Ligation Mix using the table4. Mix the reaction well by pipetting up and down 10 times with wide-orifice pipette tips. It is important to mixwell.5. To the Reaction Mix 3/Adapter Mix, add 32.0 µL of the Ligase Master Mix. The total volume in this step is97.0 µL- 105.0 µL.6. Mix the reaction well by pipetting up and down 10 times with wide-orifice pipette tips. It is important to mixwell.7. Incubate at 20°C for 1 hour. Optional: The Ligation reaction may also be left at 20°C overnight.8. Proceed to the next step.Purify SMRTbell Library Using 1.0X AMPure® PB BeadsPage 11 PN 101-853-100 Version 05(August 2021)Nuclease Treatment of SMRTbell LibraryTo each library sample, add the nuclease mix to remove damaged SMRTbell templates.1. Prepare a Master Mix of the Enzyme Cleanup Mix and Buffer.2. Mix the reaction well by pipetting up and down 10 times with wide-orifice pipette tips. It is important to mixwell.3. Spin down the contents of the tube strips with a quick spin in a microfuge.4. To each 15.0μL of sample, add 55.0 μL of Nuclease Master Mix. The total reaction volume at this step is70.0 µL.5. Mix the reaction well by pipetting up and down 10 times with wide-orifice pipette tips. It is important to mixwell.6. Incubate at 37°C for 30 mins and store on ice immediately.7. Spin down the contents of tube strips with a quick spin in a microfuge.8. Proceed directly to the AMPure PB bead purification step below immediately. Do not store samples at thisstage. Do not let samples sit for long periods of time. Always work on ice.Page 12 PN 101-853-100 Version 05(August 2021)Purify SMRTbell Library Using 1.0X AMPure® PB BeadsSize Selection of SMRTbell LibrariesFor high-throughput whole genome sequencing applications, PacBio highly recommends the PippinHT system (Sage Science) for size-selection of SMRTbell libraries for HiFi sequencing. Typical recovery yields are 35% - 50% and are highly dependent on the size distribution of the starting SMRTbell library.Size Selection Using the PippinHT SystemVerify that your PippinHT system software is up to date and follow the procedure below to remove SMRTbellSize Selection Using the BluePippin SystemSage Science’s BluePippin system may also be used for size-selection of HiFi SMRTbell libraries. Verify that your BluePippin system software is up to date and follow the procedure below to remove SMRTbell templates <10 kb using the BluePippin system. Typical recovery yields are highly dependent on the size distribution of the starting SMRTbell library. For the latest BluePippin system User Manual and guidance on size-selection protocols, contact Sage Science ().Size Selection Using the SageELF SystemSage Science’s SageELF system may also be used to fractionate SMRTbell libraries for HiFi whole genome sequencing applications. Verify that your SageELF system software is up to date and follow the size selection procedure below. For the latest SageELF User Manual and guidance on size-selection protocols, contact Sage Science ().6Set up the run Protocol:– In the “Protocol Editor” tab, click on the “New Protocol” button.– Select the “0.75% 1-18kb v2” in the cassette definition menu.– Select “size-based” for separation mode.– Enter 3450 in the “Target Value” field and move the bar slider to selectwell #12.– Save as new protocol.– On the Main screen, clear previous run data, select cassette description,cassette definition and protocol, enter sample ID(s).– Select in the Nest Selector the cartridge that will be run.7Start the run.8 Once the run is complete, (approximately 4.5 hours), collect 30 μL of the respectivefractions from the elution wells. Fractions of interest are typically ~11 kb, ~13 kb,~15 kb, ~17 kb.9 Check the sizes of all 12 fractions by loading on a Femto Pulse. To determine theaverage library size, perform a smear analysis by selecting the region of interestby defining the start and end points of the fractions.10 Pool together fractions that have an average library size 10 – 20 kb.11 Proceed to the AMPure PB Bead purification step.Purify Size-Selected HiFi Library Fractions with 1.0X AMPure ® PB BeadsSequencing PreparationSee Quick Reference Card - Loading and Pre-Extension Recommendations for Sequel II/IIe Systems .For Research Use Only. Not for use in diagnostic procedures. © Copyright 2020 - 2021, Pacific Biosciences of California, Inc. All rights reserved. Information in thisdocument is subject to change without notice. Pacific Biosciences assumes no responsibility for any errors or omissions in this document. Certain notices, terms, conditions and/o r use restrictions may pertain to your use of Pacific Biosciences products and/or third p arty products. Please refer to the applicable PacificBiosciences Terms and Conditions of S a le and to the applicable license terms at /lice nses.html. Pacific Biosciences, the Pacific Biosciences logo, PacBio, S M RT, SMRTbell, Iso-Seq and Sequel are trademarks of Pacific Biosciences. Femto Pulse and Fragment Analyzer are trademarks of Agilent Technologies. All other trademarks are the sole property of their respective owners.Revision History (Description)Version Date Initial release.01 September 2019 Internal revision with no content change (not uploaded to website).02 December 2019 On page 1, changed “HiFi reads” to just “Reads”. On page 12, under Repair DNA Damage,corrected “remove single strand overhangs” to “repair DNA damage”. On page 13, corrected “remove single strand overhangs” to “adapter ligation”.03 January 2020 Updated for SMRTbell Enzyme Clean Up Kit 2.0 and Sequencing Primer v5.04 April 2021 Removed SMRT Link Sample Setup and Run Design tables. Added reference to QRC.05August 2021。
- 1、下载文档前请自行甄别文档内容的完整性,平台不提供额外的编辑、内容补充、找答案等附加服务。
- 2、"仅部分预览"的文档,不可在线预览部分如存在完整性等问题,可反馈申请退款(可完整预览的文档不适用该条件!)。
- 3、如文档侵犯您的权益,请联系客服反馈,我们会尽快为您处理(人工客服工作时间:9:00-18:30)。
Wear258(2005)1148–1155Railway noise and the effect of top of rail liquid friction modifiers:changes in sound and vibration spectral distributions in curvesDonald T.Eadie a,∗,Marco Santoro a,Joe Kalousek ba Kelsan Technologies Corp.,1140West15th St.,North Vancouver,BC,Canada V7P1M9b National Research Council of Canada,Centre for Surface Transportation,3250East Mall,Vancouver,BC,Canada V6T1W5Received13June2003;received in revised form28November2003;accepted1March2004Available online11November2004AbstractFor railway noise in curves,bothflanging and squeal noise can be environmentally significant.Rolling noise is dominant in tangent track. This paper examines the spectral sound distribution in curves for different wheel/rail system types,and compares spectra after the top of rail friction level is controlled with a special friction modifier.The friction modifier controls top of rail(TOR)friction at an intermediate level, and imparts“positive friction”attributes to the interfacial layer.A significant range of spectral characteristics was noted for the different wheel/rail system types.In all cases the friction modifier significantly reduced the sound levels at the frequencies associated with top of rail squeal,and also at the frequency bands related toflange contact noise.For some Metro systems a noticeable reduction was also recorded at the lower frequencies associated with rolling noise,possibly due to a reduction in“graunching”.There was some suggestion of reduction at low frequency vibration(frequencies down to30Hz)as well as in the high stick-slip oscillation frequencies.©2004Elsevier B.V.All rights reserved.Keywords:Railway noise;Metro systems;Liquid friction modifiers1.BackgroundRailway noise is an area of continuing research interest. Regulatory and public concern continues to drive technolog-ical initiatives to understand and define sources and means of mitigating the different types of noise emanating from rail-way systems.Vibration from trains is also an area of concern especially for Metro systems with nearby office or residential buildings.This paper is concerned with wheel squeal,flanging noise, rolling noise,and vibration.Squeal andflanging noise are associated with curves,particularly sharp curves(R<500m) whereas rolling noise is generally associated with tangent track.Spectral sound distribution levels are also considered for different types of trains.In particular we examine how noise and spectral sound distribution is altered by control ∗Corresponding author.Tel.:+16049846100;fax:+16049843419.E-mail addresses:deadie@(D.T.Eadie),msantoro@(M.Santoro),joe.kalousek@nrc.ca(J.Kalousek).of friction on the top of rail(TOR).Control of friction is achieved with a special friction modifier that does not impact traction or braking.1.1.Frequency range of different noise typesTable1summarizes the frequency range for the different types of railway noise of concern in this paper.These are either the ranges generally accepted within the industry,or those established from our own experience with sound mea-surements on many different systems.The identification offlanging noise as high frequency (5000–10000Hz)will be addressed in more detail later in the paper.1.2.Mechanism of noise generationThe sources and reduction possibilities of railway noise have recently been reviewed by Talotte et al.[1].0043-1648/$–see front matter©2004Elsevier B.V.All rights reserved. doi:10.1016/j.wear.2004.03.061D.T.Eadie et al./Wear258(2005)1148–11551149Table1Frequency range for different types of railway noiseNoise type Frequency range(Hz) Rolling30–5000Flat spots50–250(speed dependant) Ground borne vibrations4–80Structure–borne noise30–200Top of rail squeal1000–5000Flanging noise5000–10000 Rolling noise is established as originating from structural vibrations of the wheel,rail and sleepers resulting from the combined surface roughness of the wheel and running sur-faces.Roughness on wheels can be induced by factors such as the use of tread brakes,especially those made from cast iron.Ground borne vibrations and structure-borne noise mainly occur at low frequencies(<50Hz).Frequencies above this are attenuated increasingly rapidly[2].Vibration disturbance is usually caused by the large vertical dynamic forces be-tween wheels and rails.These forcesfluctuate in response to wheel and rail roughness over a wide range of frequen-cies.Wheel squeal originates from frictional instability in curves between the wheel and rail.Stick-slip oscillations (more accurately referred to as roll-slip)excite a wheel resonance;the wheel vibration radiates noise efficiently. The accepted model involves TOR frictional instability un-der lateral creep conditions leading to excitation of out of plane wheel bending oscillations.These are radiated and heard as squeal.The most recent developments involve more rigorous mathematical modeling by Heckl[3].The start-ing point for squeal is lateral creep forces that occur as a bogie goes through a curve and the wheel/rail contact patch becomes saturated with slip(creep saturation).A crit-ical component in all the modeling work is the require-ment that beyond the point of creep saturation,further in-creases in creep levels lead to lower coefficient of fric-tion.This is known as negative friction,referring to the slope of the friction creep curve at saturated creep con-ditions.In more general tribological terms,this would be equated to changes in sliding velocity,rather than the rail-road term creep.This leads to roll-slip oscillations be-tween the wheel and the rail which excite a wheel res-onance,and the wheel web radiates the noise.Most re-cently,De Beer et al.have developed a frequency domain model of squeal noise in terms of lateral contact position, and supported the results with laboratory measurements [4].“Graunching”is another form of noise associated with curving.Unfortunately little is known in the literature about this phenomenon.This is a low frequency phenomenon,of perhaps several,probably associated with stick-slip of a dif-ferent form than that of top of rail squeal.It may possibly be due toflange rubbing.2.Field experimentation2.1.Wheel/rail system types and characteristicsFor this purpose the wheel/rail systems examined have been classified into three general types:1.Trams(Europe and Japan)and light rail(North America),with axle loads typically9–11t.2.Metro(Europe)and heavy rail(North America).Theseare characterized by moderate axle loads and heavier rail sections than in trams(11–15t).3.Heavy haul freight(axle loads20–35t).Each test is further characterized according to the follow-ing parameters:1.Curve radius.2.Speed.3.Number of axles per car.4.Number of cars.5.Track type.6.Brake type.7.Gauge face lubrication practice.8.Friction modifier application method.2.2.Sound measurementsSound level measurements were carried out using a Bruel &Kjaer2260Sound Level Meter.The microphone wasfitted with a foam windscreen and handheld on the outside(high rail side)of the test curve.The sound meter was held7.5m from the center of the track,with the microphone1.2m above the height of the rail.The maximum sound level range was preset to between65and130dB for train passes(35–100dB for ambient).Sound measurements were made in the center of the curve.The sound level meter was programmed for event recording,enabling the instrument to automatically measure and stores the event data.The logged data was downloaded via a serial interface to a laptop computer.In all but one case the data reported is the averaged L Leq values for each of sev-eral trains under the particular conditions evaluated.L Leq is the linear weighting of the average noise level.Measurements were made for the residence time of the train in the curve.For trams,the residence time was approximately15s,for Metros about30s,and for freight trains about2min.Five or more trains were measured and the data in this paper is always the average for all the trains measured.For System8,L Amax was measured with a Rion NA-24m set for A weighting,which measured only at certain selected frequencies.2.3.Vibration measurementsVibration measurements were carried out in a track build-ing located about10m from the trackside friction modifier delivery system,near the beginning of the test curve.This location was less than ideal,but access to local office build-1150 D.T.Eadie et al./Wear258(2005)1148–1155ings was not available.A Norsonics Model121analyzer was used to collect the data.The analyzer was set to collect1/3 octave band spectra for1s periods and was operated continu-ously during the testing.The vibration results were converted from acceleration to velocity,and all the vibration results in this paper are in terms of velocity decibels using a decibel reference of dB re2.5×10−8m/s(1in./s).2.4.Friction modifier characteristicsThe top of rail friction modifier used in this work is a water-based liquid material known as KELTRACK®[5–7]. After water removal,a thin dryfilm remains that provides an intermediate coefficient of friction in the range0.30–0.35 as measured with a push tribometer.This friction level does not compromise braking or traction.The differences betweena true friction modifier and a lubricant have been reviewed[8].Friction levels have not been specifically reported in this paper,but the reader is referred to a previous publication for typical friction values[11].Typical top of rail friction levels will be0.5–0.6,and after application of friction modifier will be controlled in the range0.35±0.4.The friction modifier is a suspension of engineered solids that provide the required frictional properties.Other compo-nents are present in order to:(1)Control application performance in the delivery mecha-nism.(2)Maximizefilm strength and endurance,a parameterknown as“retentivity”.The positive friction characteristics of this friction modi-fier thinfilm have been established in two roller rig studies in Japan[9]and in other studies[6].The frictional properties of the thinfilm are the net result of the friction modifier and the other Third Body compo-nents.(The Third Body refers to the all the components of layer between wheel and rail.)The friction modifier has been designed for optimal interaction with the iron oxide wear components that dominate the Third Body under normal con-ditions.Thefilm characteristics have also been developed to provide the appropriate durability so thefilm lasts for as many axles as possible.2.5.Friction modifier applicationThe friction modifier can be applied by a number of al-ternative methods such as spray from on-board locomotives or transit cars[10],using a trackside applicator,or from a track maintenance vehicle.In this work the water-based liq-uid friction modifier was applied to the top of rail either by hand application using paint rollers,or automatically using a special applicator from Portec Rail,the Protector Top of Rail system[7,11].For hand application,a target application rate of0.3g/m per rail was used.The friction modifier was applied to the tangent immediately before the curve and through the body of the curve.In all cases except for System8,frictionFig.1.Typical trackside top of rail applicatorinstallation.Fig.2.Close up of top of rail application bar.modifier was applied to the top of both rails(inner and outer). Tests on System8examined the difference in sound reduction for application to the top of the low(inner)rail only versus both rails.Fig.1shows the automatic trackside application system.Two specially designed wiping bars are mounted on thefield side of each rail,and these are shown in Fig.2. 3.Test results3.1.Spectral sound patterns across different rail systemsSpectral sound patterns in curves werefirst compared without friction modifier between the three general types of wheel/rail systems,Fig.3.This data is the same as the“baseline”spectra for each separate system shown in Figs.4–8,10and11.Corresponding information on curve radius,train speed,etc.can be found in Tables2–4.The spec-tral sound patterns for the three systems are rather different. The tram systems have the lowest overall sound levels.Nev-ertheless there are distinct maxima for the trams within the wheel squeal range,e.g.at1250and2500Hz.This is con-sistent with the human experience at these sites,where thereD.T.Eadie et al./Wear 258(2005)1148–11551151Fig.3.Sound spectrum:different wheel/rail systemtypes.Fig.4.System 1,site A,tram.Fig.5.System 1,site B,tram.was a substantial amount of annoying wheel squeal in all cases.The Metro systems show a generally higher overall sound level and less distinction between rolling and squeal noise contributions.(All the Metro sites are underground.)The freight systems generally show a larger contribution fromtheFig.6.System 2,tram.Fig.7.System 3,Metro.Fig.8.System 4,Metro.flanging frequency range than the other systems,presumably because of the larger lateral and flanging forces associated with the high axle loads.3.2.Effect of friction modifier:tram systemsThe effect of friction modifier was examined on the spec-tral sound distribution of two tram systems.Measurements were taken at two curves on System 1and one curve on System 2.Characteristics of the tram systems are shown in Table 2below,which also provides average sound levels with and without the friction modifier.Spectral sound characteristics with and without friction modifier are shown in Figs.4–6.Table 2Test site characterization,tram systemsSystem 1,site ASystem 1,site B System 2System type Tram Tram Tram Curve radius (m)191935Speed (kph)161616Axles per car 886Cars per train 111Track typeImbedded U-rail Imbedded U-rail Imbedded U-rail Brake typeDisc Disc Disc Gauge face lubrication No Yes No FM application method Manual Manual Manual Average L Leq baseline,dB re 2×10⁻⁵Pa 83.392.483.3Average L Leq friction mod,dB re 2×10⁻⁵Pa71.280.672.51152 D.T.Eadie et al./Wear258(2005)1148–1155Table3Test site characterization,Metro systemsSystem3System4System type Metro(underground)Metro(underground) Curve radius(m)9790Speed(kph)832Axles per car44Cars per train1010Track type Wooden ties/concrete Wooden ties/concrete Brake type Tread TreadGauge face lubrication Yes YesFM application method Manual Trackside applicator Average L Leq baseline,dB re2×10−5Pa101.5105.9Average L Leq frictionmod,dB re2×10−5Pa91.998.6Figs.5and6indicate that noise in the wheel squeal and flanging parts of the spectra have been significantly reduced with the friction modifier.At frequencies below the squeal range there is little change in the spectra.3.3.Effect of friction modifier–Metro systemsTable3details the system characteristics for the two Metro systems selected for reporting,and Figs.7and8show the effect of friction modifier on the spectral sound distribution for these systems.The average sound levels in the Metro systems are rather high across the entire spectrum.Although there are no spe-cific peaks in the part of the spectrum assigned to squeal,to the human ear at both Metro sites the presence of squeal was very apparent.Based on this,although the spectra are rel-atively featureless there must be a considerable broad-band contribution which may be due to rolling noise,squeal,or flanging noise.It may be that the relatively high overall sound levels are obscuring the spectral maxima apparent in the tram e of narrow-band spectra rather than1/3octave would help clarify this point,and future studies will use this methodology were appropriate.Application of friction mod-ifier to the top of rail in these cases affects a broader range of the spectrum than in the tram case.One possibleexplana-Fig.9.Average vibration spectra,System4,Metro.tion is that there is significant contribution from“graunching”noise at low frequency,and that these have a stick-slip oscil-lation mechanism.If so,the positive friction characteristics of the friction modifier might be expected to mitigate this noise source.Reductions in sound levels in these cases are observed right down to30Hz.3.4.Effect of friction modifier on vibrations on System4 (Metro)During the sound testing described for System4,vibration was also measured in the curve.Vibration levels before and after friction modifier application are shown in Fig.9.Although the test site was less than ideal,the measure-ments suggest some reduction in vibration levels in the 30–60Hz frequency range.The measurements at frequencies below30Hz are of limited value as the trains were too close to the measurement site.The test results also show vibration reduction at the high frequencies(>1500Hz)where the fric-tion modifier is effective as a result of controlling slip-stick interaction at the wheel/rail interface.Further investigation of this area is clearly warranted.3.5.Effect of friction modifier–heavy haul freightTable4outlines system characteristics for three different heavy haul freight systems.Table4Test site characterization,freight systemsSystem5System6System7System type Heavy haul freight Heavy haul freight Heavy haul freight Curve radius(m)291200148.5Speed(kph)323232Axles per car444Cars per train1006080Track type Concrete ties/ballast Concrete ties/ballast Wooden ties/ballast Brake type Tread Tread TreadGauge face lubrication No Yes VariableFM application Trackside applicator Trackside applicator Trackside applicator Average L Leq baseline,dB re2×10−5Pa90.6102.4Average L Leq friction mod,dB re2×10−5Pa81.886.9D.T.Eadie et al./Wear 258(2005)1148–11551153Fig.10.System 5,heavy haul freight.Results before and after friction modifier applications by automated trackside delivery system are shown below in Figs.10and 11Systems 5and 6,respectively.The results show a distinct reduction in squeal and higher frequency flanging noise.Changes in rolling noise are marginal at best.3.6.Identification of flanging noise spectral pattern Because flanging noise sounds to the human ear like a grinding or hissing noise,it is sometimes assumed that this is associated with lower spectral frequencies.The following examples illustrates the distinction between top of rail squeal and flange contact sound spectral patterns.The first example is from a North American freight rail sharp curve which has been monitored for several years (Sys-tem 7,Table 4).In this curve the trackside gauge face grease lubrication is used to control wear,and the friction modifier,applied by an atomized spray to the top of rail [11],controls the wheel squeal noise.On one particular occasion,local res-ident complaints prompted us to carry out additional sound level monitoring.To the trained ear,it was clear that the sound (which was indeed quite irritating)was the hissing sound typ-ical of flange contact.It turned out that the trackside grease lu-brication units had become non-functional.When these were repaired,the hissing flange noise disappeared.The spectral sound patterns are shown in Fig.12.This figure shows (A)trains with some TOR squeal,(B)TOR application with no gauge face lubrication (flanging noise),and (C)full control of train noise with both TOR friction control and gauge face lubrication.This result does not however address thequestionFig.11.System 6,heavy haulfreight.Fig.12.(A)Some squeal,(B)TOR only,(C)TOR plus gauge face lubrica-tion.of the spectral frequency of “graunching”or grinding which may also be associated with flange contact.Further work is needed in this area.The results on Metros and trams although limited,suggest that in some cases top of rail friction control alone can elim-inate both top of rail squeal and higher frequency flanging noise.(This conclusion is undoubtedly site specific.)How-ever in heavy haul freight applications,the higher lateral and flanging forces in sharp curves require gauge face/flange in-terface lubrication in addition to top of rail friction control to fully control noise.This conclusion is also probably site spe-cific,and further testing is needed to explore the limits and track conditions that affect these conclusions.The dual top of rail and gauge face application may only be required in sites with specific conditions of curvature,track superelevation,axle load,bogie type,etc.The second example is from a tram system in Japan.Sys-tem details are shown in Table 5.Fig.13shows that with application of friction modifier to the top of the low rail only,there is a reduction in sound levels in the range from 1000to 4000Hz,but little change at frequencies above 4000Hz.In this case the figure shows the spectra of the 1s highest A-weighted level.However with application of friction modifier to the top of both rails,the high frequency component is further reduced.The fric-tion levels on the top of the low rail are primarily respon-sible for reducing gauge-spreading forces,regardless of top of high rail friction levels.However,the friction levels on both rails affect the reduction in flanging force [12].Hence providing controlled reduced friction on the high rail willTable 5Test site characterization,System 8System 8System type Tram Curve radius (m)160Speed (kph)24Axles per car 4Cars per train 1Track type Wooden ties/ballast Brake typeTread Gauge face lubrication NoFM applicationTrackside applicator Average L Amax baseline (dBA)90.8Average L Amax friction mod (dBA)85.71154 D.T.Eadie et al./Wear258(2005)1148–1155parison of friction control on low rail only vs.application to both rails.further reduceflanging forces,and consequentlyflanging noise.4.DiscussionThefield data described shows considerable variation in spectral sound characteristics between different wheel/rail systems in curves.All systems considered show contribu-tions from bothflanging noise and top of rail wheel squeal. Application of top of rail friction modifier reduced these noise sources in all systems considered.The reduction inflanging noise in most systems tested in transits(trams and Metros)is interesting.In systems where conventional gauge face lubrication is used,there is still a reduction inflanging noise with the application of friction modifier(see Figs.5,7and8).In cases where there is no gauge lubrication,the friction modifier reducesflanging noise to an even lower level(see Figs.4and6).Reduction inflanging noise is because the friction modifier reduces TOR friction from an average“dry”state of0.45–0.6 down to an optimum level around0.35as measured with a push tribometer.The result is a corresponding reduction in lateral forces andflanging forces.It is well known that the presence of gauge face lubrication increases the angle of attack and the magnitude of lateral forces.The top of rail friction modifier is effective enough to mitigate the increase in lateral forces caused by gauge face lubrication[12].The other outcome is,in some cases,elimination of high rail gauge face contact with associated dramatic reduction in rail wear[11].The reduction in rolling noise in some cases but not in others is of interest.The mechanism for this noise reduction is not yet entirely clear.Future work will investigate the possible role of rail roughness changes with friction modifiers and how this might be related to the results reported in this paper. 5.ConclusionsThis paper has shown that friction modifiers can reduce overall noise in curves across a wide range of wheel/rail sys-tems,as shown in Fig.14.Fig.14.Summary of average sound level reductions.This work also shows that in practical railways there is a large variation in absolute sound levels and spectral pat-terns.These have been characterized across trams,Metro, and heavy haul freight.The results show that:•Friction modifiers reduce squeal noise across all systems considered.•Friction modifiers reduceflanging noise in all transit sys-tems tested,but not necessarily in freight,where effective gauge face lubrication may also be required because of the higher lateral andflanging forces,especially in sharper curves.•For systems with highest overall noise levels,the noise tends to be reduced across a broader part of the spectrum with friction modifiers.•In one case,some reduction in low frequency vibration has been observed with friction modifier application.Ongoing work is examining in more detail the mechanisms by which friction modifiers reduce low frequency noise and vibrations,as well as the effects on wheel and rail rough-ness.Future work should also consider the potential impact of friction modifier on roughness levels on tangent track.The controlled intermediate friction is expected to reduce the rate of roughness increase because of reduced longitudinal and friction forces.AcknowledgmentsThe following individuals are acknowledged for their helpful contributions:Mr.David Elvidge for the freightflang-ing noise measurements(System7),ATS Consulting(Dr. Hugh Saurenman)for the vibration measurements,Dr.Y.Oka for the sound measurements on System8,One of the referees for suggesting that“graunching”was responsible for some of the low frequency noise.References[1]C.Talotte,P.E.Gautier,D.J.Thompson,C.Hanson,Identificationmodeling and reduction potential of railway noise sources,in:Pro-D.T.Eadie et al./Wear258(2005)1148–11551155ceedings of the Seventh International Workshop on Railway Noise, Portland,Maine,October2001.[2]C.Esveld,Modern Railway Track,2nd ed.,TU Delft,Netherlands,2001,ISBN90-800324-3-3.[3]M.A.Heckl,Curve squeal of train wheels.Part3.Active control,J.Sound Vibrat.229(3)(2000)709–735,reference therein.[4]F.G.De Beer,M.H.A.Janssens,P.P.Kooijman,Squeal noise of railbound vehicles influenced by lateral contact position,in:Proceedings of the Seventh International Workshop on Railway Noise,Portland, Maine,October2001.[5]K.S.Chiddick,Solid lubricants and friction modifiers for heavy loadsand rail application,US Patent6136757(October2000).[6]D.T.Eadie,J.Kalousek,K.S.Chiddick,The role of high positivefriction(HPF)modifier in the control of short pitch corrugations and related phenomena,Wear253(1–2)(2002)185–192.[7]D.T.Eadie,M.Santoro,W.Poll,Local Control of Noise and Vi-bration with KELTRACK Friction Modifier and Protector TracksideApplication:An Integrated Solution,Seventh International Workshop on Railway Noise,Portland,Maine,October2001.[8]D.T.Eadie,J.Kalousek,Railway Age(2001)48.[9]A.Matsumoto,Y.Sato,H.Ono,Y.Wang,Y.Yamamoto,M.Tani-moto,Y.Oka,Creep force characteristics between rail and wheel on scaled model,Wear253(1–2)(2002)199–203.[10]M.Tomeoka,N.Kabe,M.Tanimoto,E.Miyauchi,M.Nakata,Fric-tion control between wheel and rail by means of on-board lubrica-tion,Wear253(1–2)(2002)124–129.[11]D.T.Eadie,N.Hooper,B.Vidler,T.Makowsky,Top of rail frictioncontrol:lateral force and rail wear reduction in a freight application, in:Proceedings of the International Heavy Haul Conference,Dallas, May4–8,2003.[12]J.Kalousek,Rolling radius difference:Do appreciate it’s signifi-cance?National Research Council of Canada Centre for Surface Transportation Report CSTT-VTD-54-AAR,June2001.。