10472946-Random-Effects Meta-Analyses Are Not Always Conservative
第五讲 Meta-分析简介

4、合并效应量的可信区间
可信区间(confidence interval,CI)是 按一定的概率估计总体参数所在的范围 可信区间主要有估计总体参数和假设检 验两个用途
在Meta-分析中,常用可信区间进行假 设检验,95%可信区间与为0.05的假 设检验等价, 99%可信区间与为0.01 的假设检验等价 森林图就是根据各个独立研究效应量 的95%可信区间及合并效应量的95%可 信区间绘制而成
二是各个研究的样本含量的大小不相同
因此,传统文献综述所采用的等权重方法很难 保证研究结果的真实性、可靠性和科学性,尤 其当多个研究的结果不一致时,其结论容易使 人产生误解或困惑。
Meta-分析的统计目的
对多个同类独立研究的结果进行汇总 和合并分析,以达到增大样本含量,提 高检验效能的目的,尤其是当多个研究 结果不一致或都没有统计学意义时,采 用Meta-分析可得到接近真实情况的统 计分析结果。
Meta-分析结论(2)
Meta-分析结果:抗高血压药物组病死率与安 慰剂组比较有统计学意义,其OR合并的95%CI横 线落在无效线左侧,故可认为抗高血压药物可 减少老年心血管疾病的病死率,即抗高血压药 物对老年心血管疾病有效。
实例二:数值变量的森林图
Meta-分析结论(1)
3个中有1个研究的95%可信区间横线与无效竖线相 交,表明该研究结果认为有饮食计划与无饮食计划 两组的健康得分的均数无差别。另2个研究的95%CI 的横线落在无效竖线的右侧,表明该两个研究认为 有饮食计划与无饮食计划两组的健康得分的均数有 差别。
指数?在revman软件中i2可用于衡量多个研究结果间异质程度的大小?若i2?50则说明存在比较明显的异质性22计算合并效应量计算合并效应量的两种统计模型?固定效应模型fixedeffectmodel适用于多个研究具有同质性无异质性时?随机效应模型randomeffectmodel适用于多个研究不具有同质性时先对异质性原因进行处理若异质性分析与处理后仍无法解决异质性可选择随机效应模型分类变量资料相对危险度rr比值比or绝对危险度rd效应指标的选择?数值变量资料加权均数差wmd标准化均数差smd3合并效应量的检验?用假设检验hypothesistest的方法检验多个独立研究的总效应量效应尺度是否具有统计学意义是否具有统计学意义其原理与常规的假设检验完全相同其原理与常规的?两种方法?u检验ztest?卡方检验chisquaretest?根据z或u值或卡方值得到该统计量下概率p值多个研究的合并效应量有统计学意义?若p?005?若p?005多个研究的合并效应量有统?若p005多个研究的合并效应量没有统计学意义4合并效应量的可信区间?可信区间confidenceintervalci是按一定的概率估计总体参数所在的范围?可信区间主要有估计总体参数和假设检验两个用途?在meta分析中常用可信区间进行假设检验95可信区间与?为005的假设检验等价99可信区间与?为001设检验等价99可信区间与?为001的假设检验等价?森林图就是根据各个独立研究效应量的95可信区间及合并效应量的95可信区间绘制而成三meta分析的森林图及临床意义森林图forestplot是由多个原始文献的效应量及其95可信区间绘制而成横坐标为效应量尺度以一条垂直的无效线横坐标刻度为1或0为中心纵坐标为原始文献的编号按照一定的顺序将各个研究结果依次绘制到图上
Meta分析中的异质性评价、敏感性分析和发表偏倚及漏斗图不对称性检测

Meta分析中的异质性评价What is heterogeneity? Variation or differences•Meta分析中异质性分类三类•Clinical•Methodological•StatisticalClinical diversity•participants•e.g. condition, age, gender, location, study eligibility criteria •interventions•intensity/dose, duration, delivery, additional components,experience of practitioners, control (placebo, none,standard care)•outcomes•follow‐up duration, ways of measuring, definition of anevent, cut‐off pointsMethodological diversity•design•e.g. randomised vs non‐randomised, crossover vs parallel,individual vs cluster randomised•conduct•e.g. risk of bias (allocation concealment, blinding, etc.),approach to analysisStatistical heterogeneity•there will always be some random (sampling) variation between the results of different studies •heterogeneity is variation between the effects beingevaluated in the different studies•caused by clinical and methodological diversity•alternative to homogeneity (identical true effects underlyingevery study)•study results will be more different from each other than ifrandom variation is the only reason for the differencesbetween the estimated intervention effectsHow to detect the heterogeneity?I 2统计量I 2统计量是描述由研究间变异占总变异的百分比,计算公式为:⎪⎩⎪⎨⎧≤>-=dfQ df Q Qdf Q I 如果如果02其中,Q 为I 2统计量,df 是它的自由度(即研究总数-1)‐Fixed‐effect vs.random‐effects•Two models for meta‐analysis available in RevMan& Stata software•Make different assumptions about heterogeneity •Pre‐specify your planned approach in your protocolFixed ‐effect model•Assumes all studies are measuring the same treatment effect•Estimates that one effect •If not for random (sampling) error, all results would be identicalCommon Random (sampling)errortrue effectStudy resultSource: Julian HigginsRandom ‐effects model•Assumes the treatment effect varies between studies•Estimates the mean of the distribution of effects •Weighted for both within ‐study (SE) and between ‐study variation (tau 2, 2)Random errorStudy-specific effectMean of true effectsSource: Julian HigginsNo heterogeneityAdapted from Ohlsson A, Aher SM. Early erythropoietin for preventing red blood cell transfusion in preterm and/or low birth weight infants. Cochrane Database of Systematic Reviews 2006, Issue 3.FixedRandomSome heterogeneityFixed RandomAdapted from Adams CE, Awad G, Rathbone J, Thornley B. Chlorpromazine versusplacebo for schizophrenia. Cochrane Database of Systematic Reviews2007, Issue 2.Small study effectsFixed RandomAdapted from Li J, Zhang Q, Zhang M, Egger M. Intravenous magnesium for acutemyocardial infarction. Cochrane Database of Systematic Reviews 2007, Issue 2.Which to choose?•Plan your approach at the protocol stage•Do you expect your results to be very diverse?•Consider the underlying assumptions of the model •fixed‐effects•may be unrealistic –ignores heterogeneity•random‐effects•allows for heterogeneity•estimate of distribution of studies may not be accurate if biasesare present, few studies or few eventsIdentifying heterogeneity•Visual inspection of the forest plots •chi‐squared (c2) test (Q test)•I2statistic to quantify heterogeneityVisual inspectionForest plot A Forest plot BThe chi‐squared (c2) test•Tests the null hypothesis of homogeneity•low power with few studies•may detect clinically unimportant differences with manystudies•narrow question (yes/no) not useful if heterogeneity isinevitable•Calculated automatically by RevManThe I2statistic•I2statistic describes the percentage of variability due to heterogeneity rather than chance(0% to 100%)•low values indicate no, or little, heterogeneity•high values indicate a lot of heterogeneity •Calculated automatically by RevMan•Be cautious in interpretingThe I2statisticchi2= 29.55 df= 13 P = 0.0055 chi2= 6.14 df= 3 P = 0.11I2= 56% I2= 51%Source: Julian HigginsWhat to do about heterogeneity •check that the data are correct•consider in your interpretation•especially if the direction of effect varies•if heterogeneity is very high•interpret fixed‐effect results with caution•consider sensitivity analysis –would random‐effects have made animportant difference?•may choose not to meta‐analyse•average result may be meaningless in practice•consider clinical & methodological comparability of studies •avoid•changing your effect measure or analysis model•excluding outlying studies•explore heterogeneityExploring your results•what factors appear to modify the effect?•clinical diversity (population, interventions, outcomes)•methodological diversity (study design, risk of bias)•plan your strategy in your protocol•identify a limited number of important factors to investigate •have a scientific rationale for each factor chosen•declare any post‐hoc investigationsTwo methods available•subgroup analysis•Group studies by pre‐specified factors•look for differences in results and heterogeneity•meta‐regression•examine interaction with categorical and continuous variables •not available in RevManProceed with caution•results are observational, not randomised•be wary of multiple and post hoc comparisons •may not be useful with few studies•may not be able to investigate aggregate data •look for confounding factors•follow the plan specified in the protocol without over‐emphasising particular findingsResults are rarely definitiveInterpreting subgroup analyses•look at results and heterogeneity within subgroups •are the subgroups genuinely different?•if only 2 subgroups –do the confidence intervals overlap?•statistical tests for subgroup difference•can be more confident about:•pre‐specified analyses•within‐study analyses•effect is clinically plausible and supported by indirect evidence •effect is clinically important and will alter recommendationsParticipant subgroupsBased on Stead LF, Perera R, Bullen C, Mant D, Lancaster T. Nicotine replacement therapy for smoking cessation. Cochrane Database of Systematic Reviews 2008, Issue 1. Art. No.: CD000146. DOI: 10.1002/14651858.CD000146.pub3.Intervention subgroupsSensitivity analysis•not the same as subgroup analysis•testing the impact of decisions made during the review •inclusion of studies in the review•definition of low risk of bias•choice of effect measure•assumptions about missing data•cut‐off points for dichotomised ordinal scales•correlation coefficients•repeat analysis using an alternative method orassumption•don’t present multiple forest plots –just report the results•if difference is minimal, can be more confident of conclusions •if difference is large, interpret results with cautionWhat to include in your protocol •Assessment of heterogeneity•assessment of comparability of studies before meta‐analysis •visual inspection and use of statistics such as I2•Data synthesis•fixed‐effect or random‐effects model (or both)•Subgroup analyses and investigation of heterogeneity •planned subgroup analyses•any other strategies for investigating heterogeneityTake home message•statistical heterogeneity is the presence of differencesbetween estimated intervention effects greater than expected because of random (sampling) variation alone•it can be caused by clinical and methodological diversity•fixed and random‐effects models make different assumptions about heterogeneity•explore any heterogeneity you findStata进行异质性评价Stata进行异质性评价•图示法•拉贝图(labbe)•Galbraith星状图(galbr)•定量判断•亚组分析•Meta回归(metareg)•hetredL’Abbe图•拉贝图是以每项研究中的干预组事件发生率相对于对照组事件发生率作图,若研究间同质,则所有点呈直线分布,或者说不能偏离效应线太远•具有主观性,偏离多远算远?•以例5_数据为例•首先执行metan命令,计算合并效应量metan ntdeath ntalive ncdeath ncalive, label(namevar=study, yearvar=year) random or nograph•绘制拉贝图labbe ntdeath ntalive ncdeath ncalive, percent null or(0.851)Galbraith星状图•Galbraith星状图是以标准化估计值(如logor/lnrr)相对于其标准误的倒数作图,若散点斜率较为接近则说明研究间同质•主观性较大•以例5_数据为例•首先执行metan命令,计算合并效应量,生成中间变量_ES, _selogESmetan ntdeath ntalive ncdeath ncalive, label(namevar=study, yearvar=year) random or nograph•计算logor,selogorgen logor=log(_ES)gen selogor=_selogES•绘制Galbraith星状图galbr logor selogorStata实现亚组分析•亚组分析是探索异质性来源的一个重要方法•如何确定亚组?需要从专业角度寻找•应避免过度的亚组分析•合理的亚组分析应该在研究的设计阶段就确定,写在研究方案中•以例6_数据为例命令语句•metan a b c d, label(namevar=authors, yearvar=year) by(lati_grp)random rr counts group1(experiment)group2(control) xlabel(0.03,1,5) force texts(140) boxsca(60)结果。
meta分析方法介绍

Meta分析详细介绍
➢ Meta分析是一种基于文献资料的定量化综合评价多个同类 独立研究结果的统计学方法。常用于临床试验、诊断试验和 流行病学研究等方面的综合评价。
➢ 它包括提出问题、收集和分析数据、报告结果等基本过程。 ➢ Meta分析常用的方法有固定效应模型(fixed-effects model)
G 2 Sen
2
ai
ln(
a
ai m1i
)
ci
ln(
c
ci m1i
)
m1
m1
其中, a ai , c ci , m1 m1i
在 H0 成立时,G2Sen 服从自由度为 ν=k-1 的 χ2 分布。若 P >α,则不拒绝 H0, 可认为各研究是同质的,可以采用上面的公式计算 Sen 及其 95%置信区间。
(1)以 OR 为效应指标的统计量及其标准误
ORi
ai d i bi ci
SEln(ORi )
1111 ai bi ci di
(2)以 RR 为效应指标的统计量及其标准误
RRi
ai ci
n1i n2i
SEln(RRi )
11 1 1 ai ci n1i n2i
(3)以 RD 为效应指标的统计量及其标准误
诊断试验
+ 合计
表 2 第 i 个研究资料整理格式
金标准
+ ai(TP) ci(FN)
m1i
_ bi(FP) di(TN)
m2i
合计
n1i n2i Ni
真阳性数(TP)、假阳性数(FP)、假阴性数(FN)、真阴性数(TN)
1、基于灵敏度的 Meta 分析计算过程 (1)各研究的灵敏度
Meta分析中的异质性(heterogeneity)及其处理原则和方法全文
可编辑修改精选全文完整版Meta分析中的异质性(heterogeneity)及其处理原则和方法Meta 分析又称荟萃分析、汇总分析、整合分析,是对具有相同研究题目的多个医学研究进行综合分析。
meta分析的目的在于增大样本含量,减少随机误差所致的差异,增大检验效能。
一个高质量的Meta 分析相当于开展了一个多中心的研究,理想情况下,Meta分析纳入的各项研究均指向同一个结果,即各研究间具有同质性。
尽管,我们试图通过严格的入选和排除标准,以保证纳入研究的同质性。
然而,实际情况往往不尽如意。
会造成“合并萝卜、白菜、西红柿”的错误,就算是勉强合并统计量,得出的结论也不可信。
meta就没有意义了。
所以,合并效应量之前,一定要进行异质性检验。
可以明确的说,纳入Meta分析的所有研究都存在异质性。
当异质性较大时,超出了随机误差,Meta分析的结果就不太可靠。
我们需要通过适当的方法识别它,对其进行检验,以决定后续的处理策略。
梅斯医学提供有关异质性处理的策略。
我们在做meta分析前,必须要做的事有两件:A 确定文献的纳入和排除标准;B 纳入文章的质量评分,例如jadad评分、QUADAS评分等。
临床异质性、方法学异质性和统计学异质性三者是相互独立又相互关联的,临床或方法学上的异质,不一定在统计学上就有异质性表现,反之亦然。
统计学异质性是指:不同试验间被估计的治疗效应的变异。
其实,我们可以这样理解,A“严格执行文献的纳入和排除标准”可以减少临床异质性的来源;B “纳入文章的质量评分”可以减少方法学异质性的来源。
异质性检验方法异质性检验方法主要有图示法和统计学检验。
比如,大家熟悉的森林图,森林图可显示单项研究和合并效应量及其置信区间,如果单项研究结果的置信区间有很少的重叠或者不重叠,则提示研究间可能存在异质性。
如图,第1项研究和第2、第4项研究的置信区间无重叠,提示研究间可能存在异质性。
统计学异质性的六种检验方法,三种是检验,三种图示,即Q统计量、I2统计量、H统计量、Galbraith图法、L’Abbe图、漏斗图)。
Meta分析相关概念及方法

Meta分析与循证医学
临床医生不得不承认,单凭推理或病理生理学理论来指 导临床行为有时是不可靠的。从理论上认为有效的疗法,在 临床实践中不一定真正有效。
What can we do
需要人体大样本临床研究“随机对照试验” (randomizing control trial,RCT)证实
Company Logo
心率失常抑制试验 RCT(n=2315) (1987-1988)
病死率
治疗组4.5% 安慰剂组1.2%
禁止恩卡尼生产 限制氟卡尼使用
Company Logo
案例(二)
阻滞剂对心肌有负 性作用,为什么心 衰时能使用β受体阻
滞剂???
大规模临床试验证实: 阻滞剂不仅改善心 功能,而且缩短住院日,提高生存质量,降低死 亡率。
Meta分析相关概念
(一)循证医学
❖循证医学(evidence-based med前所能获得的最好的研究证据,结合医生个人专 业技能和多年临床经验,考虑病人的价值和愿望,将三者完美结合制定出适 合病人的治疗措施。
Archie Cochrane (1909-1988)
森林图(forest plot)
Meta分析的基本步骤
(三)资料的统计分析
Company Logo
Meta分析的基本步骤
(三)资料的统计分析
❖ 异质性分析
⚫ 原理:
meta 分析的统计学本质:合并效应量。
针对相同问题进行的多项单个研究,其研究结果间肯定存在差异。
⚫ 包括三个方面
➢ 临床异质性 试验对象、干预措施、结局指标等差异
Company Logo
Meta分析相关概念
(三)Meta分析
❖ Meta分析(Meta analysis)
meta分析中异质性检验浅析

Meta 分析中的异质性检验一、Meta 分析原理假定各个不同研究都是来自同一个总体,要求不同研究间的统计量应该接近总体参数真实值,所以各个不同文献研究结果是比较接近,就要符合同质性,这时候将所有文献的效应值合并可以采用固定效应模型的有些算法,如倒方差法,mantel haenszel 法,peto法等。
二、异质性的概念2.1广义:描述参与者、干预措施和一系列研究间测量结果的差异和多样性,或那些研究间的内在真实性的变异。
2.2狭义:专指统计学异质性,用来描述一系列研究中效应量的变异程度,也表明除可预见的偶然机会之外的研究间存在的差异性。
三、异质性的分类3.1临床异质性:包含试验对象的差异,如纳入及排除标准的不同;试验条件的差异,如干预剂量、剂型、方法不同;定义指标的差异,如试验定义的暴露、结局、测量工具不同,等等。
3.2方法学异质性:包含研究设计的差异,如前瞻性、回顾性、随机化对照试验;偏倚风险,如盲法;结局完整性,如随访时间长短不同。
3.3统计学异质性:是指不同试验间被估计的效应指标的变异,它是研究间临床和方法学上多样性的直接结果。
统计学计算一致性以数据为基础,其原理是各研究间可信区间的重合程度越,则各研究间存在统计学同质性的可能性越大,相反,可信区间的重合程度越小,各研究间存在统计学异质性的可能性越大。
临床异质性、方法学异质性和统计学异质性三种是相互独立又相互关联的,临床或方法学上的异质,不一定在统计学上就有异质性的表现,反之亦然。
但寻找临床和方法学上的异质性可以提示统计学异质性的来源。
四、异质性检验方法4.1概念:又叫统计量的齐性检验(一致性检验),目的是检查各个独立研究的结果是否具有可合并性。
4.2常见方法:4.2.1 Q检验(1)计算公式及解释?注:Wi :第i个研究的权重,Yi :第i个研究的效应量,M :所有研究的平均效应量。
Q为效应量的标准化平方和,因此服从自由度为(k-1)的χ2分布。
Meta-analysis经典
2 ˆd σ = i
nie + nic nie nic
+
k
2 nie + nic
d
(
d i2
)
(3)
d+ =
i = 1 di k 1 ˆ2 i =1 σ di
i ∑σ ˆ2
(4)
∑
Dr. Andy Field
Page 1
02/03/00
Postgraduate Statistics: Meta-Analysis of Cohen’s d To obtain a standardised value of the mean (a Z score), the mean effect size is simply divided by an estimate of the standard deviation of effect sizes (see equation (6)). The standard deviation of the mean is given in equation (5) (based on the square root of the equation of the variance given on p. 112 of Hedges and Olkin, 1985).
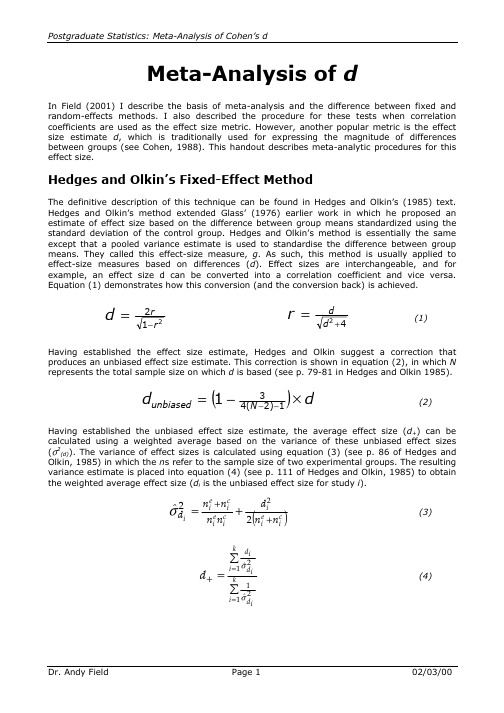
dunbiased = 1 −
(
3 4( N − 2) −1
)× d
(2)
Having established the unbiased effect size estimate, the average effect size (d+) can be calculated using a weighted average based on the variance of these unbiased effect sizes (σ2(d)). The variance of effect sizes is calculated using equation (3) (see p. 86 of Hedges and Olkin, 1985) in which the ns refer to the sample size of two experimental groups. The resulting variance estimate is placed into equation (4) (see p. 111 of Hedges and Olkin, 1985) to obtain the weighted average effect size (di is the unbiased effect size for study i).
第章Meta分析思考与练习参考答案

第25章M e t a分析思考与练习参考答案一、最佳选择题1. Meta分析中,如果异质性检验不拒绝H0,一般采用(A)进行效应合并。
A.随机效应模型 B. 固定效应模型C.混合效应模型D. 回归模型E. 贝叶斯模型2. 关于meta分析,以下(C)说法不正确。
A.meta分析本质上是一种观察性研究,因而可能存在各种偏倚B.meta分析是用定量的方法综合同类研究结果的一种系统评价C.采用随机效应模型能使meta分析的结果更加可靠D.meta分析时,如果研究间异质性很大,应认真考察异质性的来源,并考虑这些研究的可合并性E.亚组分析能使meta分析的结果更有针对性3. 对连续型变量资料的meta分析,如果各纳入研究的测量单位不同,应采用(A)作为效应合并指标。
A.标准化均数差 B. 加权均数差C.均数差D. 标准化P值E. 危险度差值4. 异质性检验采用的统计量是(B)。
A.F统计量 B. Q统计量C.t统计量D.H统计量 E. Z统计量5. 关于发表偏移,以下说法(C)不正确。
A.通过漏斗图可大致判断是否存在发表偏倚B.产生发表偏倚的主要原因是作者往往只把统计学上有意义的阳性研究结果拿来写文章并投稿C.若发表偏倚对meta分析的影响较大,则需要增加很多个研究,才能使meta分析的结果被逆转D.尽量搜集未发表的阴性研究结果,可减少发表偏倚E.漏斗图的基本思想是纳入研究效应的精度随着样本含量的增加而增加二、思考题1. Meta分析的基本步骤有哪些?答:Meta分析的基本步骤包括:提出问题,制定研究计划;检索相关文献;选择符合要求的纳入文献;提取纳入文献的数据信息;纳入研究的质量评价;资料的统计学处理;敏感性分析;结果的分析和讨论。
2. Meta分析的目的和意义是什么?答:通过meta分析能增加统计功效,评价研究结果的一致性,增强结论的可靠性和客观性,通过亚组分析,得出新结论,寻找新的假说和研究思路。
3. Meta分析时,固定效应模型和随机效应模型有什么不同?如果研究间有异质性,应如何处理?答:Meta分析进行效应合并时的变异可能来源于两个部分,一是研究内变异,二是研究间变异。
- 1、下载文档前请自行甄别文档内容的完整性,平台不提供额外的编辑、内容补充、找答案等附加服务。
- 2、"仅部分预览"的文档,不可在线预览部分如存在完整性等问题,可反馈申请退款(可完整预览的文档不适用该条件!)。
- 3、如文档侵犯您的权益,请联系客服反馈,我们会尽快为您处理(人工客服工作时间:9:00-18:30)。
470
e and Greenland
to which random-effects summaries are more vulnerable than fixed-effects summaries.
METHODS
Suppose we desire a summary of K effect estimates, indexed by /, with no consideration for the influence that study characteristics (populations, study designs, exposure contrasts, analytical methods, and so on) might have had on these estimates. In each study population, let Qt be the true magnitude of a measure of effect. 9, is typically the natural logarithm of a relative risk (i.e., a ratio of incidence rates or of incidence proportions). A meta-analytic summary estimate is computed as a weighted average, 9^, of the K estimates, 9,, using weights inversely proportional to v, + s2, where v, is the estimated variance of 9, and s2 is an estimate of the variance (a 2 ) of a population of effect parameters from which it is assumed that the 9, were randomly drawn. The variance of the summary is estimated as follows:
American Journal of Epidemiology Copyright O 1999 by The Johns Hopkins University School of Hygiene and Pubfic Health Ail rights reserved
Vol. 150, No. 5
Received for publication June 1, 1998, and accepted for publication January 22, 1999. 1 Department of Epidemiology, University of North Carolina School of Public Health, Chapel Hill, NC. 2 Department of Epidemiology, UCLA School of Public Health, Los Angeles, CA. Reprint requests to Dr. Charles Poole, Department of Epidemiology (CB 7400), University of North Carolina School of Public Health, Chapel Hill, NC 27599-7400.
Despite these misgivings about meta-analytical summaries of discrepant results, it appears that most metaanalysts are committed to producing a summary of some kind. Meta-analysts rarely entertain the possibility of concluding that study-specific results are too heterogeneous to aggregate. Even rarer are analysts who conclude as Ness and Powles (20, p. 2) did: "The studies included differed in: the type of study, the measurement and reporting of exposure, the period of follow-up and outcome selected. For these reasons, no attempt was made to arrive at a summary statistic." Given a commitment to aggregate results from different studies, no matter how discrepant their methods and results might be, one rationale given for preferring random-effects summaries is that they are said to be "conservative" (21, pp. 141,144; 22, p. 973; 23, p. 95). "Conservative" in this context is generally taken to mean that random-effects summaries tend to have higher estimated variances and, therefore, wider confidence intervals than fixed-effects summaries computed from the same study-specific results. We show that, when random-effects summaries are conservative in this sense, they need not be conservative in other, equally important, senses. Specifically, random-effects summaries can be farther from the null value and can have smaller p values, so they can appear more strongly supportive of causation or prevention than fixed-effects summaries. Furthermore, it is possible for a misleading appearance of strongly supportive results to be produced by a plausible form of publication bias
Downloaded from / by guest on January 28, 2012
Meta-analysis remains a controversial topic in epidemiology, with respect not only to how but also to whether and when it should be done (1-15). One point of contention is when to use random effects and when to use fixed effects in computing summary estimates of effect. Some favor the use of random effects and question the basis for using fixed effects (16, 17). Others find the inclusion of random effects "peculiar" (2, p. 130) or oppose it so strongly as to consider it "wholly wrong" (18, p. 242). We view the opposition of random-effects summaries and fixed-effects summaries as misleading and counterproductive, for the following reason: If the two summaries differ to a meaningful extent, there must be meaningful discrepancies (heterogeneity) among the study-specific effect estimates. In this situation, we contend that any summary will be inadequate. Instead of summarizing, the meta-analyst should report the discrepancies and seek explanations for them (1-11, 19). That such a search may fail to find a convincing explanation does not make a summary estimate any more adequate or any less misleading.
Printed In USA.
Random-Effects Meta-Analyses Are Not Always Conservative