微观经济学(平狄克鲁宾费尔德)第六版课后答案--微观经济学 英文原版-CH12PINDYCK
平狄克《微观经济学》课后答案 18
CHAPTER 18EXTERNALITIES AND PUBLIC GOODSThis chapter extends the discussion of market failure begun in Chapter 17. To avoid over-emphasis on definitions, stress the main theme of the chapter: the characteristics of some goods lead to situations where price is not equal to marginal cost. Rely on the discussion of market power (Chapter 10) as an example of market failure. Also, point out with each case that government intervention might not be required if property rights can be defined and transaction costs are small (Section 18.3). The first four sections present positive and negative externalities and solutions to market failure. The last two sections discuss public goods and public choice.The consumption of many goods involves the creation of externalities. Stress the divergence between social and private costs. Exercise (5) presents the classic beekeeper/apple-orchard problem, originally popularized in Meade, “External Economies and Diseconomies in a Competitive Situation,” Economic Journal (March 1952). Empirical research on this example has shown that beekeepers and orchard owners have solved many of their problems: see Cheung, “The Fable of the Bees: An Economic Investigation,” Journal of Law and Economics (April 1973).Solutions to the problems of externalities are presented in Sections 18.2 and 18.3. Section 18.2, in particular, discusses emission standards, fees, and transferable permits. Example 18.1 and Exercise (3) are simple applications of these concepts.One of the main themes of the law and economics literature since 1969 is the application of Coase’s insight on the assignment of property rights. The original article is clear and can be understood by students. Stress the problems posed by transactions costs. For a lively debate, ask students whether non-smokers should be granted the right to smokeless air in public places (see Exercise (4)). For an extended discussion of the Coase Theorem at the undergraduate level, see Polinsky, Chapters 3-6, An Introduction to Law & Economics (Little, Brown & Co., 1983).The section on common property resources emphasizes the distinction between private and social marginal costs. Example 18.5 calculates the social cost of unlimited access to common property, and the information provided is used in Exercise (7). Exercise (8) provides an extended example of managing common property.The last two sections focus on public goods and private choice. Point out the similarities and differences between public goods and other activities with externalities. Since students confuse nonrival and nonexclusive goods, create a table similar to the following and give examples to fill in the cells:The next stumbling block for students is achieving an understanding of why we add individual demand curves vertically rather than horizontally. Exercise (6) compares vertical and horizontal summation of individual demand.The presentation of public choice is a limited introduction to the subject, but you can easily expand on this material. A logical extension of this chapter is an introduction to cost-benefit analysis. For applications of this analysis, see Part III, “Empirical Analysis of Policies and Programs,” in Haveman and Margolis (eds.), Public Expenditure and Policy Analysis (Houghton Mifflin, 1983).1. Which of the following describes an externality and which does not? Explain the difference.a. A policy of restricted coffee exports in Brazil causes the U.S. price of coffee to rise,which in turn also causes the price of tea to increase.Externalities cause market inefficiencies by preventing prices from conveying accurateinformation. A policy of restricting coffee exports in Brazil causes the U.S. price ofcoffee to rise, because supply is reduced. As the price of coffee rises, consumers switchto tea, thereby increasing the demand for tea, and hence, increasing the price of tea.These are market effects, not externalities.b. An advertising blimp distracts a motorist who then hits a telephone pole.An advertising blimp is producing information by announcing the availability of somegood or service. However, its method of supplying this information can be distractingfor some consumers, especially those consumers who happen to be driving neartelephone poles. The blimp is creating a negative externality that influences thedrivers’ safety. Since the price charged by the advertising firm does not incorporate theexternality of distracting drivers, too much of this type of advertising is produced fromthe point of view of society as a whole.2. Compare and contrast the following three mechanisms for treating pollution externalities when the costs and benefits of abatement are uncertain: (a) an emissions fee, (b) an emissions standard, and (c) a system of transferable emissions permits.Since pollution is not reflected in the marginal cost of production, its emission createsan externality. Three policy tools can be used to reduce pollution: an emissions fee, anemissions standard, and a system of transferable permits. The choice between a feeand a standard will depend on the marginal cost and marginal benefit of reducingpollution. If small changes in abatement yield large benefits while adding little to cost,the cost of not reducing emissions is high. Thus, standards should be used. However, ifsmall changes in abatement yield little benefit while adding greatly to cost, the cost ofreducing emissions is high. Thus, fees should be used.A system of transferable emissions permits combines the features of fees and standardsto reduce pollution. Under this system, a standard is set and fees are used to transferpermits to the firm that values them the most (i.e., a firm with high abatement costs).However, the total number of permits can be incorrectly chosen. Too few permits willcreate excess demand, increasing price and inefficiently diverting resources to ownersof the permits. Typically, pollution control agencies implement one of threemechanisms, measure the results, reassess the success of their choice, then reset newlevels of fees or standards or select a new policy tool.3. When do externalities require government intervention, and when is such intervention unlikely to be necessary?Economic efficiency can be achieved without government intervention when theexternality affects a small number of people and when property rights are wellspecified. When the number of parties is small, the cost of negotiating an agreementamong the parties is small. Further, the amount of required information (i.e., the costsof and benefits to each party) is small. When property rights are not well specified,uncertainty regarding costs and benefits increases and efficient choices might not bemade. The costs of coming to an agreement, including the cost of delaying such anagreement, could be greater than the cost of government intervention, including theexpected cost of choosing the wrong policy instrument.4. An emissions fee is paid to the government, whereas an injurer who is sued and is held liable pays damages directly to the party harmed by an externality. What differences in the behavior of victims might you expect to arise under these two arrangements?When the price of an activity that generates an externality reflects social costs, anefficient level of the activity is maintained. The producer of the externality reduces (fornegative externalities) or increases (for positive externalities) activity away from(towards) efficient levels. If those who suffer from the externality are not compensated,they find that their marginal cost is higher (for negative externalities) or lower (forpositive externalities), in contrast to the situation in which they would be compensated.5. Why does free access to a common property resource generate an inefficient outcome?Free access to a resource means that the marginal cost to the user is less than the socialcost. The use of a common property resource by a person or firm excludes others fromusing it. For example, the use of water by one consumer restricts its use by another.Because private marginal cost is below social marginal cost, too much of the resource isconsumed by the individual user, creating an inefficient outcome.6. Public goods are both nonrival and nonexclusive. Explain each of these terms and state clearly how they differ from each other.A good is nonrival if, for any level of production, the marginal cost of providing the goodto an additional consumer is zero (although the production cost of an additional unitcould be greater than zero). A good is nonexclusive if it is impossible or very expensiveto exclude individuals from consuming it. Public goods are nonrival and nonexclusive.Commodities can be (1) exclusive and rival, (2) exclusive and nonrival, (3) nonexclusiveand rival, or (4) nonexclusive and nonrival. Most of the commodities discussed in thetext to this point have been of the first type. In this chapter, we focus on commodities ofthe last type.Nonrival refers to the production of a good or service for one more customer. It usuallyinvolves a production process with high fixed costs, such as the cost of building ahighway or lighthouse. (Remember that fixed cost depends on the period underconsideration: the cost of lighting the lamp at the lighthouse can vary over time, butdoes not vary with the number of consumers.) Nonexclusive refers to exchange, wherethe cost of charging consumers is prohibitive. Incurring the cost of identifyingconsumers and collecting from them would result in losses. Some economists focus onthe nonexclusion property of public goods because it is this characteristic that poses themost significant problems for efficient provision.7. Public television is funded in part by private donations, even though anyone with a television set can watch for free. Can you explain this phenomenon in light of the free rider problem?The free-rider problem refers to the difficulty of excluding persons from consuming anonexclusive commodity. Non-paying consumers can “free-ride” on commoditiesprovided by paying customers. Public television is funded in part by contributions.Some viewers contribute, but most watch without paying, hoping that someone else willpay so they will not. To combat this problem these stations (1) ask consumers to assesstheir true willingness to pay, then (2) ask consumers to contribute up to this amount,and (3) attempt to make everyone else feel guilty for free-riding.8. Explain why the median voter outcome need not be efficient when majority rule voting determines the level of public spending.The median voter is the citizen with the middle preference: half the voting population ismore strongly in favor of the issue and half is more strongly opposed to the issue.Under majority-rule voting, where each citizen’s vote is weighted equally, the preferredspending level on public-goods provision of the median voter will win an electionagainst any other alternative.However, majority rule is not necessarily efficient, because it weights each citizen’spreferences equally. For an efficient outcome, we would need a system that measuresand aggregates the willingness to pay of those citizens consuming the public good.Majority rule is not this system. However, as we have seen in previous chapters,majority rule is equitable in the sense that all citizens are treated equally. Thus, weagain find a trade-off between equity and efficiency.1. A number of firms located in the western portion of a town after single-family residences took up the eastern portion. Each firm produces the same product and, in the process, emits noxious fumes that adversely affect the residents of the community.a. Why is there an externality created by the firms?Noxious fumes created by firms enter the utility function of residents. We can assumethat the fumes decrease the utility of the residents (i.e., they are a negative externality)and lower property values.b. Do you think that private bargaining can resolve the problem with the externality?Explain.If the residents anticipated the location of the firms, housing prices should reflect thedisutility of the fumes; the externality would have been internalized by the housingmarket in housing prices. If the noxious fumes were not anticipated, privatebargaining could resolve the problem of the externality only if there are a relativelysmall number of parties (both firms and families) and property rights are well specified.Private bargaining would rely on each family’s willingness to pay for air quality, buttruthful revelation might not be possible. All this will be complicated by theadaptability of the production technology known to the firms and the employmentrelations between the firms and families. It is unlikely that private bargaining willresolve the problem.c. How might the community determine the efficient level of air quality?The community could determine the economically efficient level of air quality byaggregating the families’ willingne ss to pay and equating it with the marginal cost ofpollution reduction. Both steps involve the acquisition of truthful information.2. A computer programmer lobbies against copyrighting software. He argues that everyone should benefit from innovative programs written for personal computers and that exposure to a wide variety of computer programs will inspire young programmers to create even more innovative programs. Considering the marginal social benefits possibly gained by his proposal, do you agree with the programmer’s position?Computer software as information is a classic example of a public good. Since it can becostlessly copied, the marginal cost of providing software to an additional user is nearzero. Therefore, software is nonrival. (The fixed costs of creating software are high, butthe variable costs are low.) Furthermore, it is expensive to exclude consumers fromcopying and using software because copy protection schemes are available only at highcost or high inconvenience to users. Therefore, software is also nonexclusive. As bothnonrival and nonexclusive, computer software suffers the problems of public goodsprovision: the presence of free-riders makes it difficult or impossible for markets toprovide the efficient level of software. Rather than regulating this market directly, thelegal system guarantees property rights to the creators of software. If copyrightprotection were not enforced, it is likely that the software market would collapse.Therefore, we do not agree with the computer programmer.3. Four firms located at different points on a river dump various quantities of effluent into it. The effluent adversely affects the quality of swimming for homeowners who live downstream. These people can build swimming pools to avoid swimming in the river, and firms can purchase filters that eliminate harmful chemicals in the material that is dumped in the river. As a policy advisor for a regional planning organization, how would you compare and contrast the following options for dealing with the harmful effect of the effluent:a. An equal-rate effluent fee on firms located on the river.First, one needs to know the value to homeowners of swimming in the river. Thisinformation can be difficult to obtain, because homeowners will have an incentive tooverstate this value. As an upper boundary, if there are no considerations other thanswimming, one could use the cost of building swimming pools, either a pool for eachhomeowner or a public pool for all homeowners. Next, one needs to know the marginalcost of abatement. If the abatement technology is well understood, this informationshould be readily obtainable. If the abatement technology is not understood, anestimate based on the firms’ knowledge must be used.The choice of a policy tool will depend on the marginal benefits and costs of abatement.If firms are charged an equal-rate effluent fee, the firms will reduce effluents to thepoint where the marginal cost of abatement is equal to the fee. If this reduction is nothigh enough to permit swimming, the fee could be increased. Alternatively, revenuefrom the fees could be to provide swimming facilities, reducing the need for effluentreduction.b. An equal standard per firm on the level of effluent each firm can dump.Standards will be efficient only if the policy maker has complete information regardingthe marginal costs and benefits of abatement. Moreover, the standard will notencourage firms to reduce effluents further when new filtering technologies becomeavailable.c. A transferable effluent permit system, in which the aggregate level of effluent isfixed and all firms receive identical permits.A transferable effluent permit system requires the policy maker to determine theefficient effluent standard. Once the permits are distributed and a market develops,firms with a higher cost of abatement will purchase permits from firms with lowerabatement costs. However, unless permits are sold initially, rather than merelydistributed, no revenue will be generated for the regional organization.4. Recent social trends point to growing intolerance of smoking in public areas. Many people point out the negative effects of “second hand” smoke. If you are a smoker and you wish to continue smoking despite tougher anti smoking laws, describe the effect of the following legislative proposals on your behavior. As a result of these programs, do you, the individual smoker, benefit? Does society benefit as a whole?Since smoking in public areas is similar to polluting the air, the programs proposedhere are similar to those examined for air pollution. A bill to lower tar and nicotinelevels is similar to an emissions standard, and a tax on cigarettes is similar to anemissions fee. Requiring a smoking permit is similar to a system of emissions permits,assuming that the permits would not be transferable. The individual smoker in all ofthese programs is being forced to internalize the externality of “second-hand” smokeand will be worse off. Society will be better off if the benefits of a particular proposaloutweigh the cost of implementing that proposal. Unfortunately, the benefits ofreducing second-hand smoke are uncertain, and assessing those benefits is costly.a. A bill is proposed that would lower tar and nicotine levels in all cigarettes.The smoker will most likely try to maintain a constant level of consumption of nicotine,and will increase his or her consumption of cigarettes. Society may not benefit fromthis plan if the total amount of tar and nicotine released into the air is the same.b. A tax is levied on each pack of cigarettes sold.Smokers might turn to cigars, pipes, or might start rolling their own cigarettes. Theextent of the effect of a tax on cigarette consumption depends on the elasticity ofdemand for cigarettes. Again, it is questionable whether society will benefit.c. Smokers would be required to carry smoking permits at all times. These permitswould be sold by the government.Smoking permits would effectively transfer property rights to clean air from smokers tonon-smokers. The main obstacle to society benefiting from such a proposal would bethe high cost of enforcing a smoking permits system.5. A beekeeper lives adjacent to an apple orchard. The orchard owner benefits from thebees because each hive pollinates about one acre of apple trees. The orchard owner pays nothing for this service, however, because the bees come to the orchard without his having to do anything. There are not enough bees to pollinate the entire orchard, and the orchard owner must complete the pollination by artificial means, at a cost of $10 per acre of trees.Beekeeping has a marginal cost of MC = 10 + 2Q, where Q is the number of beehives.Each hive yields $20 worth of honey.a. How many beehives will the beekeeper maintain?The beekeeper maintains the number of hives that maximizes profits, when marginalrevenue is equal to marginal cost. With a constant marginal revenue of $20 (there is noinformation that would lead us to believe that the beekeeper has any market power)and a marginal cost of 10 + 2Q:20 = 10 + 2Q, or Q = 5.b. Is this the economically efficient number of hives?If there are too few bees to pollinate the orchard, the farmer must pay $10 per acre forartificial pollination. Thus, the farmer would be willing to pay up to $10 to thebeekeeper to maintain each additional hive. So, the marginal social benefit, MSB, ofeach additional hive is $30, which is greater than the marginal private benefit of $20.Assuming that the private marginal cost is equal to the social marginal cost, we setMSB = MC to determine the efficient number of hives:30 = 10 + 2Q, or Q = 10.Therefore, the beekeeper’s private choice of Q = 5 is not the socially efficient number ofhives.c. What changes would lead to the more efficient operation?The most radical change that would lead to more efficient operations would be themerger of the farmer’s business with the beekeeper’s business. This merger wouldinternalize the positive externality of bee pollination. Short of a merger, the farmerand beekeeper should enter into a contract for pollination services.7. Reconsider the common resource problem as given by Example 18.5. Suppose that crawfish popularity continues to increase, and that the demand curve shifts from C = 0.401 - 0.0064F to C = 0.50 - 0.0064F. How does this shift in demand affect the actual crawfish catch, the efficient catch, and the social cost of common access? (Hint: Use the marginal social cost and private cost curves given in the example.)The relevant information is now the following:Demand: C = 0.50 - 0.0064FMSC: C = -5.645 + 0.6509F.With an increase in demand, the demand curve for crawfish shifts upward, intersectingthe price axis at $0.50. The private cost curve has a positive slope, so additional effortmust be made to increase the catch. Since the social cost curve has a positive slope, thesocially efficient catch also increases. We may determine the socially efficient catch bysolving the following two equations simultaneously:0.50 - 0.0064F = -5.645 + 0.6509F, or F* = 9.35.To determine the price that consumers are willing to pay for this quantity, substituteF* into the equation for marginal social cost and solve for C:C = -5.645 + (0.6509)(9.35), or C = $0.44.Next, find the actual level of production by solving these equations simultaneously:Demand: C = 0.50 - 0.0064FMPC: C = -0.357 + 0.0573F0.50 - 0.0064F = -0.357 + 0.0573F, or F** = 13.45.To determine the price that consumers are willing to pay for this quantity, substituteF** into the equation for marginal private cost and solve for C:C = -0.357 + (0.0573)(13.45), or C = $0.41.Notice that the marginal social cost of producing 13.45 units isMSC = -5.645 +(0.6509)(13.45) = $3.11.With the increase in demand, the social cost is the area of a triangle with a base of 4.1million pounds (13.45 - 9.35) and a height of $2.70 ($3.11 - 0.41), or $5,535,000 morethan the social cost of the original demand.8. The Georges Bank, a highly productive fishing area off New England, can be divided into two zones in terms of fish population. Zone 1 has the higher population per square mile but is subject to severe diminishing returns to fishing effort. The daily fish catch (in tons) in Zone 1 isF 1 = 200(X1) - 2(X1) 2where X1is the number of boats fishing there. Zone 2 has fewer fish per mile but is larger, and diminishing returns are less of a problem. Its daily fish catch isF 2 = 100(X2) - (X2) 2where X2is the number of boats fishing in Zone 2. The marginal fish catch MFC in each zone can be represented asMFC1 = 200 - 4(X1) MFC2= 100 - 2(X2).There are 100 boats now licensed by the U.S. government to fish in these two zones. The fish are sold at $100 per ton. The total cost (capital and operating) per boat is constant at $1,000 per day. Answer the following questions about this situation.a. If the boats are allowed to fish where they want, with no government restriction,how many will fish in each zone? What will be the gross value of the catch?Without restrictions, the boats will divide themselves so that the average catch (AF 1and AF 2) for each boat is equal in each zone. (If the average catch in one zone is greaterthan in the other, boats will leave the zone with the lower catch for the zone with thehigher catch.) We solve the following set of equations:AF 1 = AF 2 and X 1 + X 2 = 100 where 11121120022002AF X X X X =-=- and 222222100100AF X X X X =-=-. Therefore, AF 1 = AF 2 implies200 - 2X 1 = 100 - X 2,200 - 2(100 - X 2) = 100 - X 2, or X 21003= and 320031001001=⎪⎭⎫ ⎝⎛-=X . Find the gross catch by substituting the value of X 1 and X 2 into the catch equations:()(),,,,F 444488983331332002320020021=-=⎪⎭⎫ ⎝⎛-⎪⎭⎫ ⎝⎛= and ().,,,F 2222111133333100310010022=-=⎪⎭⎫ ⎝⎛-⎪⎭⎫ ⎝⎛= The total catch is F 1 + F 2 = 6,666. At the price of $100 per ton, the value of the catch is$666,600. The average catch for each of the 100 boats in the fishing fleet is 66.66 tons.To determine the profit per boat, subtract total cost from total revenue:π = (100)(66.66) - 1,000, or π = $5,666.Total profit for the fleet is $566,000.b. If the U.S. government can restrict the boats, how many should be allocated to eachzone? What will the gross value of the catch be? Assume the total number of boats remains at 100.Assume that the government wishes to maximize the net social value of the fish catch,i.e., the difference between the total social benefit and the total social cost. Thegovernment equates the marginal fish catch in both zones, subject to the restrictionthat the number of boats equals 100:MFC 1 = MFC 2 and X 1 + X 2 = 100,MFC 1 = 200 - 4X 1 and MFC 2 = 100 - 2X 2.Setting MFC 1 = MFC 2 implies:200 - 4X 1 = 100 - 2X 2, or 200 - 4(100 - X 2) = 100 - 2X 2, or X 2 = 50 andX 1 = 100 - 50 = 50.Find the gross catch by substituting X 1 and X 2 into the catch equations:F 1 = (200)(50) - (2)(502) = 10,000 - 5,000 = 5,000 andChapter 18: Externalities and Public Goods242 F 2 = (100)(50) - 502 = 5,000 - 2,500 = 2,500.The total catch is equal to F 1 + F 2 = 7,500. At the market price of $100 per ton, thevalue of the catch is $750,000. Total profit is $650,000. Notice that the profits are notevenly divided between boats in the two zones. The average catch in Zone A is 100 tonsper boat, while the average catch in Zone B is 50 tons per boat. Therefore, fishing inZone A yields a higher profit for the individual owner of the boat.c. If additional fishermen want to buy boats and join the fishing fleet, should agovernment wishing to maximize the net value of the fish catch grant them licenses to do so? Why or why not?To answer this question, first determine the profit-maximizing number of boats in eachzone. Profits in Zone A areππA A X X X X X =--=-1002002100019000200112112b g e j,,, or . To determine the change in profit with a change in X 1 take the first derivative of theprofit function with respect to X 1:d dX X A π1119000400=-,. To determine the profit-maximizing level of output, setd dX A π1equal to zero and solve for X 1:19,000 - 400X 1 = 0, or X 1 = 47.5.Substituting X 1 into the profit equation for Zone A gives: ()()()()()()()()250,451$5.47000,15.4725.472001002=--=A π.For Zone B follow a similar procedure. Profits in Zone B areππB B X X X X X =--=-100100100090002002222222b g e j,,, or . Taking the derivative of the profit function with respect to X 2 givesd X B π229000200=-,. Setting d B π2equal to zero to find the profit-maximizing level of output gives 9,000 - 200X 2 = 0, or X 2 = 45.Substituting X 2 into the profit equation for Zone B gives:πB = (100)((100)(45) - 452) - (1,000)(45) = $202,500.Total profit from both zones is $653,750, with 47.5 boats in Zone A and 45 boats in ZoneB. Because each additional boat above 92.5 decreases total profit, the governmentshould not grant any more licenses.。
===平狄克《微观经济学》第六版习题答案_修改版1
===平狄克《微观经济学》第六版习题答案_修改版1第一章Array复习题1.多行业。
2对我们理解现实情况没有任何帮助。
3限制将改变市场的均衡。
A批评其破坏了市场的竞争性——是实证分析。
B被损坏——是实证分析。
4.由于两个市场在空间上是分离的,为零,则可以在Oklahoma购买汽油,到New Jersey补运输成本则不存在套利机会。
5教育费用提高了。
6圆贬值,持有美圆的消费者将面对较以前提高的价格。
第二章复习题1.假设供给曲线固定,练习题 1.a.E Q Q P PP Q Q P DD D D D ==.P = 80, E d =–0.4 P = 100, E d =–0.56b.E Q Q P PP Q Q P SS S S S ==.P = 80, E s =0.5 P = 100, E s =0.56c.均衡价格和数量为$100 ,18 million.d.价格定在80$,需求为20 million.,供给为16 million.,相差4 million. 2.Q S = 1,800 + 240P Q D = 2,580 - 194P .'Q D = (2,580 - 194P ) + 200 = 2,780 - 194P1,800 + 240P = 2,780 - 194P , or 434P = 980, or P* = $2.26 per bushel.Q S = 1,800 + (240)(2.26) = 2,342 Q D = 2,780 - (194)(2.26) = 2,342.3. a.100 - 5P = 50 + 5P , P = $500.Q D = 100 - (5)(5) = 75 Q S = 50 + (5)(5) = 75.租金在500美金时,750,000公寓可以被租掉。
当租金被控制在100美金时,供给量将达到550,000 (Q S = 50 + (5)(100) = 550),比管制前减少了200,000。
平狄克《微观经济学》课后答案 2
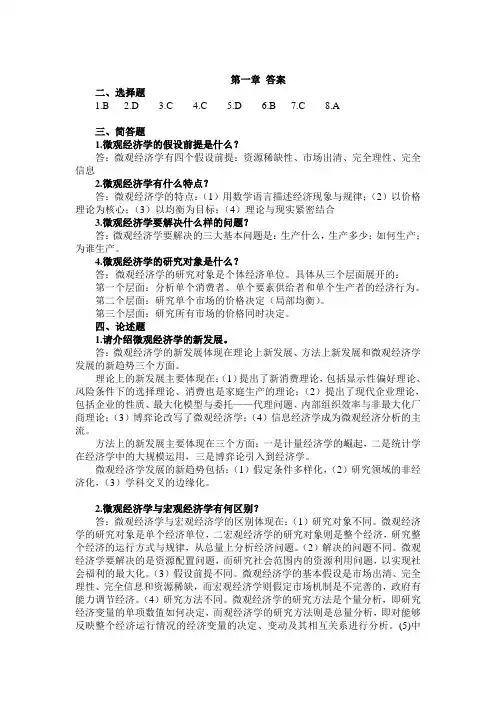
CHAPTER 2THE BASICS OF SUPPLY AND DEMANDThis chapter departs from the standard treatment of supply and demand basics found in most other intermediate microeconomics textbooks by discussing some of the world’s most important markets (wheat, gasoline, and automobiles) and teaching students how to analyze these markets with the tools of supply and demand.Although most of the discussion of economic theory in this chapter serves as a review, the real-world applications of this theory will be enlightening for students, particularly the material covered in Section 2.5 and Examples 2.5 and 2.6.Some problems plague the understanding of supply and demand analysis. One of the most common sources of confusion is between movements along the demand curve and shifts in demand. Through a discussion of the ceteris paribus assumption, stress that when representing a demand function (either with a graph or an equation), all other variables are held constant. Movements along the demand curve occur only with changes in price. As the omitted factors change, the entire demand function shifts. Students may also find a review of how to solve two equations with two unknowns helpful.To stress the quantitative aspects of the demand curve to students, make the distinction between quantity demanded as a function of price, Q = D(P), and the inverse demand function, where price is a function of the quantity demanded, P = D-1(Q). This may clarify the positioning of price on the Y-axis and quantity on the X-axis.Students may also question how the market adjusts to a new equilibrium. One simple mechanism is the partial-adjustment cobweb model. A discussion of the cobweb model (based on traditional corn-hog cycle or any other example) adds a certain realism to the discussion and is much appreciated by students.Although this chapter introduces demand, income, and cross-price elasticities, you may find it more appropriate to return to income and cross-price elasticity after demand elasticity is reintroduced in Chapter 4. If you wait, you should postpone Exercise (7) until income and cross-price elasticities are discussed.1. Suppose that unusually hot weather causes the demand curve for ice cream to shift to the right. Why will the price of ice cream rise to a new market-clearing level?Assume the supply curve is fixed. The unusually hot weather will cause a rightwardshift in the demand curve, creating short-run excess demand at the current price.Consumers will begin to bid against each other for the ice cream, putting upwardpressure on the price. The price of ice cream will rise until the quantity demanded andthe quantity supplied are equal.4. Why do long-run elasticities of demand differ from short-run elasticities? Consider two goods: paper towels and televisions. Which is a durable good? Would you expect the price elasticity of demand for paper towels to be larger in the short-run or in the long-run? Why? What about the price elasticity of demand for televisions?Long-run and short-run elasticities differ based on how rapidly consumers respond toprice changes and how many substitutes are available. If the price of paper towels, anon-durable good, were to increase, consumers might react only minimally in the shortrun. In the long run, however, demand for paper towels would be more elastic as newsubstitutes entered the market (such as sponges or kitchen towels). In contrast, thequantity demanded of durable goods, such as televisions, might change dramatically inthe short run following a price change. For example, the initial influence of a priceincrease for televisions would cause consumers to delay purchases because durablegoods are built to last longer. Eventually consumers must replace their televisions asthey wear out or become obsolete; therefore, we expect the demand for durables to bemore elastic in the long run.5. Explain why, for many goods, the long-run price elasticity of supply is larger than the short-run elasticity.The elasticity of supply is the percentage change in the quantity supplied divided by thepercentage change in price. An increase in price induces an increase in the quantitysupplied by firms. Some firms in some markets may respond quickly and cheaply toprice changes. However, other firms may be constrained by their production capacity inthe short run. The firms with short-run capacity constraints will have a short-runsupply elasticity that is less elastic. However, in the long run all firms can increasetheir scale of production and thus have a larger long-run price elasticity.6. Suppose the government regulates the prices of beef and chicken and sets them below their market-clearing levels. Explain why shortages of these goods will develop and what factors will determine the sizes of the shortages. What will happen to the price of pork? Explain briefly.If the price of a commodity is set below its market-clearing level, the quantity that firmsare willing to supply is less than the quantity that consumers wish to purchase. Theextent of the excess demand implied by this response will depend on the relativeelasticities of demand and supply. For instance, if both supply and demand are elastic,the shortage is larger than if both are inelastic. Factors such as the willingness ofconsumers to eat less meat and the ability of farmers to change the size of their herdsand produce less determine these elasticities and influence the size of excess demand.Rationing will result in situations of excess demand when some consumers are unableto purchase the quantities desired. Customers whose demands are not met willattempt to purchase substitutes, thus increasing the demand for substitutes and raisingtheir prices. If the prices of beef and chicken are set below market-clearing levels, theprice of pork will rise.7. In a discussion of tuition rates, a university official argues that the demand for admission is completely price inelastic. As evidence she notes that while the university has doubled its tuition (in real terms) over the past 15 years, neither the number nor quality of students applying has decreased. Would you accept this argument? Explain briefly. (Hint: The official makes an assertion about the demand for admission, but does she actually observe a demand curve? What else could be going on?)If demand is fixed, the individual firm (a university) may determine the shape of thedemand curve it faces by raising the price and observing the change in quantity sold.The university official is not observing the entire demand curve, but rather only theequilibrium price and quantity over the last 15 years. If demand is shifting upward, assupply shifts upward, demand could have any elasticity. (See Figure 2.7, for example.)Demand could be shifting upward because the value of a college education hasincreased and students are willing to pay a high price for each opening. More marketc. A drought shrinks the apple crop to one-third its normal size.The supply curve would shift in, causing the equilibrium price to rise and theequilibrium quantity to fall.d. Thousands of college students abandon the academic life to become apple pickers.The increased supply of apple pickers will lead to a decrease in the cost of bringingapples to market. The decreased cost of bringing apples to market results in anoutward shift of the supply curve of apples and causes the equilibrium price to fall andthe equilibrium quantity to increase.e. Thousands of college students abandon the academic life to become apple growers.This would result in an outward shift of the supply curve for apples, causing theequilibrium price to fall and the equilibrium quantity to increase.1. Consider a competitive market for which the quantities demanded and supplied (per year) at various prices are given as follows:Price($)Demand (millions) Supply (millions) 6022 14 8020 16 10018 18 12016 20 a. Calculate the price elasticity of demand when the price is $80. When the price is$100.We know that the price elasticity of demand may be calculated using equation 2.1 fromthe text:E Q Q P PP Q Q PD D D D D ==∆∆∆∆. With each price increase of $20, the quantity demanded decreases by 2. Therefore,∆∆Q P DF HG I K J =-=-22001.. At P = 80, quantity demanded equals 20 andE D =F HG I KJ -=-802001040...b g Similarly, at P = 100, quantity demanded equals 18 andE D =F HG I K J -=-1001801056...b g b. Calculate the price elasticity of supply when the price is $80. When the price is $100.The elasticity of supply is given by:E Q Q P P Q Q PS S S S S ==∆∆∆∆. With each price increase of $20, quantity supplied increases by 2. Therefore,∆∆Q SF HG I K J ==22001.. At P = 80, quantity supplied equals 16 andE S =F HG I KJ =80160105..bg .Similarly, at P = 100, quantity supplied equals 18 andE S=FH GIK J= 1001801056...bgc. What are the equilibrium price and quantity?The equilibrium price and quantity are found where the quantity supplied equals thequantity demanded at the same price. As we see from the table, the equilibrium priceis $100 and the equilibrium quantity is 18 million.d. Suppose the government sets a price ceiling of $80. Will there be a shortage, and, ifso, how large will it be?With a price ceiling of $80, consumers would like to buy 20 million, but producers willsupply only 16 million. This will result in a shortage of 4 million.2. Refer to Example 2.3 on the market for wheat. Suppose that in 1985 the Soviet Union hadbought an additional 200 million bushels of U.S. wheat. What would the free market price of wheat have been and what quantity would have been produced and sold by U.S. farmers?The following equations describe the market for wheat in 1985:QS= 1,800 + 240PandQD= 2,580 - 194P.If the Soviet Union had purchased an additional 200 million bushels of wheat, the newdemand curve 'Q D, would be equal to Q ED + 200, or'Q D= (2,580 - 194P) + 200 = 2,780 - 194PEquating supply and the new demand, we may determine the new equilibrium price,1,800 + 240P = 2,780 - 194P, or434P = 980, or P* = $2.26 per bushel.To find the equilibrium quantity, substitute the price into either the supply or demandequation, e.g.,QS= 1,800 + (240)(2.26) = 2,342andQD= 2,780 - (194)(2.26) = 2,342.3. The rent control agency of New York City has found that aggregate demand is QD= 100 - 5P measured in tens of thousands of apartments, and price, the average monthly rental rate, P, with quantity measured in hundreds of dollars. The agency also noted that the increase in Q at lower P results from more three-person families coming into the city from Long Island and demanding apartments. The city’s board of realtors acknowledges that this is agood demand estimate and has shown that supply is QS= 50 + 5P.a. If both the agency and the board are right about demand and supply, what is the freemarket price? What is the change in city population if the agency sets a maximum average monthly rental of $100, and all those who cannot find an apartment leave the city?To find the free market price for apartments, set supply equal to demand:100 - 5P = 50 + 5P, or P = $500.Substituting the equilibrium price into either the demand or supply equation todetermine the equilibrium quantity:QD= 100 - (5)(5) = 75andQ S = 50 + (5)(5) = 75.We find that at the rental rate of $500, 750,000 apartments are rented.If the rent control agency sets the rental rate at $100, the quantity supplied would thenbe 550,000 (Q S = 50 + (5)(100) = 550), a decrease of 200,000 apartments from the freemarket equilibrium. (Assuming three people per family per apartment, this wouldimply a loss of 600,000 people.) At the $100 rental rate, the demand for apartments is950,000 units, and the resultant shortage is 400,000 units.b. Suppose the agency bows to the wishes of the board and sets a rental of $900 permonth on all apartments to allow landlords a “fair” rate of return. If 50 percent of any long-run increases in apartment offerings comes from new construction, how many apartments are constructed?At a rental rate of $900, the supply of apartments would be 50 + 5(9) = 95, or 950,000units, which is an increase of 200,000 units over the free market equilibrium.Therefore, (0.5)(200,000) = 100,000 units would be constructed. Note, however, thatsince demand is only 550,000 units, 400,000 units would go unrented.4. Much of the demand for U.S. agricultural output has come from other countries. From Example 2.3, total demand is Q = 3,550 - 266P . In addition, we are told that domestic demand is Q d = 1,000 - 46P . Domestic supply is Q S = 1,800 + 240P . Suppose the export demand for wheat falls by 40 percent.a. U.S. farmers are concerned about this drop in export demand. What happens to thefree market price of wheat in the United States? Do the farmers have much reason to worry?Given total demand, Q = 3,550 - 266P , and domestic demand, Q d = 1,000 - 46P , we maysubtract and determine export demand, Q e = 2,550 - 220P .The initial market equilibrium price is found by setting total demand equal to supply:3,550 - 266P - 1,800 + 240P , orP = $3.46.There are two different ways to handle the 40 percent drop in demand. One way is toassume that the demand curve shifts down so that at all prices demand decreases by 40percent. The second way is to rotate the demand curve in a clockwise manner aroundthe vertical intercept (i.e. in the current case the demand curve would becomeQ = 3,550 - 159.6P ). We apply the former approach in the solution to exercises here.Regardless of the two approaches, the effect on prices and quantity will be qualitativelythe same, but will differ quantitatively.Therefore, if export demand decreases by 40 percent, total demand becomesQ D = Q d + 0.6Q e = 1,000 - 46P + (0.6)(2,550 - 220P ) = 2,530 - 178P .Equating total supply and total demand,1,800 + 240P = 2,530 - 178P , orP = $1.75,which is a significant drop from the market-clearing price of $3.46 per bushel. At thisprice, the market-clearing quantity is 2,219 million bushels. Total revenue hasdecreased from $9.1 billion to $3.9 billion. Most farmers would worry.b. Now suppose the U.S. government wants to buy enough wheat each year to raise theprice to $3.00 per bushel. Without export demand, how much wheat would the government have to buy each year? How much would this cost the government?With a price of $3, the market is not in equilibrium. Demand = 1000 - 46(3) = 862.Supply = 1800 + 240(3) = 2,520, and excess supply is therefore 2,520 - 862 = 1,658. Thegovernment must purchase this amount to support a price of $3, and will spend $3(1.66million) = $5.0 billion per year.5. In Example 2.6 we examined the effect of a 20 percent decline in copper demand on the price of copper, using the linear supply and demand curves developed in Section 2.5. Suppose the long-run price elasticity of copper demand were -0.4 instead of -0.8.a. Assuming, as before, that the equilibrium price and quantity are P* = 75 cents perpound and Q* = 7.5 million metric tons per year, derive the linear demand curve consistent with the smaller elasticity.Following the method outlined in Section 2.5, we solve for a and b in the demandequation Q D = a - bP . First, we know that for a linear demand function E b P D =-F H G I KJ *. Here E D = -0.4 (the long-run price elasticity), P* = 0.75 (the equilibrium price), and Q* =7.5 (the equilibrium quantity). Solving for b , -=-F H I K0407575...b , or b = 4. To find the intercept, we substitute for b , Q D (= Q *), and P (= P *) in the demandequation:7.5 = a - (4)(0.75), or a = 10.5.The linear demand equation consistent with a long-run price elasticity of -0.4 isthereforeQ D = 10.5 - 4P .b. Using this demand curve, recalculate the effect of a 20 percent decline in copperdemand on the price of copper.The new demand is 20 percent below the original (using our convention that the wholedemand curve is shifted down by 20 percent):'Q D =-=-0810548432....a f a fP P . Equating this to supply,8.4 - 3.2P = -4.5 + 16P , orP = 0.672.With the 20 percent decline in the demand, the price of copper falls to 67.2 cents perpound.6. Example 2.7 analyzes the world oil market. Using the data given in that example,a. Show that the short-run demand and competitive supply curves are indeed given byD = 24.08 - 0.06PS C = 11.74 + 0.07P .First, considering non-OPEC supply:S c = Q * = 13.With E S = 0.10 and P * = $18, E S = d (P */Q *) implies d = 0.07.Substituting for d , S c , and P in the supply equation, c = 11.74 and S c = 11.74 + 0.07P .Similarly, since Q D = 23, E D = -b (P */Q *) = -0.05, and b = 0.06. Substituting for b , Q D = 23, and P = 18 in the demand equation gives 23 = a - 0.06(18), so that a = 24.08.Hence Q D = 24.08 - 0.06P .b. Show that the long-run demand and competitive supply curves are indeed given byD = 32.18 - 0.51PS C = 7.78 + 0.29P .As above, E S = 0.4 and E D = -0.4: E S = d (P */Q *) and E D = -b(P*/Q*), implying 0.4 = d (18/13)and -0.4 = -b (18/23). So d = 0.29 and b = 0.51.Next solve for c and a :S c = c + dP and Q D = a - bP , implying 13 = c + (0.29)(18) and 23 = a - (0.51)(18).So c = 7.78 and a = 32.18.c. Use this model to calculate what would happen to the price of oil in the short-runand the long-run if OPEC were to cut its production by 6 billion barrels per year.With OPEC’s supply reduced from 10 bb/yr to 4 bb/yr, add this lower supply of 4 bb/yr to the short-run and long-run supply equations:S c ' = 4 + S c = 11.74 + 4 + 0.07P = 15.74 + 0.07P and S " = 4 + S c = 11.78 + 0.29P .These are equated with short-run and long-run demand, so that:15.74 + 0.07P = 24.08 - 0.06P ,implying that P = $64.15 in the short run; and11.78 + 0.29P = 32.18 - 0.51P ,implying that P = $24.29 in the long run.7.Refer to Example 2.8, which analyzes the effects of price controls on natural gas. a. Using the data in the example, show that the following supply and demand curvesdid indeed describe the market in 1975:Supply: Q = 14 + 2P G + 0.25P ODemand: Q = -5P G + 3.75P Owhere P G and P O are the prices of natural gas and oil, respectively. Also, verify that if the price of oil is $8.00, these curves imply a free market price of $2.00 for natural gas.To solve this problem, we apply the analysis of Section 2.5 to the definition of cross-price elasticity of demand given in Section 2.3. For example, the cross-price-elasticity of demand for natural gas with respect to the price of oil is:E Q P P Q GO G O G G=F HG I K J FH GI KJ ∆∆. ∆∆Q P G O F H G IK J is the change in the quantity of natural gas demanded, because of a small change in the price of oil. For linear demand equations,∆∆Q P G O F H G I K J is constant. If we represent demand as:Q G = a - bP G + eP O(notice that income is held constant), then∆∆Q P G OF HG I K J = e . Substituting this into the cross-price elasticity, E e P Q PO O G=F H G I K J **, where P O * and Q G * are the equilibrium price and quantity. We know that P O * = $8 and Q G* = 20 trillion cubic feet (Tcf). Solving for e , 15820.=F H G I KJ e , or e = 3.75. Similarly, if the general form of the supply equation is represented as:Q G = c + dP G + gP O , the cross-price elasticity of supply is g P Q OG**F H G I K J , which we know to be 0.1. Solving for g , ⎪⎭⎫ ⎝⎛=2081.0g , or g = 0.25. The values for d and b may be found with equations 2.5a and 2.5b in Section 2.5. Weknow that E S = 0.2, P* = 2, and Q* = 20. Therefore,⎪⎭⎫ ⎝⎛=2022.0d , or d = 2.Also, E D = -0.5, so⎪⎭⎫ ⎝⎛=-2025.0b , or b = -5. By substituting these values for d, g, b , and e into our linear supply and demandequations, we may solve for c and a :20 = c + (2)(2) + (0.25)(8), or c = 14,and20 = a - (5)(2) + (3.75)(8), or a = 0.If the price of oil is $8.00, these curves imply a free market price of $2.00 for naturalgas. Substitute the price of oil in the supply and demand curves to verify theseequations. Then set the curves equal to each other and solve for the price of gas.14 + 2P G + (0.25)(8) = -5P G + (3.75)(8), 7P G = 14, orP G = $2.00.b. Suppose the regulated price of gas in 1975 had been $1.50 per million cubic feet,instead of $1.00. How much excess demand would there have been?With a regulated price of $1.50 for natural gas and a price of oil equal to $8.00 perbarrel,Demand: Q D = (-5)(1.50) + (3.75)(8) = 22.5, andSupply: Q S = 14 + (2)(1.5) + (0.25)(8) = 19.With a supply of 19 Tcf and a demand of 22.5 Tcf, there would be an excess demand of3.5 Tcf.c. Suppose that the market for natural gas had not been regulated. If the price of oilhad increased from $8 to $16, what would have happened to the free market price of natural gas?If the price of natural gas had not been regulated and the price of oil had increasedfrom $8 to $16, thenDemand: Q D = -5P G + (3.75)(16) = 60 - 5P G , andSupply: Q S = 14 + 2P G + (0.25)(16) = 18 + 2P G .Equating supply and demand and solving for the equilibrium price,18 + 2P G = 60 - 5P G , or P G = $6.The price of natural gas would have tripled from $2 to $6.。
(NEW)曼昆《经济学原理(微观经济学分册)》(第6版)课后习题详解

目 录第1篇 导 言第1章 经济学十大原理第2章 像经济学家一样思考第3章 相互依存性与贸易的好处第2篇 市场如何运行第4章 供给与需求的市场力量第5章 弹性及其应用第6章 供给、需求与政府政策第3篇 市场和福利第7章 消费者、生产者与市场效率第8章 应用:赋税的代价第9章 应用:国际贸易第4篇 公共部门经济学第10章 外部性第11章 公共物品和公共资源第12章 税制的设计第5篇 企业行为与产业组织第13章 生产成本第14章 竞争市场上的企业第15章 垄 断第16章 垄断竞争第17章 寡 头第6篇 劳动市场经济学第18章 生产要素市场第19章 收入与歧视第20章 收入不平等与贫困第7篇 深入研究的论题第21章 消费者选择理论第22章 微观经济学前沿第1篇 导 言第1章 经济学十大原理一、概念题1.稀缺性(scarcity)答:经济学研究的问题和经济物品都是以稀缺性为前提的。
稀缺性指在给定的时间内,相对于人的需求而言,经济资源的供给总是不足的,也就是资源的有用性与有限性。
人类消费各种物品的欲望是无限的,满足这种欲望的物品,有的可以不付出任何代价而随意取得,称之为自由物品,如阳光和空气;但绝大多数物品是不能自由取用的,因为世界上的资源(包括物质资源和人力资源)是有限的,这种有限的、为获取它必须付出某种代价的物品,称为“经济物品”。
正因为稀缺性的客观存在,地球上就存在着资源的有限性和人类的欲望与需求的无限性之间的矛盾。
经济学的一个重要研究任务就是:“研究人们如何进行抉择,以便使用稀缺的或有限的生产性资源(土地、劳动、资本品如机器、技术知识)来生产各种商品,并把它们分配给不同的社会成员进行消费。
”也就是从经济学角度来研究使用有限的资源来生产什么、如何生产和为谁生产的问题。
2.经济学(economics)答:经济学是研究如何将稀缺的资源有效地配置给相互竞争的用途,以使人类的欲望得到最大限度满足的科学。
时下经常见诸国内报刊文献的“现代西方经济学”一词,大多也都在这个意义上使用。
(完整版)微观经济学课后习题答案
第一章答案二、选择题1.B2.D3.C4.C5.D6.B7.C8.A三、简答题1.微观经济学的假设前提是什么?答:微观经济学有四个假设前提:资源稀缺性、市场出清、完全理性、完全信息2.微观经济学有什么特点?答:微观经济学的特点:(1)用数学语言描述经济现象与规律;(2)以价格理论为核心;(3)以均衡为目标;(4)理论与现实紧密结合3.微观经济学要解决什么样的问题?答:微观经济学要解决的三大基本问题是:生产什么,生产多少;如何生产;为谁生产。
4.微观经济学的研究对象是什么?答:微观经济学的研究对象是个体经济单位。
具体从三个层面展开的:第一个层面:分析单个消费者、单个要素供给者和单个生产者的经济行为。
第二个层面:研究单个市场的价格决定(局部均衡)。
第三个层面:研究所有市场的价格同时决定。
四、论述题1.请介绍微观经济学的新发展。
答:微观经济学的新发展体现在理论上新发展、方法上新发展和微观经济学发展的新趋势三个方面。
理论上的新发展主要体现在:(1)提出了新消费理论,包括显示性偏好理论、风险条件下的选择理论、消费也是家庭生产的理论;(2)提出了现代企业理论,包括企业的性质、最大化模型与委托——代理问题、内部组织效率与非最大化厂商理论;(3)博弈论改写了微观经济学;(4)信息经济学成为微观经济分析的主流。
方法上的新发展主要体现在三个方面:一是计量经济学的崛起,二是统计学在经济学中的大规模运用,三是博弈论引入到经济学。
微观经济学发展的新趋势包括:(1)假定条件多样化,(2)研究领域的非经济化,(3)学科交叉的边缘化。
2.微观经济学与宏观经济学有何区别?答:微观经济学与宏观经济学的区别体现在:(1)研究对象不同。
微观经济学的研究对象是单个经济单位,二宏观经济学的研究对象则是整个经济,研究整个经济的运行方式与规律,从总量上分析经济问题。
(2)解决的问题不同。
微观经济学要解决的是资源配置问题,而研究社会范围内的资源利用问题,以实现社会福利的最大化。
曼昆《经济学原理(微观经济学分册)》(第6版)课后习题详解(第2章 像经济学家一样思考)
曼昆《经济学原理(微观经济学分册)》(第6版)第2章像经济学家一样思考课后习题详解跨考网独家整理最全经济学考研真题,经济学考研课后习题解析资料库,您可以在这里查阅历年经济学考研真题,经济学考研课后习题,经济学考研参考书等内容,更有跨考考研历年辅导的经济学学哥学姐的经济学考研经验,从前辈中获得的经验对初学者来说是宝贵的财富,这或许能帮你少走弯路,躲开一些陷阱。
以下内容为跨考网独家整理,如您还需更多考研资料,可选择经济学一对一在线咨询进行咨询。
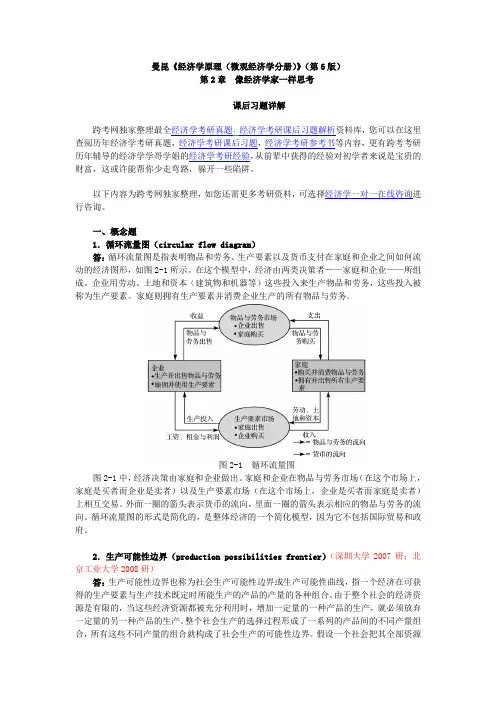
一、概念题1.循环流量图(circular flow diagram)答:循环流量图是指表明物品和劳务、生产要素以及货币支付在家庭和企业之间如何流动的经济图形,如图2-1所示。
在这个模型中,经济由两类决策者——家庭和企业——所组成。
企业用劳动、土地和资本(建筑物和机器等)这些投入来生产物品和劳务,这些投入被称为生产要素。
家庭则拥有生产要素并消费企业生产的所有物品与劳务。
图2-1 循环流量图图2-1中,经济决策由家庭和企业做出。
家庭和企业在物品与劳务市场(在这个市场上,家庭是买者而企业是卖者)以及生产要素市场(在这个市场上,企业是买者而家庭是卖者)上相互交易。
外面一圈的箭头表示货币的流向,里面一圈的箭头表示相应的物品与劳务的流向。
循环流量图的形式是简化的,是整体经济的一个简化模型,因为它不包括国际贸易和政府。
2.生产可能性边界(production possibilities frontier)(深圳大学2007研;北京工业大学2008研)答:生产可能性边界也称为社会生产可能性边界或生产可能性曲线,指一个经济在可获得的生产要素与生产技术既定时所能生产的产品的产量的各种组合。
由于整个社会的经济资源是有限的,当这些经济资源都被充分利用时,增加一定量的一种产品的生产,就必须放弃一定量的另一种产品的生产。
整个社会生产的选择过程形成了一系列的产品间的不同产量组合,所有这些不同产量的组合就构成了社会生产的可能性边界。
微观经济学(平狄克鲁宾费尔德)第六版课后答案--微观经济学 英文原版-CH02PINDYCK
The Basics of Supply and Demand
Introduction
What are supply and demand? What is the market mechanism? What are the effects of changes in market equilibrium? What are elasticities of supply and demand?
Produced Q1 at P1 and Q0 at P2 Now produce Q2 at P1 and Q1 at P2 Supply curve shifts right to S’
P
S S’
P1 P2
Q0
©2005 Pearson Education, Inc. Chapter 2
QD QD(P)
©2005 Pearson Education, Inc. Chapter 2 10
The Demand Curve
Price ($ per unit) The demand curve slopes downward, demonstrating that consumers are willing to buy more at a lower price as the product becomes relatively cheaper.
Q1
©2005 Pearson Education, Inc.
Q2
Chapter 2
Quantity
6
The Supply Curve
Other Variables Affecting Supply
Costs of Production
曼昆《经济学原理(微观经济学分册)》第6版课后习题详解(1-2章)
曼昆《经济学原理(微观经济学分册)》第6版课后习题详解第一篇导言第1章经济学十大原理一、概念题1.稀缺性稀缺性是指在给定的时间内,相对于人的需求而言,经济资源的供给总是不足的,也就是资源的有限性与人类的欲望无限性之间的矛盾。
2.经济学经济学是研究如何将稀缺的资源有效地配置给相互竞争的用途,以使人类的欲望得到最大限度满足的科学。
其中微观经济学是以单个经济主体为研究对象,研究单个经济主体面对既定资源约束时如何进行选择的科学;宏观经济学则以整个国民经济为研究对象,主要着眼于经济总量的研究。
3.效率效率是指人们在实践活动中的产出与投入比值或者是效益与成本比值,比值大效率高,比值小效率低.它与产出或收益大小成正比,与投入或成本成反比。
4.平等平等是指人与人的利益关系及利益关系的原则、制度、做法、行为等都合乎社会发展的需要,即经济成果在社会成员中公平分配的特性.它是一个历史范畴,按其所产生的社会历史条件和社会性质的不同而不同,不存在永恒的公平;它也是一个客观范畴,尽管在不同的社会形态中内涵不同对其的理解不同,但都是社会存在的反映,具有客观性。
5.机会成本机会成本是指将一种资源用于某种用途,而未用于其他用途所放弃的最大预期收益.其存在的前提条件是:①资源是稀缺的;②资源具有多种用途;③资源的投向不受限制。
6.理性人理性人是指系统而有目的地尽最大努力去实现其目标的人,是经济研究中所假设的、在一定条件下具有典型理性行为的经济活动主体。
7.边际变动边际变动是指对行动计划的微小增量调整.8.激励激励是指引起一个人做出某种行为的某种东西。
9.市场经济市场经济是指由家庭和企业在市场上的相互交易决定资源配置的经济,而资源配置实际上就是决定社会生产什么、生产多少、如何生产以及为谁生产的过程.10.产权产权是指个人拥有并控制稀缺资源的能力,也可以理解为人们对其所交易东西的所有权,即人们在交易活动中使自己或他人在经济利益上受益或受损的权力。
平狄克微观经济学第六版第三章课后答案
PART IIPRODUCERS, CONSUMERS, AND COMPETITIVE MARKETSCHAPTER 3CONSUMER BEHAVIORChapter 3 builds the foundation for deriving the demand curve in Chapter 4. In order tounderstand demand theory, students must have a firm grasp of indifference curves, the marginal rateof substitution, the budget line, and optimal consumer choice. It is possible to discuss consumer choicewithout going into extensive detail on utility theory. Many students find utility functions to be a moreabstract concept than preference relationships. However, if you plan to discuss uncertainty in Chapter5, you will need to cover marginal utility (section 3.5). Even if you cover utility theory only briefly,make sure students are comfortable with the term utility because it appears frequently in Chapter 4.When introducing indifference curves, stress that physical quantities are represented on thetwo axes. After discussing supply and demand, students may think that price should be on the verticalaxis. To illustrate the indifference curves, pick an initial bundle on the graph and ask which otherbundles are likely to be more preferred and less preferred to the initial bundle. This will divide thegraph into four quadrants, and it is then easier for students to figure out the set of bundles betweenwhich the consumer is indifferent. It is helpful to present a lot of examples with different types ofgoods and see if the class can figure out how to draw the indifference curves. The examples are alsouseful for explaining the significance of the assumptions made about preferences. In presentingdifferent examples, you can ask which assumption would be violated.Explaining utility follows naturally from the discussion of indifference curves. Though anabstract concept, it is possible to get students to understand the basic idea without spending too muchtime on the topic. You might point out that we as consumers have a goal in life, which is to maximizeour utility subject to our budget constraint. When we go to the store we pick the basket that we likebest and that stays within our budget. From this we derive demand curves. Emphasize that it is theranking that is important and not the utility number, and point out that if we can graph an indifferencecurve we can certainly find an equation to represent it. Finally, what is most important is the rate atwhich consumers are willing to exchange goods (the marginal rate of substitution) and this is based onthe relative satisfaction that they derive from each good at any particular time.The marginal rate of substitution, MRS, can be confusing to students. Some confuse the MRSwith the ratio of the two quantities. If this is the case, point out that the slope is equal to the ratio of the rise, ∆Y, and the run, ∆X. This ratio is equal to the ratio of the intercepts of a line just tangent to the indifference curve. As we move along a convex indifference curve, these intercepts and the MRSchange. Another problem is the terminology “of X for Y.” This is confus ing because we are notsubstituting “X for Y,” but Y for one unit of X. You may want to present a variety of examples in classto explain this important concept.1. What are the four basic assumptions about individual preferences? Explain thesignificance or meaning of each.(1) Preferences are complete: this means that the consumer is able to compare andrank all possible baskets; (2) Preferences are transitive: this means that preferencesare consistent, in that if bundle A is preferred to bundle B and bundle B is preferredto bundle C, then we should be able to conclude that bundle A is preferred to bundleC; (3) More is preferred to less: this means that all goods are desirable, and that theconsumer will always prefer to have more of a good; (4) Diminishing marginal rateof substitution: this means that indifference curves are convex, and that the slope ofthe indifference curve increases (becomes less negative) as we move down along thecurve. As a consumer moves down along her indifference curve she is willing to giveup fewer units of the good on the vertical axis in exchange for one more unit of thegood on the horizontal axis. This assumption also means that balanced marketbaskets are preferred to baskets that have a lot of one good and very little of theother good.2. Can a set of indifference curves be upward sloping? If so, what would this tell you about the two goods?A set of indifference curves can be upward sloping if we violate assumption numberthree; more is preferred to less. When a set of indifference curves is upward sloping,it means one of the goods is a “bad” in that the consumer prefers less of the goodrather than more of the good. The positive slope means that the consumer willaccept more of the bad good only if she also receives more of the other good in return.As we move up along the indifference curve the consumer has more of the good sheb.Draw a set of indifference curves for Jon.Since Jon is always willing to trade one can of coke for one can of sprite, hisindifference curves are linear with a slope of –1.c.Draw two budget lines with different slopes and illustrate the satisfaction-maximizing choice. What conclusion can you draw?Jon’s indifference curves are linear with a slope of –1. Jon’s budget line is alsolinear, and will have a slope that reflects the ratio of the two prices. If Jon’s budgetline is steeper than his indifference curves then he will choose to consume only thegood on the vertical axis. If Jon’s b udget line is flatter than his indifference curvesthen he will choose to consumer only the good on the horizontal axis. Jon willalways choose a corner solution, unless his budget line has the same slope as hisindifference curves. In this case any combination of Sprite and Coke that uses uphis entire income with maximize his satisfaction.5. What happens to the marginal rate of substitution as you move along a convex indifference curve? A linear indifference curve?The MRS measures how much of a good you are willing to give up in exchange for onemore unit of the other good, keeping utility constant. The MRS diminishes along aconvex indifference curve in that as you move down along the indifference curve, youare willing to give up less and less of the one good in exchange for the other. TheMRS is also the slope of the indifference curve, which increases (becomes lessnegative) as you move down along the indifference curve. The MRS is constantalong a linear indifference curve, since in this case the slope does not change. Theconsumer is always willing to trade the same number of units of one good inexchange for the other.6. Explain why an MRS between two goods must equal the ratio of the price of the goods for the consumer to achieve maximum satisfaction.The MRS describes the rate at which the consumer is willing to trade one good foranother to maintain the same level of satisfaction. The ratio of prices describes thetrade-off that the market is willing to make between the same two goods. Thetangency of the indifference curve with the budget line represents the point at whichthe trade-offs are equal and consumer satisfaction is maximized. If the MRS betweentwo goods is not equal to the ratio of prices, then the consumer could trade one good foranother at market prices to obtain higher levels of satisfaction. For example, if theslope of the budget line (the ratio of the prices) is –4 then the consumer can trade 4units of good 2 for one unit of good 1. If the MRS at the current bundle is –6, then theconsumer is willing to trade 6 units of good 2 for one unit of good 1. Since the twoslopes are not equal the consumer is not maximizing her satisfaction. The consumer iswilling to trade 6 but only has to trade 4, so she should make the trade. This tradingcontinues until the highest level of satisfaction is achieved. As trades are made, theMRS will change and become equal to the price ratio.7. Describe the indifference curves associated with two goods that are perfect substitutes. What if they are perfect complements?Two goods are perfect substitutes if the MRS of one for another is a constant number.Given the MRS is a constant number, the slope of the indifference curves will beconstant, and the indifference curves are therefore linear. If two goods are perfectcomplements, the indifference curves are L-shaped. In this case the consumerwants to consume the two goods in a fixed proportion, say one unit of good 1 for every1 unit of good 2. If she has more of one good but not more of the other then she doesnot get any extra satisfaction.8. What is the difference between ordinal utility and cardinal utility? Explain why the assumption of cardinal utility is not needed in order to rank consumer choices.Ordinal utility implies an ordering among alternatives without regard for intensity ofpreference. For example, if the consumer’s first choice is preferred to their secondchoice, then utility from the first choice will be higher than utility from the secondchoice. How much higher is not important. An ordinal utility function generates aranking of bundles and no meaning is given to the utility number itself. Cardinalutility implies that the intensity of preferences may be quantified, and that the utilitynumber itself has meaning. An ordinal ranking is all that is needed to rank consumerchoices. It is not necessary to know how intensely a consumer prefers basket A overbasket B; it is enough to know that A is preferred to B.9. Upon merging with the West German economy, East German consumers indicated a preference for Mercedes-Benz automobiles over Volkswagens. However, when they converted their savings into deutsche marks, they flocked to Volkswagen dealerships. How can you explain this apparent paradox?Three assumptions are required to address this question: 1) that a Mercedes costs morethan a Volkswagen; 2) that the East German consumers’ utility function comprises twogoods, automobiles and all other goods evaluated in deutsche marks; and 3) that EastGermans have incomes. Based on these assumptions, we can surmise that while EastGerman consumers may prefer a Mercedes to a Volkswagen, they either cannot afford aMercedes or they prefer a bundle of other goods plus a Volkswagen to a Mercedes alone.While the marginal utility of consuming a Mercedes exceeds the marginal utility ofconsuming a Volkswagen, the consumer will consider marginal utility per dollar foreach good. This means the marginal utility per dollar must have been higher for theVolkswagen since consumers flocked to the Volkswagen dealerships and not theMercedes dealerships.10. Draw a budget line and then draw an indifference curve to illustrate the satisfaction maximizing choice associated with two products. Use your graph to answer the following questions.a.Suppose that one of the products is rationed. Explain why the consumer is likelyto be worse off.When goods are not rationed, the consumer is able to choose the satisfaction-maximizing bundle where the slope of the budget line is equal to the slope of theindifference curve, or the price ratio is equal to the MRS. This is point A in the graphbelow. If good 1 is now rationed the consumer will not be able to attain the utilitymaximizing point. He or she will have to consume more of the other good instead.This is point B below.b.Suppose now that the price of one of the products is fixed at a level below thecurrent price. As a result, the consumer is not able to purchase as much as she would like of the product. Can you tell if the consumer is better off or worse off?When the price of the good is fixed at a level below the current (equilibrium) price,there will be a shortage of the good and the good will have to be effectively rationed.As in the question above, the consumer is worse off because she is not able to attainher utility maximizing point.11. Based on his preferences, Bill is willing to trade 4 movie tickets for 1 ticket to a basketball game. If movie tickets cost $8 each and a ticket to the basketball game costs $40, should Bill make the trade? Why or why not?No Bill should not make the trade. If he gives up the 4 movie tickets then he willsave $8 per ticket for a total of $32. However, this is not enough for a basketballticket. He would in fact have to give up 5 movie tickets if he wanted to buy anotherbasketball ticket. Notice also, that the marginal utility per dollar is higher for movietickets so Bill will be better off if he consumes more movie tickets and fewerbasketball tickets. To figure this out recall that what Bill is willing to do defines hisMRS. His MRS is 4 so this means that the marginal utility of a basketball game is 4and the marginal utility of a movie is 1:MRS=-4=-MUballMUmovie=-41.Now the marginal utility per dollar can be computed:MUball Pball =440=110MUmovie Pmovie =18.12. Describe the equal marginal principle. Explain why this principle may not hold if increasing marginal utility is associated with the consumption of one or both goods.The equal marginal principle states that the ratio of the marginal utility to price mustbe equal across all goods to obtain maximum satisfaction. In other words, utilitymaximization is achieved when the budget is allocated so that the marginal utility perdollar of expenditure is the same for each good. If the marginal utility per dollar is notequal then utility can be increased by allocating more dollars to the good with thehigher marginal utility per dollar. The consumer will obtain more “bang for the buck”if they reallocate their dollars.If marginal utility is increasing, the consumer maximizes satisfaction by consumingever larger amounts of the good. Thus, the consumer would spend all income on onegood, assuming a constant price, resulting in a corner solution. With a corner solution,the equal marginal principle cannot hold.13. The price of computers has fallen substantially over the past two decades. Use this drop in price to explain why the Consumer Price Index is likely to overstate substantially the cost-of-living index for individuals who use computers intensively.The consumer price index measures the cost of a typical basket of goods purchased bythe consumer in the current year relative to the cost of the basket in the base year.Each good in the basket is assigned a weight, which reflects the importance of the goodto the consumer, and the weights are kept fixed from year to year. The problem withfixing the weights is that consumers will shift their purchases from year to year to givemore weight to goods whose prices have fallen, and less weight to goods whose priceshave risen. The CPI will therefore give too much weight to goods whose prices haverisen, and too little weight to goods whose prices have fallen. For the individual whouses computers intensively, the fixed weight for computers in the basket willunderstate the importance of this good, and will hence understate the effect of the fallin the price of computers. The CPI will overstate the rise in the cost of living for thistype of individual.14. Explain why the Paasche index will generally understate the ideal cost-of-living index.The Paasche index measures the current cost of the current bundle of goods relativeto the base year cost of the current bundle of goods. The Paasche index willunderstate the ideal cost of living because it assumes the individual will buy thecurrent year bundle in the base period. In reality, at base year prices the consumerwould have been able to attain the same level of utility at a lower cost by alteringtheir consumption bundle. Since the base year cost is overstated, the denominatorwill be larger and the index will be lower, or understated.1. In this chapter, consumer preferences for various commodities did not change during the analysis. Yet in some situations, preferences do change as consumption occurs. Discuss why and how preferences might change over time with consumption of these two commodities:a. cigarettesThe assumption that preferences do not change is a reasonable one if choices areindependent across time. It does not hold, however, when “habit-forming” or addictivebehavior is involved, as in the case of cigarettes: the consumption of cigarettes in oneperiod influences their consumption in the next period.b. dinner for the first time at a restaurant with a special cuisineThis example is parallel to examples of adventure seeking. For some, a new diningexperience creates enthusiasm to seek out more exciting and different cuisines anddishes. For others, they develop a fondness for regularity and consistency or fear ofthe new and unknown. In either of these cases, choices change as consumption occurs.2. Draw indifference curves that represent the following individuals’ preferences for hamburgers and soft drinks. Indicate the direction in which the individuals’ satisfaction (or utility) is increasing.a.Joe has convex preferences and dislikes both hamburgers and soft drinks.Since Joe dislikes both goods, his set of indifference curves will be bowed inwardstowards the origin instead of outwards, as in the normal case where more is preferredto less. Given he dislikes both goods, his satisfaction is increasing in the direction ofthe origin. Convexity of preferences implies his indifference curves will have thenormal shape in that they are bowed towards the direction of increasing satisfaction.Convexity also implies that given any two bundles between which the consumer isindifferent, the “average” of the two bundles will be in the preferred set, or wi ll leavehim at least as well off.so ft dr in kb.Jane loves hamburgers and dislikes soft drinks. If she is served a soft drink, shewill pour it down the drain rather than drink it.Since Jane can freely dispose of the soft drink if it is given to her, she considers it to be aneutral good. This means she does not care about soft drinks one way or the other.With hamburgers on the vertical axis, her indifference curves are horizontal lines. Herso ft dr in kc.Bob loves hamburgers and dislikes soft drinks. If he is served a soft drink, he willdrink it to be polite.Since Bob will drink the soft drink in order to be polite, it can be thought of as a “bad”.When served another soft drink, he will require more hamburgers at the same timein order to keep his satisfaction constant. More soft drinks without morehamburgers will worsen his utility. More hamburgers and fewer soft drinks willincrease his utility.s o ft d rin kd.Molly loves hamburgers and soft drinks, but insists on consuming exactly one softdrink for every two hamburgers that she eats.Molly wants to consume the two goods in a fixed proportion so her indifference curvesare L-shaped. For any given amount of one good, she gets no extra satisfaction fromhaving more of the other good. She will only increase her satisfaction if she hasmore of both goods.s o ft d rin ke.Bill likes hamburgers, but neither likes nor dislikes soft drinks.Like Jane, Bill considers soft drinks to be a neutral good. Since he does not careabout soft drinks one way or the other we can assume that no matter how many hehas, his utility will be the same. His level of satisfaction depends entirely on hows o ft d rin kf.Mary always gets twice as much satisfaction from an extra hamburger as she doesfrom an extra soft drink.How much extra satisfaction Mary gains from an extra hamburger or soft drink tellsus something about the marginal utilities of the two goods, or about her MRS. If shealways receives twice the satisfaction from an extra hamburger then her marginalutility from consuming an extra hamburger is twice her marginal utility fromconsuming an extra soft drink. Her MRS, with hamburgers on the vertical axis, is1/2.so ft dr in k3. If Jane is currently willing to trade 4 movie tickets for 1 basketball ticket then she must like basketball better than movies. True or false? Explain.This statement is not necessarily true. If she is always willing to trade 4 movietickets for 1 basketball ticket then yes she likes basketball better because she willalways gain the same satisfaction from 4 movie tickets as she does from 1 basketballticket. However, it could be that she has convex preferences (diminishing marginalrate of substitution) and is at a bundle where she has a lot of movie tickets relative tobasketball tickets. This would make her willing to give up more movie tickets to getanother basketball ticket. It would not mean though that she liked basketball better.Her willingness to give up a good would in this case depend on the quantity of eachgood in her current basket.4. Janelle and Brian each plan to spend $20,000 on the styling and gas mileage features of a new car. They can each choose all styling, all gas mileage, or some combination of the two. Janelle does not care at all about styling and wants the best gas mileage possible. Brian likes both equally and wants to spend an equal amount on the two features. Using indifference curves and budget lines, illustrate the choice that each person will make.Assume styling is on the vertical axis and gas mileage is on the horizontal axis.Janelle has indifference curves that are vertical. If the styling is there she will takeit, but she otherwise does not care about it. As her indifference curves move over tothe right, she gains more gas mileage and more satisfaction. She will spend all$20,000 on gas mileage. Brian has indifference curves that are L-shaped. He willnot spend more on one feature than on the other feature. He will spend $10,000 onstyling and $10,000 on gas mileage.5. Suppose that Bridget and Erin spend their income on two goods, food (F) and clothing(C). Bridget’s preferences are represented by the utility function U(F,C)=10FC, while Erin’s preferences are represented by the utility function U(F,C)=.20F2C2.a.On a graph, with food on the horizontal axis and clothing on the vertical axis,identify the set of points that give Bridget the same level of utility as the bundle (10,5). Do the same for Erin on a separate graph.Bridget receives a utility of 10*10*5=500 from this bundle. The indifference curve isrepresented by the equation 10FC=500 or FC=50. Some bundles on this indifferencecurve are (5,10), (10,5), (25,2), and (2,25). Erin receives a utilityof .2*10*10*5*5=500 from the bundle (10,5). Her indifference curve is representedby the equation 500=.2F2C2, or 50=FC. This is the same indifference curve asBridget. Both indifference curves have the normal, convex shape.b.On the same two graphs, identify the set of bundles that give Bridget and Erin thesame level of utility as the bundle (15,8).For each person, plug in F=15 and C=8 into their respective utility functions. ForBridget, this gives her a utility of 1200, so her indifference curve is given by theequation 10FC=1200, or FC=120. Some bundles on this indifference curve are(12,10), (10,12), (3,40), and (40,3). For Erin, this bundle gives her a utility of 2880,so her indifference curve is given by the equation 2880=.2F2C2, or FC=120.This is the same indifference curve as Bridget.c.Do you think Bridget and Erin have the same preferences or different preferences?Explain.They have the same preferences because for any given bundle they have the samelevel of utility. This means that they will rank all bundles in the same order. Notehowever, that it is not necessary that they receive the same level of utility to have thesame set of preferences. All that is necessary is that they rank the bundles in thesame order.6. Suppose that Jones and Smith have each decided to allocate $1,000 per year to an entertainment budget in the form of hockey games or rock concerts. They both like hockey games and rock concerts and will choose to consume positive quantities of both goods. However, they differ substantially in their preferences for these two forms of entertainment. Jones prefers hockey games to rock concerts, while Smith prefers rock concerts to hockey games.a. Draw a set of indifference curves for Jones and a second set for Smith.Given they each like both goods and they will each choose to consume positivequantities of both goods, we can assume their indifference curves have the normalconvex shape. However since Jones has an overall preference for hockey and Smithhas an overall preference for rock concerts, their two sets of indifference curves willhave different slopes. Suppose that we place rock concerts on the vertical axis andhockey games on the horizontal axis, Jones will have a larger MRS than Smith.Jones is willing to give up more rock concerts in exchange for a hockey game since heprefers hockey games. The indifference curves for Jones will be steeper.b. Using the concept of marginal rate of substitution, explain why the two sets ofcurves are different from each other.At any combination of hockey games and rock concerts, Jones is willing to give up morerock concerts for an additional hockey game, whereas, Smith is willing to give up fewerrock concerts for an additional hockey game. Since the MRS is a measure of how manyof one good (rock concerts) an individual is willing to give up for an additional unit ofthe other good (hockey games), then the MRS, and hence the slope of the indifferencecurves, will be different for the two individuals.7. The price of DVDs (D) is $20 and the price of CDs (C) is $10. Philip has a budget of $100 to spend on the two goods. Suppose that he has already bought one DVD and one CD. In addition there are 3 more DVDs and 5 more CDs that he would really like to buy.a.Given the above prices and income, draw his budget line on a graph with CDs onthe horizontal axis.His budget line is PD D+PCC=I, or 20D+10C=100. If he spends his entire incomeon DVD’s he could afford to buy 5. If he spends his entire income on CD’s he couldafford to buy 10.b.Considering what he has already purchased, and what he still wants to purchase,identify the three different bundles of CDs and DVDs that he could choose.Assume that he cannot purchase fractional units for this part of the question.Given he has already purchased one of each, for a total of $30, he has $70 left. Sincehe wants 3 more DVD’s he can buy these for $60 and spend his remaining $10 on 1CD. This is the first bundle below. He could also choose to buy only 2 DVD’s for$40 and spend the remaining $30 on 3 CD’s. He can choose the following bundles: Purchased Quantities Total QuantitiesD C D C3 1 2 62 3 3 41 5 4 28. Anne has a job that requires her to travel three out of every four weeks. She has an annual travel budget and can either travel by train or by plane. The airline she typically flies with has a frequent traveler program that reduces the cost of her tickets depending on the number of miles she has flown in a given year. When she reaches 25,000 miles the airline will reduce the price of her tickets by 25% for the remainder of the year. When she reached 50,000 miles, the airline will reduce the price of her tickets by 50% for the remainder of the year. Graph Anne’s budget line, with train miles on the vertical axis and plane miles on the horizontal axis.The typical budget line is linear (with a constant slope) because the prices of the twogoods do not change as the consumer buys more or less of a particular good. In thiscase, the price of airline miles will change depending on how many miles shepurchases. As the price changes, the slope of the budget line will change. Sincethere are three prices, there will be three slopes, or two kinks, to the budget line.Since the price falls as she flies more miles, the budget line will become flatter withevery price change. See the graph in the problem below.9. Debra usually buys a soft drink when she goes to a movie theater, where she has a choice of three sizes: the 8 ounce drink costs $1.50, the 12 ounce drink, $2.00, and the 16 ounce drink, $2.25. Describe the budget constraint that Debra faces when deciding how many ounces of the drink to purchase. (Assume that Debra can costlessly dispose of any of the soft drink that she does not want.First notice that as the size of the drink increases, the price per ounce decreases.When she buys the 8-ounce soft drink she pays $1.508oz$0.19 per oz.When shebuys the 12-ounce size she pays $0.17 per ounce, and when she buys the 16-ounce size, she pays $0.14 per ounce. Given that there are three different prices per ounce of soft drink, the budget line will have two kinks in it, as illustrated below. Notice that at each kink, the slope of the budget line gets flatter (due to the decreasing cost per ounce relative to the “other good” on the vertical axis).O u n ces o fS o ft D rin k 81216。
微观经济学(平狄克鲁宾费尔德)第六版课后答案--微观经济学 英文原版-CH13PINDYCK
Chapter 13
8ห้องสมุดไป่ตู้
Noncooperative vs. Cooperative Games
“The strategy design is based on understanding your opponent’s point of view, and (assuming your opponent is rational) deducing how he or she is likely to respond to your actions.” (Text, p. 475)
Typically bid more for the dollar when faced with loss as second highest bidder
Chapter 13
10
Acquiring a Company
Scenario
Company A: The Acquirer Company T: The Target A will offer cash for all of T’s shares
Chapter 13
7
Noncooperative vs. Cooperative Games
Noncooperative Game
Negotiation and enforcement of binding contracts between players is not possible
Buyer and seller negotiating the price of a good or service or a joint venture by two firms (i.e., Microsoft and Apple) Binding contracts are possible
- 1、下载文档前请自行甄别文档内容的完整性,平台不提供额外的编辑、内容补充、找答案等附加服务。
- 2、"仅部分预览"的文档,不可在线预览部分如存在完整性等问题,可反馈申请退款(可完整预览的文档不适用该条件!)。
- 3、如文档侵犯您的权益,请联系客服反馈,我们会尽快为您处理(人工客服工作时间:9:00-18:30)。
Chapter 12
8
A Monopolistically Competitive Firm in the Short and Long Run
Long run
Profits will attract new firms to the industry (no barriers to entry) The old firm’s demand will decrease to DLR Firm’s output and price will fall Industry output will rise No economic profit (P = AC) P > MC some monopoly power
Chapter 12
4
Monopolistic Competition
Toothpaste
Crest and monopoly power
Procter
& Gamble is the sole producer of Crest Consumers can have a preference for Crest – taste, reputation, decay-preventing efficacy The greater the preference (differentiation) the higher the price
D = MR
DLR MRLR
QC
Quantity
QMC
Quantity
Monopolistic Competition and Economic Efficiency
The monopoly power yields a higher price than perfect competition. If price was lowered to the point where MC = D, consumer surplus would increase by the yellow triangle – deadweight loss. With no economic profits in the long run, the firm is still not producing at minimum AC and excess capacity exists.
Chapter 12
Monopolistic Competition and Oligopoly
Topics to be Discussed
Monopolistic Competition Oligopoly Price Competition Competition Versus Collusion: The Prisoners’ Dilemma Implications of the Prisoners’ Dilemma for Oligopolistic Pricing Cartels
Chapter 12
5
Monopolistic Competition
Two important characteristics
Differentiated but highly substitutable products Free entry and exit
Chapter 12
6
A Monopolistically Competitive Firm in the Short and Long Run
Chapter 12 2
Monopolistic Competition
Characteristics
1. 2. 3.
Many firms Free entry and exit Differentiated product
Chapter 12
3
Monopolistic Competition
Chapter 12
9
Monopolistically and Perfectly Competitive Equilibrium (LR)
$/Q
Perfect Competition
MC AC
Monopolistic Competition
$/Q Deadweight loss
MC
AC
P PC
Chapter 12
11
Monopolistic Competition and Economic Efficiency
Firm faces downward sloping demand so zero profit point is to the left of minimum average cost Excess capacity is inefficient because average cost would be lower with fewer firms
$/Q
Short Run
PSR PLR DSR
AC
DLR
MRSR
QSR
Quantity
MRLR QLR
Quantity
A Monopolistically Competitive Firm in the Short and Long Run
Short run
Downward sloping demand – differentiated product Demand is relatively elastic – good substitutes MR < P Profits are maximized when MR = MC This firm is making economic profits
The amount of monopoly power depends on the degree of differentiation Examples of this very common market structure include:
Toothpaste Soap Cold remedies