陕西省西安市2019统计年鉴数据:1-8 市区及远郊区县各月降水量(2018年)
合集下载
陕西省西安市2019统计年鉴数据:9-14 市区及县市政设施水平(2018年)

9-14 市区及县市政设施水平(2018年) Urban and County Municipal Facilities Level(2018)
指 标
Item
一、人均日生活用水量(升)
二、供水普及率(%) 三、燃气普及率(%) 四、人均城市道路面积(平方米) 五、建成区排水管道密度
(公里/平方公里) 六、污水处理率(%) 七、园林绿化
(km/sq.km) Rate of Sewerage Disposal (%) Afforestation and Parks and Gardens
Per Capita Public Green Areas (sq.m) Rate of Green Areas in Developed Areas(%) Rate of No Harm Disposal of Garbage (%)
人均公园绿地面积(平方米) 建城区绿地率(%) 八、生活垃圾无害化处理率(%) 注:本表数据来源于市建委。 本表数据含西咸新区。
Per Capita Daily Consumption of Tap Water For Residential Use (liters)
Water-Consuming Popularization (%) Gas-Consuming Popularization (%) Per Captia Area of Roads (sq.m) Density of Drainage Pipelines西安 Xi'an
189.56
97.85 99.90 17.97
7.88
93.85
9.97 35.23 98.97
市区 Urban
191.02
蓝田 Lantian
陕西省西安市2019统计年鉴数据:11-7 主要年份农业机械化、化肥、水利情况(2000-2018)

39313
三、农用塑料薄膜使用量(公斤) Plastic Sheet for Agricultural Use(kg)
1622198
四、农用柴油使用量(吨)
Diesel Oil for Agricultural Use (ton)
52706
五、农药使用量(公斤)
Pesticide (kg)
1559333
当年机械耕地面积(实际)
Area Ploughed by Tractors
366.81
当年机械播种面积(作业)
Seeded Area by Tractors
482.74
当年机械收获面积(作业)
Harvest Area by Tractors
272.83
二、农用化肥施用量(吨)
Use of Agricultural Fertilizers and Insecticides(ton)
19368 17055 57009 1855383 50832 1427879
767980 413397 157145
34149 132481 225949 112000
18855 17077 66247 2122310 51097 1465819
776319 414481 153825
33069 142137 230299 112275
240.22 196.96 229.29
2014
2015
2016
2017
2018
549.07 509.58 466.21
533.21 492.9 474.1
518.07 499.36 488.85
498.57 532.61 470.66
465.25 501.27 456.27
2019年1——8月西安市场监测报告

万㎡ 180 160 140 120 100 80 60 40 20 0
推出规划建面 成交规划建面 成交楼面价
19-01 46.6 46.28 3310
19-02 41.2 36.31 2134
西安市土地供求价走势
19-03 134.7 77.5 1210
19-04 169.05 169.05
761
拿地金额 (亿元)
楼面均价 (元/㎡)
1 华侨城
5
93.14 46.71 5015
2 中南建设 4
91.25 33.79 3703
3 富力地产 4
83.96 28.62 3409
4 万科
4
147.46 28.59 2265
5 绿地控股 8
126.49 20.31 1606
6 正荣地产 2
21.92 17.94 8184
19-04 541.38 720.06
892
19-05 89.95 89.95 2214
19-06 169.21 146.03 1378
19-07 486.79 166.79 3217
0 19-08 164.38 414.51 2150
推出规划建面
成交规划建面
成交楼面价
整体市场|土地出让金
2019年1-8月,西安市成交土地出让金达488.32亿元,平均溢价率为11.1%。2019年8月西安市土地出让金为89.16亿元 ,同比增长48.9%,溢价率为29.6%,较去年同期提高4.6个百分点。
19-05 35.49 35.49 2800
19-06 37.99 37.99 1924
19-07 130.09 26.26 2938
19-08 39.73 135.88 1093
陕西省西安市2019统计年鉴数据:10-8 各区县、开发区环境保护基本情况(2018年)

10-8 各区县、开发区环境保护基本情况(2018年) Condition of Environment Protection by Regions ( 2018)
区县、开发区
Region
全 市
Total
本年完成环保验收项目环保投资 额
(万元) Investment Completed in accepted Environmental projects this year
268.6
蓝田县
Lantian
2534.5
198.6
周至县
Zhouzhi
1113.3
1.1
高新开发区
Gaoxinkaifaqu
20196.6
492.7
经济开发区
Jingjikaifaqu
5513.8
266.9
航天基地
Hangtianjidi
5314.0
注:本表数据来源于市环保局。 环境统计中污水处理厂个数包含部分大学园区及部分大型小区的污水处理厂。 区县、开发区环保验收项目环保投资额未包括市本级完成数。
(units)
41
厂。
70.7
2
50.9
1
4
62.3
6
34.7
2
39.9
2
43.2
2
38.2
5
75.1
1
1
394.9
3
5.7
3
8.7
2
243.7
7
111.9
2
49.7
222.0
年) 18)
工业化学需氧量排放量 (吨)
Volume of COD Removed (tons) 1278.5
陕西省西安市2019统计年鉴数据:20-15 基础教育监测评价情况(2018年)

20-15 基础教育监测评价情况(2018年) Monitoring and Evaluation of Basic Education(2018)
入学率(%)
指 标
Item Enrollment Rate(%)
小学
Primary Schools
初中
Junior Middle Schools
巩固率(%)
专任教师学历合格率(%)
Qualified Rate Of Full-time Teacher Education (%)
小学
Primary Schools
初中
Junior Middle Schools
高中
Senior Middle Schools
幼儿园
Kindergartens
小学教师专科以上学历达到率(%)
Rate of Primary School Teachers with College degree or Above (%)
初中教师本科以上学历达到率(%)
Rate of Junior Middle SchoolTeachers with
Bachelor degree or Above (%)
高中教师研究生以上学历达到率(%) Rate of Senior Middle School Teachers with
注:1.本表数据来源于市教育局。 2.本表数据包含西咸新区。
Postgraduate degree or Above (%)
2018
99.99 99.98
101.73 98.74
99.99 99.24
100.00 99.99 99.00 99.27 99.09 93.59
陕西省西安市2019统计年鉴数据:10-3 工业污染排放及处理利用情况(2018年)

82011.6 3064.4
23578.96 5574.8
672281.4 2322.5
198.7 118.3
59.5 2.3
78.1
10-3 工业污染排放及处理利用情况(2018年) Discharge and Treatment of Industrial Pollution (2018)
指 标 一、被调查企业基本情况 1.企业数(个) 2.工业总产值(亿元) 3.工业锅炉数(台/蒸吨) 4.工业炉窑数(座) 二、工业废水 1.工业取水量(万吨) #新鲜水量 重复用水量 2.工业用水重复利用率(%) 3.废水治理设施数(套) 4.废水治理设施处理能力(万吨/日)
Waste Gas (10 000 cu.m./h) Operating Expense of Facilities for Treatment of2018524 331.8 466/17078.21
247
8843.6
299 25.5
30084.4 4163.4
631.4 0.3 4.5
1040.4 1225
Volume of Water Recycled Percentage of Industrial Water Recycled (%) Number of Facilities for Treatment of Waste Water (sets) Disposal Capacity of Facilities for Treatment of Waste Water ( 10 000 tons/day) Operating Expense of Facilities for Treatment of Waste Water (10 000 yuan) Volume of Industrial Waste Water Discharged (10 000 tons) Industrial Waste Gas Total Coal Consumption (10 000 tons) Fuel Oil Consumption (10 000 tons) Natural Gas Consumption ( 100 millian cu.m) Total Volume of Industrial Waste Gas Emission (100 millian cu.m) Number of Facilities for Treatment of Waste Gas (sets) Disposal Capacity of Facilities for Treatment of
陕西省西安市2019统计年鉴数据:10-6 生活及其他污染情况(2018年)

10-6 生活及其他污染情况(2018年) Domestic Pollution and Other Conditions (2018 )
指 标 一、基本情况 1.生活天然气消费量(万立方米) 2.生活用水总量(万吨) 二、污染排放情况 1.城镇生活污水排放量(万吨) 2.生活污水处理量(万吨) 3.生活CDD产生量(吨) 4.生活CDD排放量(吨) 5.生活氨氮产生量(吨) 6.生活氨氮排放量(吨) 7.二氧化硫排放量(吨) 8.氨氮化物排放量(吨) 9.烟尘排放量(吨) 注:本表数据来源于市环保局。2018Biblioteka 104990 100803
85137 81731 330531 24215 29981
2382 32232
5580 23463
他污染情况(2018年) n and Other Conditions (2018 )
Item Basic Condition
Volume of Living natural gas consumption (10 000 cu.m) Volume of Living water (10 000 tons) Discharge of Pollutant Volume of Urban Domestic Sewage Discharged( 10 000 tons) Volume of Domestic Sewgae Disposal(10 000 tons) Volume of Life CDD production (tons) Volume of Life CDD emissions (tons) Volume of Ammonia and Nitrogen in Urban Domestic Sewage Produced (tons) Volume of Ammonia and Nitrogen in Urban Domestic Sewage Discharged (tons) Volume of Domestic and Other Sulphur Dioxide Emission (tons) Volume of Ammonia and Nitrogen in Urban Domestic Sewage Discharged (tons) Volume of Soot Emission (tons)
陕西省西安市2019统计年鉴数据:1-2 土地面积和常住人口密度(2018年)
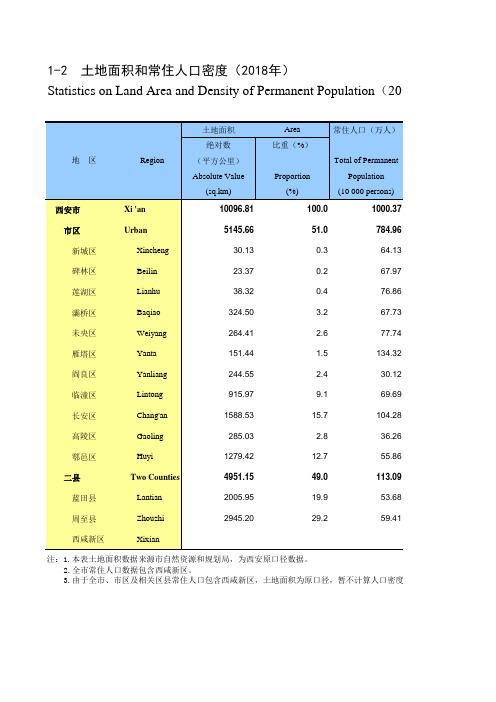
2005.95
19.9
53.68
周至县
Zhouzhi
2945.20
29.2
59.41
西咸新区
Xixian
注:1.本表土地面积数据来源市自然资源和规划局,为西安原口径数据。 2.全市常住人口数据包含西咸新区。 3.由于全市、市区及相关区县常住人口包含西咸新区,土地面积为原口径,暂不计算人口密度。
23.37
0.2
67.97
莲湖区
Lianhu
38.32
0.4
76.86
灞桥区
Baqiao
324.50
3.2
67.73
未央区
Weiyang
264.41
2.6
77.74
雁塔区
Yanta
151.44
1.5
134.32
阎良区
Yanliang
244.55
2.4
30.12
临潼区
Lintong
915.97
9.1
69.69
长安区
Chang'an
1588.53
15.7
104.28
高陵区
Gaoling
285.03
2.8
36.26
鄠邑区
Huyi
1279.42
12.7
55.86
二县
Two Counties
4951.15
49.0
113.09
蓝田县
Lantian
1-2 土地面积和常住人口密度(2018年) Statistics on Land Area and Density of Permanent Population(2018)
地 区 西安市