陕西省西安市2019统计年鉴数据:8-6 全市居民年人均消费支出(2018)
合集下载
西安统计年鉴2019社会经济指标:各区县、开发区财政支出(2018年)

6-5 各区县、开发区财政支出(2018年) Government Expenditure by Region and Development Zone(2018)
单位:万元
区县、开发区
Region
合计
Total
一般公共 预算支出
General Public Budgetary
Expenditures
608
183
120
663
16387
10714
310
500
1200
1300
3789
37758
500
4379
10999
医疗卫生与
计划生育支出
Medical 、 Health and Family Planning Expenditure
929633
节能环保支出
城乡社区支出
农林水支出
Expenditure for
6205
航空基地
Aviation Industry Base
28786
1837
国际港务区
注:本表数据来 源于市财政局。
International Trade&Logistic Park
407151Biblioteka 341118)公共安全支出
Expenditure for Public Safety
教育支出
Expenditure for Education
4373
54215
11832
88537
451
4243
73251
10138
110865
1145
5247
51487
26238
136941
陕西省西安市2019统计年鉴数据:9-14 市区及县市政设施水平(2018年)

9-14 市区及县市政设施水平(2018年) Urban and County Municipal Facilities Level(2018)
指 标
Item
一、人均日生活用水量(升)
二、供水普及率(%) 三、燃气普及率(%) 四、人均城市道路面积(平方米) 五、建成区排水管道密度
(公里/平方公里) 六、污水处理率(%) 七、园林绿化
(km/sq.km) Rate of Sewerage Disposal (%) Afforestation and Parks and Gardens
Per Capita Public Green Areas (sq.m) Rate of Green Areas in Developed Areas(%) Rate of No Harm Disposal of Garbage (%)
人均公园绿地面积(平方米) 建城区绿地率(%) 八、生活垃圾无害化处理率(%) 注:本表数据来源于市建委。 本表数据含西咸新区。
Per Capita Daily Consumption of Tap Water For Residential Use (liters)
Water-Consuming Popularization (%) Gas-Consuming Popularization (%) Per Captia Area of Roads (sq.m) Density of Drainage Pipelines西安 Xi'an
189.56
97.85 99.90 17.97
7.88
93.85
9.97 35.23 98.97
市区 Urban
191.02
蓝田 Lantian
陕西省西安市2019统计年鉴数据:8-8 全市居民家庭每百户年末耐用品拥有情况(2018)
Solar water heaters (unit) Dishwasher (unit) Exhauster (unit) Ordinary Telephone (unit) Mobile phones (unit) Access to the Internet(unit) Computer (a)
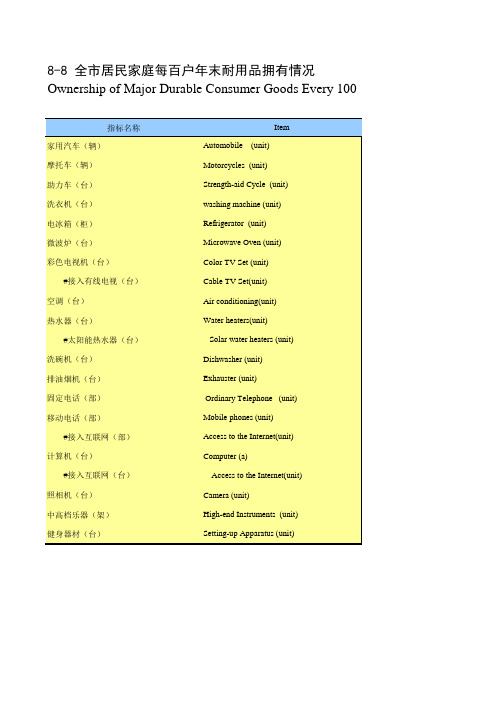
1.7 73.7 21.5 251.9 171.8 58.7 42.6 19.6
6.3 5.5
Access to the Internet(unit) Camera (unit) High-end Instruments (unit) Setting-up Apparatus (unit)
very 100 Households
2018
38.6 14.4 43.9 99.0 96.4 45.5 107.9 43.2 156.3 89.5 30.1
Item Automobile (unit) Motorcycles (unit) Strength-aid Cycle (unit) washing machine (unit) Refrigerator (unit) Microwave Oven (unit) Color TV Set (unit) Cable TV Set(unit) Air conditioning(unit) Water heaters(unit)
8-8 全市居民家庭每百户年末耐用品拥有情况 Ownership of Major Durable Consumer Goods Every 100 Households
指标名称 家用汽车(辆) 摩托车(辆) 助力车(台) 洗衣机(台) 电冰箱(柜) 微波炉(台) 彩色电视机(台) #接入有线电视(台) 空调(台) 热水器(台) #太阳能热水器(台) 洗碗机(台) 排油烟机(台) 固定电话(部) 移动电话(部) #接入互联网(部) 计算机(台) #接入互联网(台) 照相机(台) 中高档乐器(架) 健身器材(台)
陕西省西安市2019统计年鉴数据:9-6 城市(县城)设施水平(2010-2018)

9-6 城市(县城)设施水平 Urban(County)Municipal Facilities
指 标 一、人均日生活用水量(升)
Item Per Capita Daily Consumption of Tap Water
2010 186.20
For Residential Use (liters)
二、供水普及率(%)
Water-Consuming Popularization (%)
98.8
三、每万人拥有公共交通车辆
Number of Public Transport Vehicles
13.9
(标台)
Per 10 000 Population (units)
四、燃气普及率(%)
Gas-Consuming Popularization (%)
7.88
92.71
91.85
Байду номын сангаас
91.93
93.10
93.85
11.22 32.60 93.48
数据仍为西安原口径。
11.47 34.03 98.09
11.61 34.95 96.70
12.04 36.78 98.11
9.97 35.23 98.97
84.0
八、园林绿化
Afforestation and Parks and Gardens
人均公园绿地面积(平方米)
Per Capita Public Green Areas (sq.m)
9.1
建城区绿地率(%)
Rate of Green Areas in Developed Areas (%)
29.2
2015 187.79
2016 191.35
陕西省西安市2019统计年鉴数据:10-6 生活及其他污染情况(2018年)

10-6 生活及其他污染情况(2018年) Domestic Pollution and Other Conditions (2018 )
指 标 一、基本情况 1.生活天然气消费量(万立方米) 2.生活用水总量(万吨) 二、污染排放情况 1.城镇生活污水排放量(万吨) 2.生活污水处理量(万吨) 3.生活CDD产生量(吨) 4.生活CDD排放量(吨) 5.生活氨氮产生量(吨) 6.生活氨氮排放量(吨) 7.二氧化硫排放量(吨) 8.氨氮化物排放量(吨) 9.烟尘排放量(吨) 注:本表数据来源于市环保局。2018Biblioteka 104990 100803
85137 81731 330531 24215 29981
2382 32232
5580 23463
他污染情况(2018年) n and Other Conditions (2018 )
Item Basic Condition
Volume of Living natural gas consumption (10 000 cu.m) Volume of Living water (10 000 tons) Discharge of Pollutant Volume of Urban Domestic Sewage Discharged( 10 000 tons) Volume of Domestic Sewgae Disposal(10 000 tons) Volume of Life CDD production (tons) Volume of Life CDD emissions (tons) Volume of Ammonia and Nitrogen in Urban Domestic Sewage Produced (tons) Volume of Ammonia and Nitrogen in Urban Domestic Sewage Discharged (tons) Volume of Domestic and Other Sulphur Dioxide Emission (tons) Volume of Ammonia and Nitrogen in Urban Domestic Sewage Discharged (tons) Volume of Soot Emission (tons)
陕西省西安市2019统计年鉴数据:7-1 主要年份各种价格指数(1980-2018)

97.9 103.8 105.4 101.9 100.8 100.8
97.9 100.0 105.4 104.7
其他指标为西安原口径数据。下同
Consumer Price Index
108.7 102.4 100.9 102.6 104.7 109.7 108.5 110.6 122.8 118.3 102.5 109.4 112.2 117.2 128.5 117.0 110.9 106.0
97.9 96.8 100.2
Retail Price Index
7-1 主要年份各种价格指数
Price Indices in Representative Years
(以上年价格 为100)
居民消费
商品零售
年 份
价格指数
价格指数
Year
1980 1981 1982 1983 1984 1985 1986 1987 1988 1989 1990 1991 1992 1993 1994 1995 1996 1997 1998 1999 2000
109.3 102.7 101.0 102.0 104.8 109.3 107.4 111.4 123.2 117.8 100.9 108.3 112.4 112.8 126.2 114.6 107.9 101.5
95.5 97.4 98.7
工业生产者 出厂价格指数
Producer Price
Indices (PPI) for Industrial Producers
(the price of preceding year= 100)
工业生产者 购进价格指数 Industrial Purchasing Indices (IPI) for Industrial Producers
陕西省西安市2019统计年鉴数据:8-18 农村常住居民家庭居住情况(2018)

8-18 农村常住居民家庭居住情况 Housing Conditions of Rural Households
指标名称 调查户数(户) 平均每户居住人口(人) 人均现住房建筑面积(平方米/人) 一、按居住空间样式分(%) 单栋楼房 单栋平房 单元房 筒子楼或连片平房 其他 二、按主要建筑材料分(%) 钢筋混凝土 砖混材料 砖瓦砖土
By Cooking Fuel Condition (%) Pipeline Natural Gas,Pipeline Gas,Pipeline Liquified Petroleum Gas Coal Electricity Methane Others
100.0 93.1 1.1 5.8
100.0 51.7 40.7 4.6 0.7 2.3
100.0 33.1 8.3 29.3 29.0 0.3
100.0 17.9
2.1 61.0
0.2 18.8
Single building Room Single-storey House Apartment Tube-shaped Apartment or Lace Single-storey Houses Other by main construction materials(%) Reinforced concrete soil Brick and concrete material Tile and brick earth Bamboo grass mud Others by Source of Housing(%) Rental housing Self-establish Housing Commercial Residential Housing Private Housing through Housing Reform Indemnificatory Housing Resettlement Housing Inheriting and Donation Housing Others proportion of households which outer road is Hardened road(%)
陕西省西安市2019统计年鉴数据:1-2 土地面积和常住人口密度(2018年)
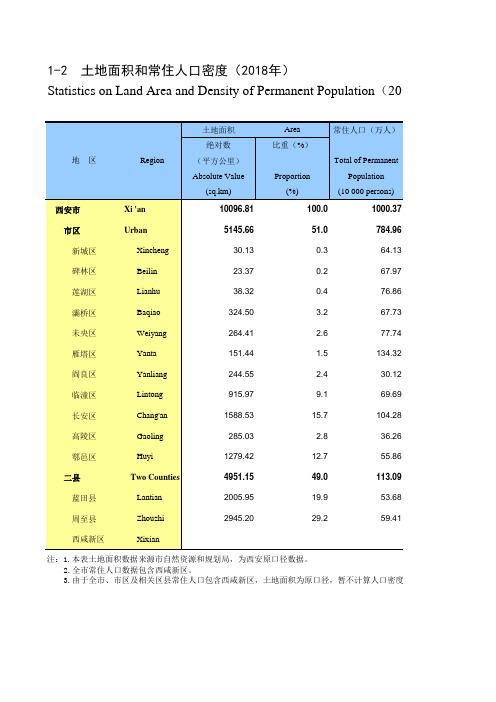
2005.95
19.9
53.68
周至县
Zhouzhi
2945.20
29.2
59.41
西咸新区
Xixian
注:1.本表土地面积数据来源市自然资源和规划局,为西安原口径数据。 2.全市常住人口数据包含西咸新区。 3.由于全市、市区及相关区县常住人口包含西咸新区,土地面积为原口径,暂不计算人口密度。
23.37
0.2
67.97
莲湖区
Lianhu
38.32
0.4
76.86
灞桥区
Baqiao
324.50
3.2
67.73
未央区
Weiyang
264.41
2.6
77.74
雁塔区
Yanta
151.44
1.5
134.32
阎良区
Yanliang
244.55
2.4
30.12
临潼区
Lintong
915.97
9.1
69.69
长安区
Chang'an
1588.53
15.7
104.28
高陵区
Gaoling
285.03
2.8
36.26
鄠邑区
Huyi
1279.42
12.7
55.86
二县
Two Counties
4951.15
49.0
113.09
蓝田县
Lantian
1-2 土地面积和常住人口密度(2018年) Statistics on Land Area and Density of Permanent Population(2018)
地 区 西安市
- 1、下载文档前请自行甄别文档内容的完整性,平台不提供额外的编辑、内容补充、找答案等附加服务。
- 2、"仅部分预览"的文档,不可在线预览部分如存在完整性等问题,可反馈申请退款(可完整预览的文档不适用该条件!)。
- 3、如文档侵犯您的权益,请联系客服反馈,我们会尽快为您处理(人工客服工作时间:9:00-18:30)。
水电燃料及其他
Water,Electric Power Fuel and Others
四、生活用品及服务
Living Articles and Services
家具及室内装饰品
Furniture and Interior Decorations
家用器具
Household Appliances
七、医疗保健 医疗器具及药品 医疗服务 八、其他用品和服务
Medicine and Medical Services Medical Instruments and Medicines Medical Services
Others
2048.8 754.8
1294.0 505.6
3.饮料
Drink
4.饮食服务
Catering Services
二、衣着
Clothing
衣类
Garments鞋类Fotwear三、居住Residence
#租赁房房租
Rental Housing Rent
住房维修及管理
Housing Repair and Management
8-6 全市居民年人均消费支出
Per Capita Living Expenditure of All Households
单位:元
指标名称
Item
消费支出
Total Living Expenditure
一、食品烟酒
Food,Tobacco and Alcohol
1.食品
food
2.烟酒
Alcohol and tobacco
家用纺织品
Household textile
家庭日用杂品
Household Articles of Daily Use
个人用品
Personal Items
家庭服务
Household Services
五、交通通信
Transportation and Communications
交通
Transportation
通信
Communications
六、教育文化娱乐
Recreation, Education and Culture Services
教育
Education
文化娱乐
Recreation
2018 21722.6 5797.1 3433.2 513.5 160.2 1690.2 1653.9 1297.6 356.3 4463.4 287.7 445.6 1101.2 1701.2 266.6 487.7 133.8 375.9 370.6 66.6 2548.7 1758.3 790.4 3003.9 1760.5 1243.4