四川社会发展经济数据:10-8_县城市政设施水平(2018年)
合集下载
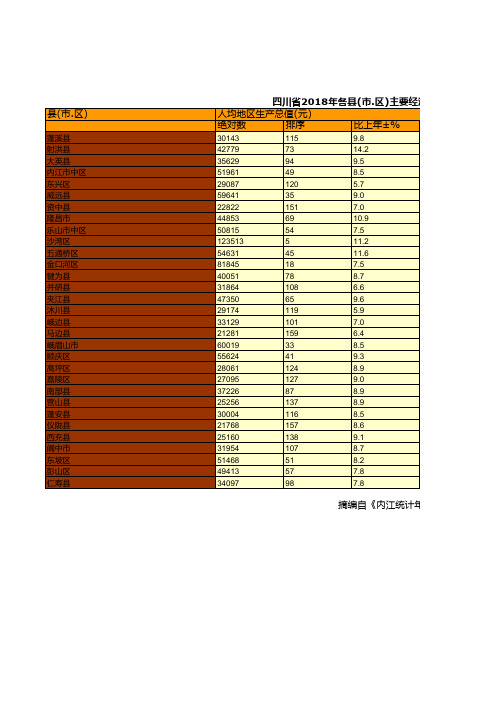
四川省2018年各县(市.区)主要经济指标及排序统计(二十六)

《内江统计年鉴2019》
工业化率(%) 实绩
46.5 45.9 55.4 40.1 29.9 31.6 49.9 48.2 33.7 42.9 48.7 48.7 50.0 41.5 35.4 32.1 16.2 15.4 30.2 17.8 25.0 32.4 45.2 39.8 46.7 48.1 32.1 29.0 26.4 37.7 26.1
8.0
24284
144
7.1
25012
139
7.9
50648
55
8.0
26062
134
9.2
摘编自《内江统计年鉴2019》
.区)主要经济指标及排序统计(二十六)
城镇化率(%)
排序
实绩
75
75.8
140
69.8
70
78.5
149
41.8
153
41.1
124
34.9
55
32.4
94
70.2
27
40.9
排序
44 45 18 62 108 99 30 34 89 54 31 31 27 58 85 96 151 153 107 147 129 94 46 64 42 37 96 115 125 74 127
31
8.1
92313
13
7.1
51511
50
8.3
37382
86
8.4
25528
136
8.3
24990
140
7.7
36545
91
7.6
24975
141
8.0
27808
125
10.3
四川社会发展经济数据:10-2_城市设施水平(2018年)
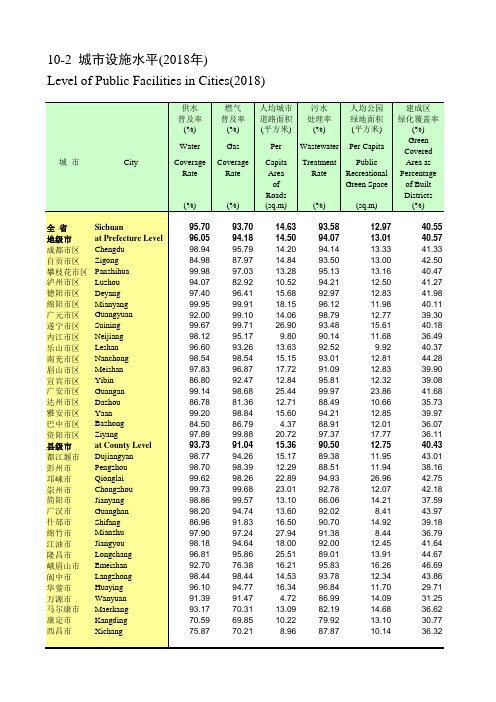
12.97 13.01 13.33 13.00 13.16 12.50 12.83 11.98 12.77 15.61 11.68
9.92 12.81 12.83 12.32 23.86 10.66 12.85 12.01 17.77 12.75 11.95 11.94 26.96 12.07 14.21
(%)
(sq.m)
(%)
全省
Sichuan
地级市
at Prefecture Level
成都市区 Chengdu
自贡市区 Zigong
攀枝花市区 Panzhihua
泸州市区 Luzhou
德阳市区 Deyang
绵阳市区 Mianyang
广元市区 Guangyuan
遂宁市区 Suining
内江市区 Neijiang
14.63 14.50 14.20 14.84 13.28 10.52 15.68 18.15 14.06 26.90
9.80 13.63 15.15 17.72 12.84 25.44 12.71 15.60
4.37 20.72 15.36 15.17 12.29 22.89 23.01 13.10 13.60 16.50 27.94 18.00 25.51 16.21 14.53 16.34
崇州市
Chongzhou
简阳市
Jianyang
广汉市
Guanghan
什邡市
Shifang
绵竹市
Mianzhu
江油市
Jiangyou
隆昌市
Longchang
峨眉山市 Emeishan
阆中市
Langzhong
华蓥市
Huaying
万源市
四川省2018年各县(市.区)主要经济指标及排序统计(四十二)

019》
人民币住户存款余排额序(亿元)
绝对数
165
6.55
154
11.44
170
5.59
163
6.68
164
6.57
167
6.05
150
1157
10.85
168
5.94
162
6.99
171
5.51
31
333.93
147
17.37
120
49.41
118
56.13
90
113.49
3.00
21.59
162
3.14
13.82
171
1.64
323.72
16
283.66
31.48
150
8.75
43.34
136
26.13
57.07
123
32.18
56.14
124
68.98
91.96
106
56.23
77.74
114
25.25
15.02
169
11.04
23.61
160
5.67
23.84
159
8.38
37.82
145
8.98
19.63
165
9.10
31.04
151
50.44
28.72
152
20.53
33.26
147
12.01
26.38
154
7.06
40.08
141
15.17
摘编自《内江统计年鉴2019》
标及排序统计(四十二) 消费品零售总额(亿元)
四川省2018年各县(市.区)主要经济指标及排序统计(二十七)
78
8.7
31864
108
6.6
47350
65
9.6
29174
119
5.9
33129
101
7.0
21281
159
6.4
60019
33
8.5
55624
41
9.3
28061
124
8.9
27095
127
9.0
37226
87
8.9
25256
137
8.9
30004
116
8.5
21768
157
8.6
25160
138
9.1
31954
107
8.7
51468
51
8.2
49413
57
7.8
34097
98
7.8
摘编自《内江统计年鉴2019》
.区)主要经济指标及排序统计(二十七)
城镇化率(%)
排序
实绩
20
36.9
1
51.5
25
39.9
55
58.3
148
52.4
39
50.4
124
39.1
11
54.5
109
73.4
10
54.0
县(市.区)
蓬溪县 射洪县 大英县 内江市中区 东兴区 威远县 资中县 隆昌市 乐山市中区 沙湾区 五通桥区 金口河区 犍为县 并研县 夹江县 沐川县 峨边县 马边县 峨眉山市 顺庆区 高坪区 嘉陵区 南部县 营山县 蓬安县 仪陇县 西充县 阆中市 东坡区 彭山区 仁寿县
四川省2018年各县(市.区)主要经济指标及排序统计(
四川社会发展经济数据:5-3_项目固定资产投资增长情况(2018年)
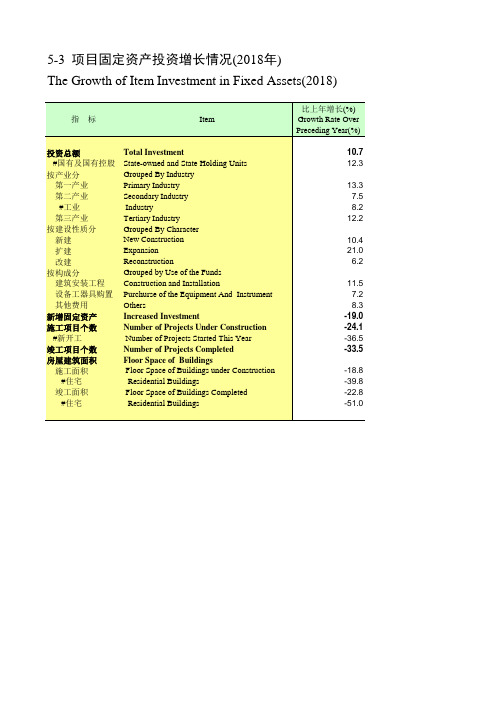
新增固定资产 施工项目个数
#新开工 竣工项目个数 房屋建筑面积
施工面积 #住宅
竣工面积 #住宅
Total Investment State-owned and State Holding Units Grouped By Industry Primary Industry Secondary Industry Industry Tertiary Industry Grouped By Character New Construction Expansion Reconstruction Grouped by Use of the Funds Construction and Installation Purchurse of the Equipment And Instrument Others Increased Investment Number of Projects Under Construction Number of Projects Started This Year Number of Projects Completed Floor Space of Buildings Floor Space of Buildings under Construction
Residential Buildings Floor Space of Buildings Completed Residential Buildings
比上年增长(%) Growth Rate Over Preceding Year(%)
10.7 12.3
13.3 7.5 8.2
12.2
10.4 21.0
5-3 项目固定资产投资增长情况(2018年) The Growth of Item Investment in Fixed Assets(2018)
四川省2018年各县(市.区)主要经济指标及排序统计(四十)

县(市.区)
洪雅县 丹棱县 青神县 翠屏区 南溪区 叙州区 江安县 长宁县 高县 珙县 筠连县 兴文县 屏山县 广安区 前锋区 岳池县 武胜县 邻水县 华蓥市 通川区 达川区 宣汉县 开江县 大竹县 渠县 万源市 雨城区 名山区 荥经县 汉源县 石棉县
四川省2018年各县(市.区)主要经济指标及排序统计(四十)
标及排序统计(四十) 消费品零售总额(亿元)
排序
110 127 124 7 80 44 70 63 97 91 107 99 126 41 119 45 68 46 111 23 32 35 78 33 27 96 83 118 123 116 133
019》
人民币住户存款余排额序(亿元)
绝对数
77
132.44
81
65.73
110.99
97
47.64
91.79
107
56.51
59.36
119
26.00
291.39
24
122.59
242.42
33
33.78
194.15
47
108.94
184.65
55
82.87
176.60
59
108.91
148.37
74
42.92
188.17
52
169.64
302.67
全社会固定资产投资(亿元) 社会消费品零售总额(亿元)
绝对数
排序
绝对数
95.82
104
46.01
50.89
128
25.87
57.14
121
28.02
419.98
7
320.16
四川省2018年各县(市.区)主要经济指标及排序统计(三十八)
184.76
104.26
101
33.25
204.09
45
175.70
161.32
67
99.56
179.20
57
94.26
511.18
4
472.65
174.79
60
104.15
114.62
95
76.54
105.62
100
177.44
64.38
117
65.57
70.80
116
47.75
40.67
140
20.33
426.44
73
152.80
32
320.61
37
294.50
47
251.69
88
118.19
94
101.12
6
522.46
26
344.65
102
80.92
25
351.62
60
208.18
62
196.02
2
898.44
97
96.51
74
151.16
28
339.45
77
146.51
95
100.78
104
42.90
137
17.45
191.11
50
167.60
254.50
31
165.53
42.11
138
24.47
46.97
133
20.40
77.62
115
46.82
44.09
135
21.80
80.74
112
四川社会发展经济数据:13-14_各市(州)耕地面积、耕地灌溉面积和农作物总播种面积(2018年)
播种面积(2018年)
otal Sown
(1 000 hectares)
#粮食 Grain Crops
6265.64 383.05 229.29 44.87 394.96 311.30 400.20 311.31 268.80 308.61 217.69 559.25 194.43 421.54 284.75 555.08 69.04 338.32 336.09 47.73 68.81 520.53
2932.54 368.91 100.18 39.98 154.82 157.20 221.15 91.96 130.52 134.69 141.14 227.81 171.46 188.72 106.25 181.46 53.72 92.55 121.70 25.15 36.74 186.43
农作物总 播种面积
13-14 各市(州)耕地面积、耕地灌溉面积和农作物总播种面积(2018年) Cultivated Area, Irrigated Area of Cultivated Land and Total Sown of Farm Crops by Region(2018)单位:千 Nhomakorabea顷 市(州)
Region
Total Sown Area
9615.39 739.32 366.41 71.41 540.67 476.72 661.96 498.60 387.00 478.15 340.79 888.87 314.55 591.97 406.27 810.29 115.97 508.33 517.27 74.09 88.90 737.86
年末实有 耕地面积 Cultivated
Area (year-end)
耕地灌溉 面积 Irrigated Area of Cultivated Land
四川省2018年各县(市.区)主要经济指标及排序统计(十五)
第三产业增加值(亿元)
绝对数
排序
比上年±%
63.75
79
10.3
144.60
31
10.9
60.07
81
10.8
130.93
38
10.0
118.06
46
8.8
105.29
56
9.8
103.92
58
5.0
123.45
43
9.9
205.76
20
10.764.73源自7810.356.80
85
11.5
12.09
42
102
34.48
111
70
184.56
17
160
87.99
62
65
106.71
48
27
103.53
49
42
126.10
37
7
98.73
54
113
21.34
128
24
63.11
81
93
31.38
118
35
62.33
83
172
18.47
133
144
20.06
130
135
12.23
145
19
100.09
51
54
142.33
25
35
54.38
91
10
64.59
80
35
136.93
28
16
59.89
88
35
61.34
85
5
35.23
108
2
37.97
四川省2018年各县(市.区)主要经济指标及排序统计(二十四)
第一产业增加值占GDP的比重 第二产业增加值占GDP的比重
实绩
排序
实绩
37.7
8
23.9
45.8
3
15.8
38.0
6
21.1
42.2
5
19.7
27.6
26
50.5
49.3
1
11.9
46.4
2
16.1
34.3
10
23.6
24.8
34
46.3
23.1
47
42.8
27.9
24
28.0
23.4
43
45.1
9.1
县(市.区)
炉霍县 甘孜县 新龙县 德格县 白玉县 石渠县 色达县 理塘县 巴塘县 乡城县 稻城县 得荣县 西昌市 木里县 盐源县 德昌县 会理县 会东县 宁南县 普格县 布拖县 金阳县 昭觉县 喜德县 冕宁县 越西县 甘洛县 美姑县 雷波县
四川省2018年各县(市.区)主要经济指标及排序统计(二十四)
141
37.6
19.8
68
44.9
26.6
27
46.9
25.1
32
38.4
22.1
55
44.8
30.0
20
40.5
29.9
ቤተ መጻሕፍቲ ባይዱ
22
33.5
33.9
11
23.6
32.8
15
31.1
23.3
45
46.9
37.5
9
20.4
31.4
18
27.9
18.0
79
52.2
33.4
- 1、下载文档前请自行甄别文档内容的完整性,平台不提供额外的编辑、内容补充、找答案等附加服务。
- 2、"仅部分预览"的文档,不可在线预览部分如存在完整性等问题,可反馈申请退款(可完整预览的文档不适用该条件!)。
- 3、如文档侵犯您的权益,请联系客服反馈,我们会尽快为您处理(人工客服工作时间:9:00-18:30)。
8.43 29.24 35.65 36.33 33.02 34.06 34.06 27.73
90.73 100.00 100.00 100.00 100.00 100.00
95.72 100.00 100.00 100.00 100.00 100.00 100.00 100.00 100.00 100.00 100.00 100.00 100.00 100.00 100.00 100.00 100.00 100.00 100.00 100.00
供水普及率
(%) Water Coverage Rate
(%)
燃气普及率
(%) Gas Coverage Rate
(Байду номын сангаас)
建成区 路网密度 (公里/平方公里) Density of Road Network of Built
District
(km/sq.km)
建成区 道路面积率
(%) Road Area Rate of Built
4.70 52.94 96.04 95.50 97.29 96.88 94.48 94.81
4.88 5.64 2.89 6.05 2.98 4.62 14.40 6.79 5.18 4.91 4.08 4.50 3.89 4.13 5.30 3.88 9.35 8.00 10.27 5.26 7.59 3.83 4.53 2.77 6.45 5.55 3.23 2.73 5.36 4.31 5.58 6.53 3.04 5.16 8.13 4.19 3.83 4.13 4.06 3.51
95.84 98.90 100.00 100.00 100.00 100.00 100.00 100.00 100.00 100.00 100.00 100.00 100.00 100.00
Sichuan Jintang Dayi Pujiang Xinjin Rongxian Fushun Miyi Yanbian Luxian Hejiang Xuyong Gulin Zhongjiang Santai Yanting Zitong Beichuan Pingwu Wangcang Qingchuan Jiange Cangxi Pengxi Shehong Daying Weiyuan Zizhong Qianwei Jingyan Jiajiang Muchuan Ebian Mabian Nanbu Yingshan Pengan Yilong Xichong Renshou
District
(%)
污水处理厂 集中处理率
(%) Centralized Treatment Rate of Watewater Treatment
Plants (%)
90.41 98.31 91.81 97.31 93.77 86.64 99.96 64.94 96.90 80.05 88.76 80.99 96.22 93.65 97.18 90.56 90.38 88.95 75.92 90.03 98.21 96.07 97.53 96.28 93.90 99.04 95.24 94.59 99.67 99.85 84.76 92.46 95.30 98.82 97.56 96.85 97.55 96.88 96.93 99.94
建成区 绿地率
(%) Green Space
Rate of Built
生活垃圾 无害化处理率
(%) Domestic Garbage Harmless
Treatment
District
Rate
(%)
(%)
29.28 39.01 31.77 38.39 32.47 37.29 38.20 35.20 33.29 34.45 24.37 32.55 32.63 32.02 36.60 38.04 34.50 44.20 38.51 34.92 27.08 36.66 36.31 32.48 35.30 30.13 29.54 13.28 25.82 13.09 20.74 32.26
10-8 县城市政设施水平(2018年) Level of Municipal Infrastructure in Counties(2018)
县城
Counties
全省 金堂县 大邑县 蒲江县 新津县 荣县 富顺县 米易县 盐边县 泸县 合江县 叙永县 古蔺县 中江县 三台县 盐亭县 梓潼县 北川羌族自治县 平武县 旺苍县 青川县 剑阁县 苍溪县 蓬溪县 射洪县 大英县 威远县 资中县 犍为县 井研县 夹江县 沐川县 峨边彝族自治县 马边彝族自治县 南部县 营山县 蓬安县 仪陇县 西充县 仁寿县
9.52 13.93
7.09 8.50 4.26 12.55 15.20 9.94 5.18 13.37 5.62 5.94 11.27 11.80 13.47 7.27 21.00 13.00 16.31 5.26 14.79 9.29 11.11 6.64 12.55 11.35 11.19 5.36 11.86 9.04 11.27 12.63 3.04 7.91 15.32 12.52 10.84 11.25 11.72 10.05
74.28 68.89 92.98 89.83 86.35 96.13 94.63 82.32 49.99 83.91 42.16 84.15 88.37 65.01 85.50 96.06 87.11 98.84 87.98 54.56 91.45 90.00 97.78 56.67 97.97 85.25 76.98 85.61 80.28 91.67 91.74 61.36 86.71 99.44 93.77 86.41 87.14 86.40 98.65 78.27
83.32 97.98 79.90 99.00 93.77 92.78 99.96 60.03 49.22 61.45 78.93 52.38 62.03 85.92 94.86 98.86 98.49 100.00 87.70 93.12 100.00 95.41 97.10 96.28 91.24 97.68 98.49 84.00 98.70 99.71 85.77 98.16