Melting of crystalline films with quenched random disorder
磁控溅射制备LiNi0.8Co0.1Mn0.1O2_薄膜工艺研究

表面技术第53卷 第6期收稿日期:2023-02-11;修订日期:2023-06-01 Received :2023-02-11;Revised :2023-06-01基金项目:中央高校基础研究基金项目(DUT20LAB123,DUT20LAB307)Fund :Fundamental Research Funds for the Central Universities (DUT20LAB123, DUT20LAB307)引文格式:李镰池, 吴爱民, 宋欣忆, 等. 磁控溅射制备LiNi 0.8Co 0.1Mn 0.1O 2薄膜工艺研究[J]. 表面技术, 2024, 53(6): 190-197.LI Lianchi, WU Aimin, SONG Xinyi, Preparation Process of LiNi 0.8Co 0.1Mn 0.1O 2 Thin Film by Magnetron Sputtering[J]. Surface Technology, 2024, 53(6): 190-197.*通信作者(Corresponding author )磁控溅射制备LiNi 0.8Co 0.1Mn 0.1O 2薄膜工艺研究李镰池,吴爱民*,宋欣忆,刘延领,王亚楠,黄昊(大连理工大学 材料科学与工程学院 辽宁省能源材料及器件重点试验室,辽宁 大连 116024) 摘要:目的 探究了磁控溅射法制备符合化学计量比且循环性能良好的LiNi 0.8Co 0.1Mn 0.1O 2(NCM811)薄膜工艺,有利于进一步提高全固态薄膜电池能量密度。
方法 从溅射功率、氩氧比、衬底温度中各选取3个水平组成L9(34)正交试验,在不锈钢衬底上沉积制备NCM811薄膜。
利用X 射线衍射仪和扫描电子显微镜对薄膜进行表征。
利用EDS 和ICP 对薄膜成分进行分析。
利用蓝电测试系统对以NCM811为正极的电池进行循环曲线测试。
沉积温度对等离子增强化学气相沉积法制备的SiNx H 薄膜特性的影响
沉积温度对等离子增强化学气相沉积法制备的SiN x :H薄膜特性的影响闻震利曹晓宁周春兰赵雷李海玲王文静*(中国科学院电工研究所,太阳能热利用及光伏系统重点实验室,北京100190)摘要:利用Centrotherm 公司生产的管式等离子增强化学气相沉积(PECVD)设备在p 型抛光硅片表面沉积SiN x :H 薄膜,研究沉积温度对SiN x :H 薄膜的组成及光学特性、结构及表面钝化特性的影响.然后采用工业化的单晶硅太阳电池制作设备和工艺制作太阳电池,研究不同温度制备的薄膜对电池电性能的影响.测试结果表明:SiN x :H 薄膜的折射率随着沉积温度的升高而变大,分布在1.926-2.231之间,这表明Si/N 摩尔比随着沉积温度的增加而增加;当沉积温度增加时,薄膜中Si -H 键和N -H 键浓度呈现减小趋势,而Si -N 键浓度逐渐升高,薄膜致密度增加;随着沉积温度的升高,SiN x :H 薄膜中的氢析出导致了钝化硅片的有效少子寿命先升高后降低,并且有效少子寿命出现明显的时间衰减特性.当沉积温度为450°C 时,薄膜具有最优的减反射和表面钝化效果.采用不同温度PECVD 制备的5组电池的电性能测试结果也验证了这一结果.关键词:SiN x :H 薄膜;沉积温度;结构特性;钝化;太阳电池;效率中图分类号:O644;TM914Influence of Deposition Temperature on the SiN x :H Film Prepared byPlasma Enhanced Chemical Vapor DepositionWEN Zhen-LiCAO Xiao-Ning ZHOU Chun-Lan ZHAO LeiLI Hai-Ling WANG Wen-Jing *(Key Laboratory Solar Thermal Energy and Photovoltaic Systems,Institute of Electrical Engineering,Chinese Academy of Sciences,Beijing 100190,P .R.China )Abstract:Hydrogenated silicon nitride films were prepared on the p -type polished silicon substrates by the direct plasma enhanced chemical vapor deposition (PECVD).The influences of deposition temperature on the composition,optical characteristics,structural characteristics,and passivation characteristics of the SiN x :H film were studied.All the solar cell devices were fabricated using industrial state-of-art crystal silicon solar cell technology.The influence of deposition temperature on the as-fabricated cell ʹs electrical performance is demonstrated.The refractive index of the film ranges from 1.926to 2.231and it increases with an increase in the deposition temperature.This shows that the Si/N mole ratio also increases with deposition temperature.The Si -H bond and the N -H bond break and form a new Si -N bond when the deposition temperature is higher.This increase in the Si -N concentration results in an increase in film density.The effective minor carrier lifetime of the coated wafer increases initially with the substrate temperature.At a temperature of 450°C the effective minor carrier lifetime begins to decrease.This phenomenon can be explained by H extraction from the film.For all the samples,the effective minor carrier lifetime degrades with time.The SiN x :H film prepared at a deposition temperature of 450°C shows the best[Article]物理化学学报(Wuli Huaxue Xuebao )Acta Phys.-Chim.Sin .2011,27(6),1531-1536June Received:January 18,2011;Revised:March 26,2011;Published on Web:May 10,2011.∗Corresponding author.Email:wangwj@;Tel:+86-10-82547042.The project was supported by the National High-Tech Research and Development Program of China (863)(2007AA052437)and Main Direction of Knowledge Innovation Program of the Chinese Academy of Sciences (KGCX2-YW-382).国家高技术研究发展计划(2007AA052437)和中国科学院知识创新工程重要方向项目(KGCX2-YW-382)资助ⒸEditorial office of Acta Physico-Chimica Sinica1531Vol.27Acta Phys.-Chim.Sin.2011anti-reflection and surface passivation properties.The electrical performance of the fully functional solarcells is also demonstrated and the optimized results are highlighted and discussed.Key Words:SiN x:H thin film;Deposition temperature;Structural property;Passivation;Solar cell;Efficiency1引言晶体硅太阳电池的表面积与体积的比率大,表面复合严重.此外,与电子级硅片相比,太阳能级单晶体硅和多晶体硅体内存在大量的杂质和缺陷,而这些杂质和缺陷会充当复合中心,增加复合速率.1,2表面复合和杂质缺陷复合会显著降低少子寿命,降低电池的短路电流和开路电压,进而影响电池的转换效率.因此减少表面复合和杂质复合是进一步提高晶体硅电池效率的关键.3目前产业化生产的晶体硅太阳电池全部采用增强的等离子化学气相沉积(PECVD)工艺制备SiN x:H薄膜对硅片表面进行钝化,减少表面复合和杂质复合;这层薄膜同时还具有光学减反射的作用.PECVD法制备薄膜的优点有:(1)沉积温度低(<500°C),硅中少子寿命影响较小,而且生产能耗低;(2)沉积速度较快,产能大,工艺重复性好;(3)SiN x:H薄膜的折射率分布在1.8-2.3之间,与硅的折射率相匹配,可以获得完美的减反射效果;(4)薄膜氢含量高,具有优良的表面钝化和体钝化效果:薄膜中的固定正电荷能够对硅片表面起到场效应钝化效果,可以有效地降低表面复合,提高电池效率;薄膜中的H还会向硅片体内扩散进行体钝化,特别是对多晶体硅太阳电池的转换效率有很好的改善.3SiN x:H薄膜的物理、化学及钝化特性取决于制备方法和工艺参数,在过去的几十年里,研究人员进行了大量关于工艺参数对薄膜特性影响的实验研究,4-7得出了很多被广泛认同的一致规律,用于指导产业化生产中SiN x:H薄膜沉积工艺;然而在之前的实验研究中,SiN x:H薄膜大部分都是使用用于实验研究的小型PECVD设备制备的,因此实验结论对产业化生产的指导意义不大.而且这些研究都是针对NH3和SiH4流量比、功率、腔体压强这三个参数对薄膜性质的影响进行的.虽然也有人观察到了沉积温度对薄膜性质的影响.8但也局限于给出了沉积速率、折射率、钝化特性的实验结果,并没有给出沉积温度影响这些特性的机理.本文重点研究产业化中大量应用的直接PECVD法制备SiN x:H薄膜工艺,沉积温度对薄膜组成/减反射特性、结构特性/钝化特性的影响和机理.同时对SiN x:H薄膜表面钝化效果的衰退现象进行了观察研究.最后根据这些实验结果,研究不同沉积温度条件制备的SiN x:H薄膜对太阳电池性能的影响.2实验使用直接法低频(40kHz)管式PECVD设备(Centrotherm公司)制备SiN x:H薄膜.使用的工艺气体是SiH4(纯度:99.995%)和NH3(纯度:99.998%).衬底电阻率为1Ω·cm的单面抛光的p型Czoehralski 法(CZ)直拉单晶硅片,大小为125mm×125mm.在沉积SiN x薄膜之前用标准的RCA清洗工艺清洗硅片,在进入反应腔体之前用HF和HCl(HF:3%,HCl: 7%)的混合溶液清洗硅片,去掉硅片表面的氧化层和金属离子.在硅片抛光表面沉积氮化硅,沉积温度的变化范围是400-500°C,而其它的沉积参数(NH3和SiH4流量比42:5、功率810W、腔体压强226.674 Pa)保持不变.每一组温度实验的样品数为10片左右.PECVD沉积SiN x:H薄膜一般是由SiH4和NH3在等离子体气氛下反应生成,反应式如下:SiH4+NH3→SiNH+3H2(1)在低压下,令射频发生器产生高频电场,使电极间的气体发生辉光放电,产生非平衡等离子体.这时反应气体的分子、原子和离子均处于环境温度,而电子却被电场加速,获得很高的能量将反应的气体分子激活,使原本高温下才发生的反应在低温时就能发生.利用椭偏仪(波长633nm,法国SOFRA公司,型号:SOPRA-GEs)测量SiN x:H薄膜的折射率和厚度;采用傅里叶变换红外(FTIR)透射谱研究薄膜中氢含量和Si-H、N-H和Si-N键的密度,所用仪器为美国Agilent公司生产,型号为Varian Excalibur 3100;使用微波光电导衰退法(MWPCD)测量有效少子寿命(τeff),所用仪器为匈牙利Semilab公司生产,型号为WT-2000.最后在电池制作过程中选用200μm厚的硅片,采用标准的单晶硅太阳电池制造工1532No.6闻震利等:沉积温度对等离子增强化学气相沉积法制备的SiN x :H 薄膜特性的影响艺:制绒、扩散制结、等离子体去边、去磷硅玻璃、沉积SiN x :H 薄膜、表面金属化,制备5组单晶硅太阳电池,每组电池代表了不同的PECVD 沉积温度,然后测试太阳电池的性能参数,进行比较分析.3结果和讨论3.1薄膜组成特性和光学折射率在用直接PECVD 法生长氮化硅时,那些具有化学反应活性的原子、分子、基团是在电极间的射频电场中被电离的.这些具有反应活性的粒子将会在硅片表面反应生成SiN x :H 薄膜.相对于高能的等离子体,沉积温度的升高对到达硅片表面的活性粒子数量的影响非常有限,因此对沉积速率的影响很小.表1给出了不同沉积温度条件下制备的SiN x :H 薄膜的厚度、沉积速率和折射率的变化.沉积速率是由薄膜厚度除以沉积时间得到的.从表1中可以看出,虽然沉积速率有变大的趋势,但变化很小.但是随着沉积温度升高,衬底硅片的温度也在升高,这使吸附到硅片表面的活性原子、分子、基团的能量增加,并使这些活性粒子在基片表面的扩散、迁移能力增强.这样随着温度的升高虽然不能增加到达硅片的活性粒子的数量,但是会使这些粒子反应更加充分.由于Si -H 键较N -H 键具有更小的激活能,所以温度的升高会使参与反应的含有Si -H 键的活性粒子较含有N -H 键的活性粒子多,这就会增加薄膜的Si/N 摩尔比(下同).SiN x :H 薄膜的折射率与薄膜中Si/N 比密切相关.不同的研究人员分别给出了使用不同的设备制备的SiN x :H 薄膜的折射率与Si/N 比的近似经验公式,9,10其中Bustarret 给出的折射率(n )和Si/N 比近似公式适用于Centrotherm PECVD 制备的SiN x :H 薄膜:10,11n =1.22+0.61x (2)式中x 为Si/N 摩尔比.由表1的实验结果可知,随着沉积温度的升高,薄膜的折射率也在升高,并且处于1.926-2.231之间.根据近似公式(2)可以计算得出的SiN x :H 薄膜的Si/N 摩尔比从1.16提高到1.66.对于硅太阳电池,根据薄膜光学原理,满足在600nm 波长处最低反射率的薄膜的折射率应该选择为硅材料和空气折射率的几何平均值,即在2.0左右.根据表1可知,沉积温度在400-450°C 之间,SiN x :H 薄膜减反射效果最优.确定了薄膜折射率后,可以通过控制沉积的时间来控制薄膜的厚度,从而达到最佳的减反效果.3.2薄膜结构特性和钝化特性很多实验研究表明SiN x :H 薄膜的氢含量和致密度对薄膜的表面钝化效果和体钝化效果都至关重要.图1为在不同沉积温度下制备的SiN x :H 薄膜的傅里叶变换红外透射谱.图1中的各个吸收峰根据薄膜的厚度进行了归一化处理,并且为了便于比较,表1不同温度沉积的SiN x :H 薄膜的厚度(d ),沉积速率(v )和折射率(n )Table 1SiN x :H thickness (d ),deposition velocitys (v ),and refractive index (n )at different deposition temperaturesNo.12345T /°C 400425450475500d /nm 120.9117.9133.1130.7133.2v /(nm ·min -1)7.97.78.78.58.7n 1.9262.0522.0952.1372.231图1不同沉积温度下制备的SiN x :H 薄膜的傅里叶变换红外透射谱Fig.1The Fourier transform infrared transmission spectra with different deposition temperatures(A)spectra of Si -N bond,Si -H bond,N -H bond;(B)enlarged spectra of Si -H bond,N -H bondT /°C:400,425,450,475,5001533Vol.27Acta Phys.-Chim.Sin.2011在纵轴上人为地上下错开.850cm-1附近的峰对应着Si-N键伸缩模式,在1200cm-1附近为弯曲模式,在3360-3460cm-1为N-H键的伸缩模式,2170cm-1分别对应着Si-H键摇摆模式和伸缩模式.12从图1我们可以看到,随着沉积温度升高,SiN x:H薄膜中Si-N键吸收峰强度增强,而Si-H键和N-H键吸收峰强度减弱.在分析SiN x:H薄膜中的氢含量时,在3340cm-1处的N-H键和2200cm-1附近的Si-H键最重要.13我们使用Lanford和Rand14建议的方法,根据Si-H键和N-H键的吸收峰计算出Si-H和N-H键的浓度,将二者相加就得到总的氢键浓度.Si-N键的浓度可根据Bustarret10和Giorgis15等的分析方法计算得到.表2给出了计算得到的不同沉积温度下制备的SiN x:H薄膜中Si-N 键、Si-H键、N-H键浓度以及H键的总浓度.从表2中可以看到,SiN x:H薄膜中Si-N键浓度随着沉积温度升高明显增加,而Si-H键和N-H 键浓度则随着沉积温度升高明显减少,H键总浓度自然也明显减少.这是因为随着沉积温度升高,在反应过程中所生成的Si-H键和N-H键被破坏,导致Si-H键和N-H键浓度降低,由于Si-H键键能比N-H键键能小,所以随着温度的升高,Si-H键浓度迅速降低,而N-H键浓度减少幅度小得多. Si-H断裂开的Si原子和N-H键断裂开的N原子结合生成了一些新的Si-N键,使得Si-N键浓度升高.仔细研究发现,随着温度的升高,N-H键浓度的降低(N-H键和Si-H键浓度降低小的一个)小于Si-N键的增加.这说明Si-N键浓度随温度的增加不仅仅来源于N-H和Si-H键的断裂重组,还来源于前面讨论提到的,即随着沉积温度升高,使吸附到基片表面的活性原子、分子、基团的能量增加,粒子在基片表面的扩散、迁移能力增强,使得薄膜结构致密.SiN x:H薄膜中Si-N键的浓度反映了薄膜的致密度,16随着薄膜的Si-N键的浓度增加,薄膜的质量密度会变大.17图2给出了不同沉积温度条件下制备的SiN x:H 薄膜在浓度为5%(w)的HF溶液中的腐蚀速率v ER,随着沉积温度升高,薄膜的腐蚀速率明显减小.这正是因为薄膜的密度增加,导致HF对薄膜的腐蚀速率降低.在这些SiN x:H薄膜中,Si-N键的浓度均大于1×1023cm-3,这比相关文献给出的Roth&Rau公司用PECVD法制备的SiN x:H薄膜的Si-N键浓度大了将近一个数量级,18说明Centrotherm公司用PECVD法制备的SiN x:H薄膜更加致密.Centrotherm 公司的PECVD是直接法,Roth&Rau公司的PECVD法是间接法,间接法等离子体是离子离化后形成SiN x:H,然后再扩散到硅片表面的,所以薄膜的质量较为疏松.SiN x:H薄膜中Si-N键浓度对薄膜表面钝化和体钝化效果至关重要,19在H含量相同的情况下,对于致密的薄膜,其钝化特性和减反射特性都要优越得多.沉积SiN x:H薄膜的硅片的有效少子寿命测试结果如表3所示,表中还给出了有效寿命随着时间表2不同沉积温度下制备的SiN x:H薄膜的Si-N键、Si-H键、N-H键以及H键总浓度Table2Bond concentration of Si-N,Si-H,N-H,and total H(TH)bonds of SiN x:H film at different depositiontemperaturesNo. 1 2 3 4 5T/°C40042545047550010-23n Si-N/cm-31.031.061.171.241.2910-22n Si-H/cm-31.691.271.211.111.1110-22n N-H/cm-31.131.001.020.980.9710-22n TH/cm-32.822.272.232.092.08表3不同沉积温度下制备的SiN x:H薄膜表面钝化的硅片的有效少子寿命(τeff)和衰减情况Table3Minority carriers lifetime(τeff)of silicon surfacepassivation SiN x:H film change with different depositiontemperatures andtimeNo.12T/°C400425τeff/μsinitial20.130.515d13.017.630d10.615.145d11.015.4图2不同沉积温度的SiN x:H薄膜在HF溶液中的腐蚀速率(v ER)Fig.2Etching rate(v ER)of SiN x:H film deposited atdifferent temperatures in HFsolutionNo.6闻震利等:沉积温度对等离子增强化学气相沉积法制备的SiN x :H 薄膜特性的影响的变化.表3的结果显示,SiN x :H 薄膜表面钝化的硅片的有效少子寿命随着沉积温度的升高先升高后降低,在450°C 处有效少子寿命达到最大值.沉积温度过低和过高都会对薄膜的表面钝化效果有不利影响,这与薄膜中的固定电荷密度和界面态密度的变化有关.硅悬挂键在SiN x :H 薄膜的深能级缺陷中占主导地位,又以Si ≡N 3为主,称为K 心,在禁带中心形成高密度的缺陷态.在氮化硅薄膜中K 心存在的稳定态是K +(Si ≡N +3),使氮化硅薄膜带正电.20根据前面讨论的结果(如表2所示),随着沉积温度的增加,断裂的Si -H 键要多于断裂的N -H 键,这说明随着氢从薄膜中析出,硅悬挂键增多,导致固定电荷密度增加.因此尽管薄膜中的氢含量降低,但是由于薄膜的场钝化效应增强,从而使硅片的有效少子寿命变大.当温度进一步升高后,随着大量的氢从薄膜中析出,在SiN x :H 薄膜与硅界面处的氢含量也开始减少,从而导致硅表面大量的悬挂键存在,增加了界面态密度,从而使硅片的有效少子寿命呈现下降趋势.另外一个现象就是有效少子寿命t eff 随着时间有显著的减小,经过一个月才趋于稳定,表面钝化效果的衰减可能与Si-SiN x :H 或SiN x :H 薄膜内部特殊的“弱键”在紫外光照射下被破坏有关.213.3电池的结果表4为按照标准的单晶硅太阳电池制作工艺制备的5组电池的电性能测试结果,每组的数量仍为10片左右.为了保持每组电池对太阳光的外反射一致,SiN x :H 薄膜厚度略有不同(因为不同的沉积温度折射率不一致).其余的制作工艺和参数完全一致.由表4可见最高效率点并没有出现在由前面实验结果得出的最佳有效寿命的制备温度450°C,而是出现在425°C.在采用本文实验中所用的硅片(200μm 厚,1Ω·cm 电阻率)时,开路电压主要是由基区决定的.由于PECVD 沉积薄膜主要影响发射结表面的钝化特性,所以5组电池的开路电压全部相同.直接能体现表面钝化特性的短路电流的变化规律与3.3节中的有效少子寿命实验结果相一致,即随着温度升高先升高然后降低,但是最高点出现425°C.这是因为短路电流不仅受表面钝化特性的影响而且还受串/并联电阻的影响.串联电阻并没有随沉积温度呈现规律性的变化,可以认为不受沉积温度的影响;但是并联电阻却随着沉积温度的升高而明显单调降低.并联电阻越低,短路电流和填充因子越低.同理,填充因子受串/并联电阻和短路电流的影响最高值也出现在425°C.这样在本实验的工艺条件下,425°C 的PECVD 沉积温度给出了最优化的效率.随着沉积温度的升高,SiN x :H 薄膜越来越致密;而薄膜结构越致密导热性就越好,所以在烧结过程中,玻璃银浆更加容易熔化烧穿薄膜.这样沉积温度越高,在相同的烧结工艺下,并联电阻越低(如表4所示).这也说明在本实验中,如果能够精细地调节450°C 沉积的薄膜所对应的烧结工艺,使并联电阻足够高,串联电阻足够低,将会在450°C 达到最优化的电池效率值.4结论在PECVD 法制备SiN x :H 薄膜工艺中,沉积温度对薄膜的Si/N 摩尔比、折射率、硅、氮和氢成键结构以及表面钝化效果有很大影响.在400-500°C 的温度区间制备的SiN x :H 薄膜的折射率分布在1.926-2.231之间.薄膜中的Si/N 摩尔比随着沉积温度的增加而增加,导致薄膜的折射率升高.而Si -H 键和N -H 键浓度随着沉积温度升高会减小,薄膜中氢含量降低.随着沉积温度的增加,Si -H 键断裂形成正电中心提高了场钝化效应,而H 的析出又降低了体钝化效应,这两者相互竞争造成了SiN x :H 薄膜钝化硅片的有效少子寿命先增加后下降.SiN x :H 薄膜钝化的硅片还出现明显的时间衰减特性,对于造成这种衰减原因还需要进一步的研究.沉积温度为450°C 时制备的SiN x :H 薄膜具有较好的减反射和表面钝化效果.采用相同类型的硅片制作的太阳电池的测试结果也验证了此钝化效果规律.同时还发现沉积温度越高,薄膜越容易被浆料烧穿,从而并联电阻越低.精细地调节烧结工艺将会使450°C 的沉积温度给出最优化的效率.致谢:感谢江苏欧贝黎新能源科技股份有限公司提供部分Eff:efficiency;V oc :open circuit voltage;I sc :short circuit current intensity;R s :series resistance;R sh :shunt resistance;FF:fillfactorNo.12T /°C 400425Eff./%17.717.8V oc /mV 626626I sc /A 5.345.35R s /m Ω65.5R sh /Ω72.637FF 0.7850.788表4电池性能参数Table 4Electrical performance of solar cells1535Vol.27 Acta Phys.-Chim.Sin.2011实验设备及屈盛博士、汤叶华硕士给予的有价值的讨论.References(1)Jana,T.;Mukhopadhyay,S.;Ray,S.Sol.Energy Mater.Sol.Cells2002,71(2),197.(2)Nijs,J.Advanced Silicon and Semiconducting Silicon-alloyBased Materials and Devices;Taylor&Francis:Bristol,1994.(3)Duerinckx,F.;Szlufcik,J.Sol.Energy Mater.Sol.Cells2002,72(1-4),231.(4)Schmidt,J.;Kerr,M.Sol.Energy Mater.Sol.Cells2001,65(1-4),585.(5)Soppe,W.;Rieffe,H.;Weeber,A.Progress in Photovoltaics-Research and Applications2005,13(7),551.(6)Santana,G.;Morales-Acevedo,A.Sol.Energy Mater.Sol.Cells2000,60(2),135.(7)Lauinger,T.;Moschner,J.;Aberle,A.;Hezel,R.J.Vac.Sci.Technol.A-Vacuum,Surfaces,and Films1998,16,530.(8)Yoo,J.;Dhungel,S.;Yi,J.Thin Solid Films2007,515(12),5000.(9)Dauwe,S.Low-temperature Surface Passivation of CrystallineSilicon and Its Application to the Rear Side of Solar Cells.Ph.D.Dissertation,Hannover University,Germany,2004.(10)Bustarret,E.;Bensouda,M.;Habrard,M.;Bruyere,J.;Poulin,S.;Gujrathi,S.Phys.Rev.B1988,38(12),8171.(11)Lelievre,J.;Fourmond,E.;Kaminski,A.;Palais,O.;Ballutaud,D.;Lemiti,M.Sol.Energy Mater.Sol.Cells2009,93(8),1281.(12)Tsu,D.;Lucovsky,G.;Mantini,M.Phys.Rev.B1986,33(10),7069.(13)Morimoto,A.;Tsujimura,Y.;Kumeda,M.;Shimizu,T.Jpn.J.Appl.Phys1985,24(11),1394.(14)Lanford,W.;Rand,M.J.Appl.Phys1978,49,2473.(15)Giorgis,F.;Giuliani,F.;Pirri,C.;Tresso,E.;Summonte,C.;Rizzoli,R.;Galloni,R.;Desalvo,A.;Rava,P.PhilosophicalMagazine Part B1998,77(4),925.(16)Hong,J.;Kessels,W.;Soppe,W.;Rieffe,H.;Weeber,A.;van deSanden,M.Structural Film Characteristics Related to thePassivation Properties of High-rate(>0.5nm/s)PlasmaDeposited a-SiN x:H.In3rd World Conf.on PhotovoltaicEnergy Conversion;Osaka,2003;Wcpec-3OrganizingCommittee:TYokyo,Japan,2003;1185.(17)Soppe,W.;Hong,J.;Kessels,W.;van de Sanden,M.;Arnoldbik,W.;Schlemm,H.;Devilée1,C.;Rieffe1,H.;Schiermeier1,S.;Bultman,J.;Weeber1,A.On CombiningSurface and Bulk Passivation of SiN x:H Layers for mc-SiSolar Cells.In Proc.29th IEEE Photovoltuic SpecialistsConference,New Orleans,2002;IEEE:New York,USA,2002;158-161.(18)Cuevas,A.;Chen,F.;Tan,J.;Mackel,H.;Winderbaum,S.;Roth,K.FTIR Analysis of Microwave-Excited PECVD SiliconNitride Layers.In4th World Conference on PhotovoltaicEnergy Conversion,Waikoloa,Hawaii,2006;IEEE:New York,USA,2006;1148-1151.(19)Weeber,A.;Rieffe,H.;Romijn,I.;Sinke,W.;Soppe,W.TheFundamental Properties of SiN x:H That Determine ItsPassivating Qualities.In31st IEEE PVSC Conf,Florida,2005;IEEE:New York,USA,2005;1043-1046.(20)Robertson,J.;Warren,W.;Kanicki,J.J.Non-Cryst.Solids1995,187,297.(21)Hezel,R.;Jaeger,K.J.Electrochem.Soc1989,136(2),518.1536。
thin-film
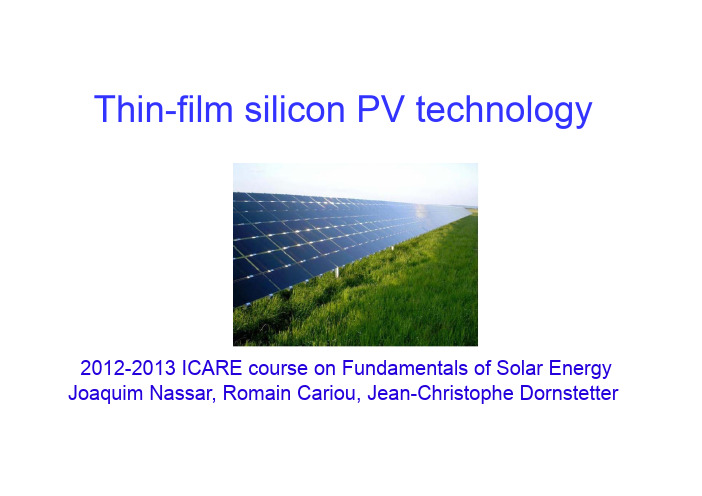
Thin-film silicon PV technology2012-2013 ICARE course on Fundamentals of Solar Energy Joaquim Nassar, Romain Cariou, Jean-Christophe DornstetterCourse overview update –Week2Monday Tuesday Wednesday Thursday Friday4. March5. March6. March7. March8. March8h30-9h45Lecture -NassarAlternatives tocrystalline silicon Lecture -NassarIntroduction to thin-filmsilicon technologyLecture and exercise -MayerSolar resourceLecture and exercise -MayerPV systemsLecture and exercise-MayerPV systemsinvited talk of Pr Roca ICabarrocasHomeworksolutionExercise -Nassar, Cariou, Dornstetter Elementary 11h-12hExercise Cariou-Question andanswer sessionElementary calculations on semiconductors Exercise –Cariou, DornstetterPC1D optimization work, cont’d14h-16h Exercise -Nassar,Cariou, Dornstettersolar cell optimizationwith PC1D Homework preparationHomework -Design ofan antireflectiontiinvited talk of PrKaare SandholtLecture and exercise -MayerPV systemsFinal Quiz (undersupervision ofICARE staff)30%f th d coating PV systems30% of the grade(70% : finalexamination at endof semester)Outline•Silicon thin films today : products and market•Plasma-enhanced chemical vapor deposition Plasma enhanced chemical vapor deposition•Hydrogenated Amorphous Silicon (a-Si:H)Si H b d PV l ll•a-Si:H based PV solar cells•Heterojunction technology•From amorphous to thin-film crystalline siliconRange of applications of silicon thin films :“Wide-area electronics”“Wid l t i”Flexible thin-film silicon modules («roll-to-roll» manufacturing)»manufacturing)Reminder : crystalline silicon module manufacturingMetallurgical Grade SiStar t SiHCl 3SiH 4GasSiemens FBR PyrolysisPlasma TorchProcesses BlocsGrainsPoudres BlocsIngots FZ, CZ monocrystalline PolySi Cast multicrystallinei l m s125x125 ...156x156 mm 125x125....210x210 mmWafers T h i n F Cells P/N Junction, HIT Cells, RCCModulesEndStandard silicon thin-film deposition technology : Plasma enhanced chemical vapour deposition (PECVD)The plasma state of matter•A plasma is a gas containing ionized atoms or molecules•It can be produced by a natural or artificial electric discharge in a gas •Artificial plasma can be created by a dc or radiofrequency (rf)dischargea familiar natural plasmaPlasma lampPlasma discharge glow in a rf PECVD chamberAuroraevidencing the magnetosphere plasmaA quick view of SiH 4plasma physics and chemistry•PECVD deposition of silicon relies on dissociation of silane (SiH4) in a H 2/SiH 4plasma This plasma is most often created from a 1356MH radiofreq enc discharge •This plasma is most often created from a 13.56MHz radiofrequency discharge-------++++++-------++++++--------++++++Electrons being much lighter than ions,part of them escape easily from plasma res lts negati e an s rface the plasma.This results in negative charging of any surface in contact with the plasmaPositive ions escaping the plasma are accelerated towards these surfaces,resulting in transfer of energy through «ion bombing »Also a lot of possible reactions between plasma and surface: example of the SiHand surface:example of the SiHradical3Surface reactions depend on surface type,temperature,diffusion lengths of reactive species…diff i l h f i iStandard silicon thin-film deposition Technology :Plasma enhanced chemical vapour deposition (PECVD)p p ()RF electrodeH 2P i Plasma SiH 4GeH 4e-Pumping PH 3Substrate TMB Some features of the PECVD process :•possibility of low substrate temperature material deposition (below 200°C)•Possibility of tuning the material composition through the respective flows of gases •Easy scalability : possibility to deposit semiconductor materials on large area substratesIndustrial scale PECVD fabrication line•Applied Materials «SunFab»A li d M t i l S F bfabrication line•Produces modules 5.7m2a-Si:Hμc-Si:HAmorphous Silicon•Crystalline order is the thermodynamically favoured phase of silicon •Yet silicon atoms reaching a surface need time and energy to arrange themselves in this thermodynamically favoured phase •High speed / low temperature deposition results in an amorphous materialCrystalline silicon A h ili•Locally,bonds look like those of c-Si•Beyond nearest neighbour,amorphousCrystalline silicon Amorphous silicon •Most atoms 4-fold coordinated,some are 3-fold…•High density of “dangling bond”defects (1018/cm3)•Can this material be used for photovoltaics?Band structure of a-Si:H Presence of hydrogen (10%) in film passivates dangling bonds Reduction of dangling bond density D DB: 1018→ 1016cm-3Is doping possible in a-Si:H ?Exemple :n doping (Phosphorus)Exemple : n doping (Phosphorus)The fact that doping is possible at all in a-Si:H is not obviousIn c-Si,the crystalline order favours the bonding of a P atom to its four Si i hb Th neighbours.The fifth electron of P is easily released.relaxation de la maillepriori l’incorporationP In a-Si:H,a configuration where a phosphorus atom isinvolved in only three bondswith Si neighbours (the tworemaining ones forming apair)is energetically stablep )g y Incorporation of phosphorusatom is therefore possiblewithout releasing an electroninto the material…Doping of a-Si:H•Doping of a-Si:H is performed bytuning the composition of the gas fedinto the PECVD chamber:•Add PH3to the H2/SiH4mixture toachieve n-type doping•Add B2H6to the H2/SiH4mixtureto achieve p-type doping•The possibility to dope makes a-Si:Ha useful photovoltaic materialGlow Discharge Hydrogenated a-Si, K. TanakaEffectiveness of a-Si:H doping Experimental evidence(Krotz et al. 1991)E i l id(K l1991)•Effectiveness of doping is weak( ≤ 1%) in particular for high doping levels•Doping comes along with an increase in defect densitya-Si:H for applications ?Low electron mobility : < 1 cm2V1s1Low electron mobility:<1cm-1-1Not suitable for rapid circuitry e.g. logic (c-mos)Suitable for :-low-speed electronics e.g. control of pixels of flat screens -Solar cells (Efficiency ~ 10 %)a-Si:H solar cell : the pin structureDoped a-Si:H has too many defects for a a-Si:H pn junction to work(too short minority carrier diffusion length,high shunt conductance of the junction)A pin structure is used instead:very thin p and n regions are used to create a field in a«intrinsic»region,that has less defects than a doped region.Electron-hole pair generation and separation occurs in the intrinsic regionReminder : «substrate» and«superstrate» type pin diode structuresi di dContacts to the junction use a transparent conductive oxide (TCO)C t t t th j ti t t d ti ida-Si:H –Complete Photovoltaic module•Multiple cells produced on a single substrate and connected in series Interconnection done through series of scribing masking and •Interconnection done through series of scribing, masking, and deposition stepsThi fil PIN Back ReflectorThin film PINPIN cell pm-Si:H i nPIN cell pm Si:HInterconnectpTransparent ConductiveO id (TCO)GlassOxide (TCO)Some possible transparent Conductive Oxides•TCOs Perform Lateral Transport in PIN’s at front contactTextured TCOs allow improved light trapping textured ZnO:Al•Textured TCOs allow improved light trapping Examples :•Indium Tin Oxide (ITO)Indium Tin Oxide (ITO)☺Very conductiveSmooth upon depositionBerginski et al, SPIE Photonics 2006(Juelich group)•Fluorine Doped Tin Oxide (SnO 2:F)Needs high temperature depositionCannot endure H-plasmaN t ll t t d d ititransmission ZnO:Al 2006 (Juelich group)☺Naturally textured on deposition •Aluminum Doped Zinc Oxide (ZnO:Al)☺Can endure H plasmatransmission ZnO:AlCan endure H-plasma ☺Can be textured when deposited (LPCVD) or post-deposition (Reactive Sputtering)☺Good IR transparencyDifficult control of the processHuepkes et al, Thin Solid Films 2006 (Juelich group)GlassExample : improvement of light trapping by using ITO+Al instead of Ag as a back reflectorView of a Si:H photovoltaic deviceView of a-Si:H –photovoltaic device Ag ITOpm-Si:H•Scanning Electron Microscopy (SEM)image of actual cell SnO 2:FScanning Electron Microscopy (SEM) image of actual cell •ITO/Ag back reflector gives superior reflection characteristicsa-Si:H –The Staebler-Wronski Effect •The Staebler-Wronsi effect is an observed decrease of a-Si:H solar cells under“light soaking”(long exposure to sunlight)•It is attributed to an increase in defect density•It can be partially reveresed by thermal annealingThermal annealingA surprising consequence of the Staebler-Wronski effectand its thermal annealing of SW effect :and its thermal annealing of SW effect:seasonal variation of cell efficiency !Growth of a-(Si,Ge):H alloys by PECVDAdjusting the flows of SiH 4and GeH 4allows to tune the a-(Si,Ge):H composition of a a (Si,Ge):Halloy,therefore allowing to tune the semiconductor bandgapPIN/PIN/PIN Triple Junction solar cells Use a SiGe:H alloys to change bandgapUse a-SiGe:H alloys to change bandgapBaojie Yan, Guozhen Yue, Laura Sivec, Jeffrey Yang, Subhendu Guha, and Chun-Sheng Jiang Appl. Phys. Lett. 99, 113512 (2011)Combining c-Si and thin-filmtechnologiesAbout 1/3 of the cost is due to the material ~300 µm thick wafer R d i thi k i b i l ti Reducing thickness is an obvious solution Problem : wafer bending during high-temperature steps !O i b dip pOvercoming bending…PERL structureHIT structureLocalized diffusion reduces stress New technique for doping…Results on HIT structurea-Si:H provides an excellentSi H id ll tsurface passivation to c-SiLow temperature process,compatible with thin wafersV OC= 729 mV; J SC= 39.6 mA.cm‐2; η= 23 %V OC= 747 mV on 58 µmy p ySanyo reported 23.7% efficiencyfor a 100 µm thin HIT cellat the EUPVSEC, Hamburg sept 2011e 3i o n r a t 2e p o s i t Si D µc-Si:H pm-Si:H a-Si:HMore forefront research on the applications of thin-film crystalline PV…Rendez-vous at the invited lecture ofR d t th i it d l t fPr Pere Roca i Cabarrocas,Head of LPICMH d f LPICMto the ICARE studentson March, 7th !M h7th!Thanks for your attention !Courtesy:Courtesy :Pr Bernard DrévillonPr Pere Roca i Cabarrocas Pr Pere Roca i CabarrocasDr Erik Johnson (Ecole Polytechnique / LPICM)Bibliography。
光谱在透明膜层厚度测量中的应用

Technology Innovation and Application应用科技2021年16期光谱在透明膜层厚度测量中的应用沈啥1,周珊打邵通广2(1.常州博瑞电力自动化设备有限公司,江苏 常州213025;2.南京南瑞继保电气有限公司,江苏 南京211102)摘 要:光谱法测量透明膜层厚度是目前人们讨论最多和应用最为广泛的测量方法之一。
随着光谱技术向更高精度和更宽光谱方向的发展,在薄膜设计和工艺制备中,利用光谱测量透明膜层的厚度具有非常重要的意义。
文章主要对光谱在透明膜层厚度测量中的应用,及光谱测量设备在实际生产中的应用进行了探讨,以期能够提升透明膜层厚度测量的水平和质量。
关键词:光谱;透明膜层;厚度测量中图分类号:0657.3 文献标志码:A 文章编号:2095-2945 (2021 )16-0172-03Abstract : At present, the measurement of transparent film thickness by spectroscopy is one of the most discussed andwidely used methods. With the development of spectral technology to higher precision and wider spectrum, it is very important to use spectrum to measure the thickness of transparent film in film design and process preparation. This paper mainlydiscusses the application of spectrum in transparent film thickness measurement and the application of spectral measuringequipment in practical production, in order to improve the level and quality of transparent film thickness measurement.Keywords : spectrum; transparent film; thickness measurement在薄膜工艺制备中,膜层的厚度是关键参数之一,直 接关乎薄膜的质量和应用效果。
红外光谱的样品制备

红外光谱的样品制备–第一部分每年各地红外光谱的实验室制备和利用红外光谱仪分析成千上万个样品。
这些样品范围从商业产品像高聚物颗粒和液体表面活性剂,一直到高纯度有机化合物。
为了从这些不同的材料中得到高质量的红外谱图,我们必须采用多种多样的制样技术。
这篇文章的旨在与您交流红外制样技术。
在这篇文章中,将对基于样品的物理特性进行的技术选择作讨论。
液体液样的制备是将少量样品涂于两片红外透明的窗片(KBr、NaCl等)之间。
窗片的互相挤压形成一个样品薄层,样品的成分决定了选择哪种窗片。
对于无水的样品,窗片材料是KBr。
对于含水样品, KRS-5 较为适合。
固体固体样品对光谱学家提出挑战。
样品的熔点为我们指出首先该考虑哪种技术。
对于熔点低于72。
C的样品,用适当的溶剂将样品溶解,成膜于KBr窗片上是最先考虑的。
如果因为基线不好或是溶解性差而不成功,可以考虑在两片KBr窗片内熔化成膜。
如果这也不行,样品可进行KBr压片。
对于熔点高于72。
C的样品,首选的技术是KBr压片。
对于聚合物样品,成膜法是首选,接着是热熔法和压片法。
对于熔点未知的样品,结晶度的检测将会指明哪种技术将会成功。
高结晶度的样品用KBr压片法较好,对于低结晶度的样品,成膜和热熔会得到更好的谱图。
红外光谱的样品制备–第二部分液体样品液体样品的分析有多种方法。
在本文中,我们主要探讨所使用的制样方法及一些有关的潜在问题。
纯样品技术分析液体样品的最常用方法就是将一滴液体夹在两片盐片中间,过程如下:将一滴样品滴于合适的盐片上,几秒钟后,将另外一块盐片合上,这样液体被夹在两块盐片之间,变成薄膜状。
当然,选用的盐片要与分析的液体样品兼容。
不含水的样品可采用KBr(32×5mm)盐片,含水样品则采用KRS-5盐片,这几种晶体材料的选用主要是根据它们在红外段的透光范围(优于4000-450cm-1)和稳定性。
每次一个样品做好后,用带合适的溶剂的棉花清洗,然后在倒有甲醇的鹿皮或鸡皮上抛光。
先进的电子断层扫描技术在材料科学中的发展--基于透射电子显微镜和扫描透射电子显微镜

Trans. Nonferrous Met. Soc. China 24(2014) 3031−3050Development of advanced electron tomography in materials science based on TEM and STEMMao-hua LI 1, Yan-qing YANG 1, Bin HUANG 1, Xian LUO 1, Wei ZHANG 1, Ming HAN 1, Ji-gang RU 21. State Key Laboratory of Solidification Processing, Northwestern Polytechnical University, Xi’an 710072, China;2. Beijing Institute of Aeronautical Materials, Beijing 100095, ChinaReceived 24 November 2013; accepted 12 May 2014Abstract: The recent developments of electron tomography (ET) based on transmission electron microscopy (TEM) and scanning transmission electron microscopy (STEM) in the field of materials science were introduced. The various types of ET based on TEM as well as STEM were described in detail, which included bright-field (BF)-TEM tomography, dark-field (DF)-TEM tomography, weak-beam dark-field (WBDF)-TEM tomography, annular dark-field (ADF)-TEM tomography, energy-filtered transmission electron microscopy (EFTEM) tomography, high-angle annular dark-field (HAADF)-STEM tomography, ADF-STEM tomography, incoherent bright field (IBF)-STEM tomography, electron energy loss spectroscopy (EELS)-STEM tomography and X-ray energy dispersive spectrometry (XEDS)-STEM tomography, and so on. The optimized tilt series such as dual-axis tilt tomography, on-axis tilt tomography, conical tilt tomography and equally-sloped tomography (EST) were reported. The advanced reconstruction algorithms, such as discrete algebraic reconstruction technique (DART), compressed sensing (CS) algorithm and EST were overviewed. At last, the development tendency of ET in materials science was presented.Key words: electron tomography; materials science; transmission electron microscopy; scanning transmission electron microscopy1 IntroductionTEM is an important tool that can provide valuableinformation about the microstructure and chemistry ofmaterials at nanoscale. However, TEM images are onlytwo-dimensional (2D) projections of three-dimensional(3D) objects, and therefore these images provide onlypartial information, even erroneous information in somecase because of lack of depth resolution. To understandaccurately the relationships between the structures andthe properties, it is essential to view directly in 3D,especially for materials with complex morphology andchemistry.More recently, electron tomography (ET) has beensuccessfully applied to 3D reconstruction of nanostructures with the morphologies and chemicalcompositions. Although the mathematical base for tomographic techniques had been established in 1917 byRADON [1], it was firstly applied to ET in biologicalsciences in 1968 [2,3]. With the advent of the noveltomographic imaging modes, the automation of microscope control, the optimized tilt series and the advanced reconstruction algorithms, ET has acquired revolutionary development, and has been widely used in the field of materials science in the past several decades. According to imaging modes of ET, the types of ET based on TEM and STEM include BF-TEM tomography [4−8], DF-TEM tomography [9], WBDF-TEM tomography [10−12], ADF-TEM tomography [13], EFTEM tomography [14−19], HAADF-STEM tomography [20−28], ADF-STEM tomography [29,30], IBF-STEM tomography [31], EELS-STEM tomography [32−34], XEDS-STEM tomography [35−37], and so on. Lately, ZEWAIL [38] and KWON and ZEWAIL [39] have pioneered four-dimensional (4D) ultrafast electron microscopy (UEM) with spatial and temporal resolution, which makes dynamics ET implement.ET mainly consists of three steps: tomography data acquisition, tomography alignment and reconstruction,and tomography visualization. In order to be suitable for tomography, all image signals along the tilt series must strictly meet the projection requirement, namely the recorded signals must be a monotonic function of someFoundation item: Projects (51071125, 51201135) supported by the National Natural Science Foundation of China; Project (B08040) supported by theProgram of Introducing Talents of Discipline to Universities, ChinaCorresponding author: Yan-qing YANG; Tel/Fax: +86-29-88460499; E-mail: yqyang@ DOI: 10.1016/S1003-6326(14)63441-5Mao-hua LI, et al/Trans. Nonferrous Met. Soc. China 24(2014) 3031−3050 3032physical properties of the object.The aim of this review is mainly firstly to summarize the novel tomographic imaging modes, then to introduce the optimized tilt series and the advanced reconstruction algorithms, and finally to present the further developments of ET.2 Novel tomographic imaging modes2.1 Based on TEM2.1.1 BF-TEM tomographyBF-TEM tomography is suitable for amorphous materials, where mass thickness contrast is dominant. A few successful examples were reported, such as studying the location and distribution of metal (oxide) particles in zeolites and catalyst materials in 3D, and the location and the connectivity of pores in mesoporous materials [4−8]. Figure 1 shows the 3D reconstruction of an Au/SBA−15 model catalyst particle, revealing the size and location of Au particles inside the support material clearly [8]. However, for crystalline materials, BF-TEM images are mainly dominated by diffraction contrast that is highly sensitive to the direction of the incident beam. Therefore, it is very difficult to obtain BF-TEM images with clear contrast through the entire tilt range. In general, BF-TEM tomography is unsuitable for crystalline materials. 2.1.2 DF-TEM tomographyIn general, DF-TEM images do not fulfill the projection requirement because the image intensity varies rapidly in a complicated manner with sample orientation. It is very difficult to acquire a tilt series of DF-TEM images of a crystalline specimen for tomography. Fortunately, KIMURA et al [9] have successfully reconstructed the D1a-ordered Ni4Mo precipitates in Ni–Mo alloy by DF-TEM tomography, and introduced how to obtain a tilt series of DF-TEM images of the Ni4Mo precipitates. Firstly, a systematic row containing the D1a superlattice reflection at (4/5, 2/5, 0) was parallel to the tilt axis of the holder by placing carefully the specimen on the specimen holder, which made the D1a superlattice reflection exist in the tilt series from −60° to +60° (see Fig. 2(a)). Secondly, by adopting the (4/5, 2/5, 0) superlattice reflection, a tilt series of DF-TEM images of the Ni4Mo precipitates were recorded (see Fig. 2(b)). Finally, the 3D shape and position of the Ni4Mo precipitates were reconstructed (see Fig. 2(c)).2.1.3 WBDF-TEM tomographyAlthough coherent diffraction contrast seems to violate the projection requirement, WBDF-TEM tomography has recently been proposed to investigate the 3D distribution of dislocation network in GaN film [10,11] and dislocation-precipitate interactions in anFig. 1 Au catalyst nanoparticles inside SBA-15 mesoporous support (a), surface rendering of slice (b) from (a), surface rendering of Au nanoparticles only (c), BF images at −55° (d), 0° (e) and +55° (f) [8]Mao-hua LI, et al/Trans. Nonferrous Met. Soc. China 24(2014) 3031−3050 3033Al−Mg−Sc alloy [12]. Figure 3(a) shows the complex 3D dislocation network in a GaN epilayer, revealing threading dislocations at small-angle grain boundaries of individual domains (D), a dislocation bundle associated with a crack tip (B), in-plane dislocations caused by threading dislocations turning over (T), a jog of an in-plane dislocation by a threading dislocation (J), and mixed dislocation (M) [10]. Figures 3(b) and (c) show 3D relationships between the dislocations and the Al3Sc particle, among the twist boundary, the dislocations, and the Al3Sc particle, respectively. The WBDF-TEM technique is suitable for observation of dislocations because a WBDF-TEM image of dislocation is narrow in width and close to the dislocation core. Therefore, WBDF-TEM tomography is probable for 3D dislocation reconstruction. To meet the projection requirement, the WBDF-TEM condition must maintain constant through the entire tilt range, so that the dislocations are visible in the entire tilt series. Unfortunately, data acquisition in WBDF-TEM tomography is very difficult because the diffraction condition must be lined up exactly along the entire tilt range. Besides, during tilting, general acquisition software cannot automatically complete due to the unstable image contrast. Consequently, the tilt series of WBDF-TEM images have to be obtained manually.2.1.4 ADF-TEM tomographyA schematic diagram of ADF-TEM is shown in Fig. 4(a). An annular objective aperture is inserted in the back focal plane of the objective lens, which shuts aFig. 2 Specimen holder and part of electron diffraction patterns along tilt series in Ni−18%Mo (mole fraction) alloy (All red arrows indicate a D1a superlattice reflection at (4/5, 2/5, 0) (a), DF images of D1a-ordered Ni4Mo precipitates at different tilt angles (b) and 3D reconstruction (c) of Ni4Mo precipitates from tilt series in (b) [9]Mao-hua LI, et al/Trans. Nonferrous Met. Soc. China 24(2014) 3031−30503034Fig. 3 3D reconstructions based on WBDF-TEM imaging: (a) Complex 3D dislocation network in GaN epilayer; (b), (c) 3D relationships between dislocations and Al3Sc particles, among twist boundary, dislocations, and Al3Sc particle, respectively [12]central beam out [13,40−42]. As a consequence, ADF-TEM imaging only makes use of electrons that are scattered in 20−40 mrad. These electrons are dominated by phonon scattering [40]. Recently, BALS et al [13] have successfully applied ADF-TEM to the 3D reconstruction of CdTe tetrapods and C nanotubes filled with Cu nanoparticles. Figure 4(b) shows an ADF-TEM image of two CdTe tetrapods with CdSe (indicated by white arrows). Obviously, a distinction between CdSe (average Z=50) and CdTe (average Z=41) is possible. Figure 4(c) shows 3D CdTe tetrapods with the lighter CdSe part (indicated by a black arrow). The advantages of ADF-TEM can be summarized as follows: 1) generating a mass-thickness contrast that fulfills the projection requirement [41]; 2) generating an atomic number contrast, namely providing chemical information in TEM mode [13,42]; 3) shortening exposure time (only 1−3 s), which provides advantages of reducing beam damage to samples and avoiding scanning noise.2.1.5 EFTEM tomographyEFTEM is able to map quantitatively the elemental species with a resolution of about 1 nm. Image signal is a monotonic function of elemental concentration and theMao-hua LI, et al/Trans. Nonferrous Met. Soc. China 24(2014) 3031−3050 3035projected specimen thickness, meeting the projection requirement. Moreover, EFTEM can strongly reduce diffraction effects. Thus, EFTEM tomography is suitable for reconstruction of 3D chemical maps on nanoscale. EFTEM tomography makes use of elemental maps or jump ratio maps as projections. In the past years, EFTEM tomography has been already used to investigate Y2O3 particles in polycrystalline FeAl [14,15], Cr carbides in 316 stainless steel [16], a chain of magnetite (Fe3O4) magnetosome in a magnetotactic bacteria (see Fig. 5(a)) [16], a C nanohorn with a Cu core (see Fig. 5(b)) [17], FeNi nanoparticles [18], N-doped carbon nanotubes [19], and so on. However, there are also some shortcomings in EFTEM ET: 1) only thin samples can fulfill the projection requirement, 2) signal-to-noise ratios are poor, and 3) the time of data acquisition is longin entire tilt series, making it unsuitable for beam-sensitive samples.Fig. 4 Schematic diagram of ADF-TEM (left) and secondary electron image of annular aperture (right) (a), ADF-TEM image of two CdTe tetrapods (b) and isosurface visualization of 3D CdTe tetrapods by ADF-TEM tomography (c)Fig. 5 EFTEM tomographic reconstructions: (a) Magnetite crystal chain with Fe (red) and O (green) (One section in the upper right corner is perpendicular to z axis. Other sections in A–E are perpendicular to the chain axis from five of the crystals [16]); (b) C nanohorn with Cu core from elemental maps [17]2.2 Based on STEM2.2.1 HAADF-STEM tomographyHAADF-STEM makes use of an annular detector with a high inner collection angle (>60 mrad). Due to Rutherford elastic scattering, HAADF-STEM image intensity is typically dominated by atomic number (Z n (1.5<n<2.0)) [43]. So, HAADF-STEM tomography provides quasi-chemical 3D information. Furthermore, HAADF-STEM imaging suppresses the diffraction effect in crystalline materials, and meets the projection requirement. At present, HAADF-STEM tomography has been widely used in materials science. For example, KANEKO et al [20] have demonstrated 3D Ge precipitates with various morphologies, such as plates (blue), tetrahedral(green), octahedral(orange), rod- shaped (yellow) and irregular shapes (white) in an Al−Ge alloy, as shown in Fig. 6(a). FENG et al [21,22] have successfully reconstructed the heterogeneously formed S (Al2CuMg) precipitates at dislocations, grain boundaries and the Al20Cu2Mn3 dispersoid/Al interfacesMao-hua LI, et al/Trans. Nonferrous Met. Soc. China 24(2014) 3031−30503036Fig. 6 3D reconstructions using STEM-HAADF tomography: (a) Ge precipitates with various morphologies such as plates (blue), tetrahedral (green), octahedral (orange), rod-shaped (yellow) and irregular shapes (white) [20]; (b) Distribution of S precipitates along helical dislocation [21]; (c) Morphology and distribution of S precipitates from direction perpendicular to central part of grain boundary [21,22]; (d) Configuration of S precipitates (yellow) around dispersoid (blue), with both needle-like and granular morphologies [21]in Al−Cu−Mg alloy (see Figs. 6(b)−(d)). Besides, this technology has been used to reconstruct Guinier−Preston zones in the Al−Ag system [23], Au nanoparticles supported on TiO2 catalyst [24], Sn-rich quantum dots embedded in a Si matrix [25], CeO2 nanoparticles [26], TiO2 nanotubes [27], GaP−GaAs core-shell nanowires [28], and so on.Although HAADF-STEM tomography is a very powerful tool to reconstruct actual 3D structure of nanoscale materials with complex morphology and chemistry, it also has some unavoidable disadvantages. Exposure (scanning) time per image generally requires 10−30 s. Long time scanning not only produces more scanning noise but also makes it unsuitable for beam-sensitive samples. HAADF-STEM tomography is unfit for some nanostructures such as lattice defects, grain boundaries, orientation variants of ordered domains, because these nanostructures are only related to diffraction contrast images. HAADF-STEM tomography is unsuitable for multiphase materials which consist of the elements with neighboring atomic number because of low-contrast.Mao-hua LI, et al/Trans. Nonferrous Met. Soc. China 24(2014) 3031−3050 30372.2.2 ADF-STEM tomographyBoth the inner collection angle of an annular detector and the convergence angle for ADF-STEM imaging are smaller than that for HAADF-STEM imaging. TANAKA et al [29,30] have successfully reconstructed dislocations in a Si crystal by ADF-STEM tomography. Figure 7(a) shows a schematic diagram showing the diffraction vector of g=220 maintained in the annular detector during the entire tilt series. Figure 7(b) shows 3D dislocations viewed from different orientations. The dislocations are colored according to their slip systems.Fig. 7 Schematic diagram of diffraction vector of g=220 maintained in annular detector [29] (a), 3D reconstruction of dislocations in Si crystal by tilt series of ADF-STEM images (b) [30]For dislocation, ADF-STEM tomography technique is more feasible than WBDF-TEM tomography. The reasons include the following aspects: 1) The ADF-STEM technique suppresses diffraction contrast because of multiple beams and the convergent beam, while the WBDF imaging utilizes only one reflection; 2) The ADF-STEM tomography allows large deviations from the exact diffraction vector to image dislocations along a tilt series, and the dislocation contrast is much more consistent by ADF-STEM imaging than by WBDF imaging in the entire tilt range. As a result, automation of data acquisition in ADF-STEM tomography is practicable for reconstruction.2.2.3 IBF-STEM tomographyFor HAADF-STEM technique, the acceptable sample thickness is 50−100 nm. When samples are thicker, the image contrast reversal would arise [31]. The reason for this phenomenon is that the thick and/or high atomic number materials lead to increased backscatter and multiple scattering events to high angles. The angle of the electron beam detector in IBF-STEM is generally set to be 0−100 mrad to suppress diffraction contrast, and avoid contrast reversal at all thick materials. ERCIUS et al [31] have investigated thick copper microelectronic structures with a stress void by IBF-STEM tomography and HAADF-STEM tomography, respectively (see Fig. 8). The results indicate that the 3D reconstruction using IBF-STEM imaging shows the precise location of the stress void without artifacts.2.2.4 EELS-STEM tomographyEELS-STEM spectrum imaging is successfully utilized to analyze the elemental, physical and chemical state information in nanoscale materials [44−46]. In Refs. [32−34], researchers have used EELS-STEM tomography to probe a W-to-Si contact from semiconductor device, a ZnO thin film, mesoporous a Co3O4 particles filled with Fe x Co3−x O4 and multiwalled carbon nanotubes (MWCNT)–nylon nanocomposite in 3D. Figure 9(a) shows a schematic diagram revealing the collection of an energy-loss series at each tilt angle and each energy window with a specific voxel P in the 3D volume. Figure 9(b) shows surface renders of the MWCNT (purple) within the nylon (gray) viewed from different angles using plasmon-loss electrons. The hole in the nylon and the voids in the MWCNT are obviously visible in 3D [34].2.2.5 XEDS-STEM tomographyRecently, XEDS spectrum imaging technique has been utilized to resolve 3D chemical studies in nanoscale materials [35−37]. Compared with HAADF-STEM tomography, XEDS-STEM tomography has obvious superiority in enhancing chemical contrast especially between neighboring atomic numbers in the multiphase materials. Compared with EFTEM and EELS spectrum imaging, XEDS imaging can obtain the maps of a large number of elements simultaneously. GENC et al [35] have demonstrated 3D distribution of elements in a Li1.2Ni0.2Mn0.6O2 (LNMO) nanoparticle based on XEDS-STEM imaging. Figure 10(a) shows 3D elemental distribution of Mn (red) indicating relativelyMao-hua LI, et al/Trans. Nonferrous Met. Soc. China 24(2014) 3031−3050 3038Fig. 8 Imaging stress void in copper interconnect with Ta electromigration liners: (a), (b) 2D images from HAADF- STEM and IBF-STEM; (c), (d) Slices of 3D reconstruction based on HAADF-STEM and IBF-STEM tomography; (e), (f) Reconstruction using HAADF-STEM and IBF-STEM technology (Arrows indicate the artificial voids at the bottom of the Cu interconnect) [31]homogeneous distribution of Mn in the nanoparticle. Figure 10(b) shows 3D elemental distributions of Ni (green) indicating segregation of Ni at grain boundaries and at some surface locations on the outer rim of the nanoparticle. Figure 10(c) shows 3D elemental distributions of Mn and Ni. Figure 10(d) shows 3D elemental distribution of O (blue) indicating fairly homogeneous distribution of O element in the nanoparticle. Figure 10(e) shows 3D elemental distributions of Mn and O.However, the geometry of traditional single detector limits acquisition of the XEDS imaging in a complete tilt series because the sample or the holder will shadow the single detector and the intensity of X-ray will vary significantly with the tilt angle of sample. This problem is able to be avoided using a needle specimen preparedFig. 9 Energy-loss series of 2D images at each angle and each energy window showing specific voxel P in 3D volume (a) and surface renders of MWCNT (purple) and nylon (gray) viewed from different angles (b) [34]by a focused-ion beam (FIB) instrument [36] or a symmetrically arranged four XEDS detectors [35], as shown in Fig. 11.2.3 4D tomography2.3.1 4D chemical compositionA spectroscopic electron microscopy makes use of inelastically scattered electrons, which can obtain mappings of elemental species over wide fields of view at nanoscale materials. The type of spectroscopic electron microscopy includes EFTEM [14−19], EELS-STEM [32−34] and XEDS-STEM [35−37]. The technique acquires a 4D data set I=I(x, y, θ, ΔE), containing two spatial dimensions x and y, the rotation angle θ, and the selected spectrometer energy ΔE.Mao-hua LI, et al/Trans. Nonferrous Met. Soc. China 24(2014) 3031−3050 3039Fig. 10 Volume renders of 3D visualizations of LNMOnanoparticle using XEDS spectrum imaging: 3D elementaldistribution of Mn (red) (a), Ni (green) (b), composite of Mnand Ni (c), O (blue) (d), as well as composite of Mn and O (e) [35]2.3.2 4D timeIn order to better understand the relationship between the structures and the properties, dynamic ET isneeded to study the nonequilibrium structures and complex transient processes. ZEWAIL [38] and KWONet al [39] have reported 4D UEM which possesses nanometer spatial resolution and femtosecond temporal resolution. The UEM records the images with ultrafast electron packets derived from a train of ultrafast (femtosecond or picosecond) pulses. KWON and ZEWAIL [39] have demonstrated the different motion modes of the carbon nanotubes with a bracelet-like ring structure using 4D UEM. Figure 12(a) shows a schematic diagram of 4D ET with time resolution. At t 0, the heating pulse initiates the structural change. At t α, the time-delayed electron packet images the structure at a given tilt angle α. Figure 12(b) shows a series of 2D images at various projection angles and time steps. Figure 12(c) shows 4D visualization of the nanotubes for two angles at relatively early time. The original volumes at t =0 and those volumes at different time delay are colored respectively by black and beige. Figure 12(d) shows 4D tomography of the bracelet at longer time. Different colors denote the volumes at different time delay. White arrows indicate the direction of breathing motion (see Fig. 12(c)) and wiggling motion (see Fig. 12(d)).3 Optimized tilt seriesDuring the process of acquiring the 2D projections, a tilt range of ±90° is mostly improbable. The reasons are summarized as three respects: 1) The space between the specimen holder and the objective lens pole pieces is limited. For this reason, the tilting range of an advancedsingle-tilt tomography holder is at most ±80°; 2) The thickness of conventional TEM samples will dramatically increase with the increasement of the tilt angle. For example, the specimen thickness becomestwice at 60° and close to three times at 70°; 3) The shadow arises due to the holder, grid or other parts of thespecimen. The limited tilt range leads to a “missing wedge” of information (see Fig. 13(a)), which results in reconstruction artifacts such as fanning and elongation effects in the direction of the missing wedge, especially when the object is highly anisotropic [47,48].Fig. 11 Schematic diagrams of geometrical configuration between pillar-shaped specimen and XEDS detector [36] (a), and symmetrically arranged four XEDS detectors around specimen (b) [35]Mao-hua LI, et al/Trans. Nonferrous Met. Soc. China 24(2014) 3031−30503040Fig. 12 Schematic diagram of 4D ET with time resolution (a), a series of 2D images at various projection angles and time steps (b), snapshots of 4D visualization of nanotubes for two angles at relatively early time (c) and 4D tomography of bracelet at longer time (d) (White arrows indicate the direction of motion) [39]In order to reduce the missing wedge, several alternative techniques have been put forward, including dual-axis tilt tomography [47−50], on-axis tilt tomography [36, 51−53], conical tilt tomography [54], EST [55−57], and so on. This part will introduce the first three of these mentioned tilt series, EST will be highlighted in the next section of advanced reconstruction algorithms.3.1 Dual-axis tilt tomographyFor the so call “dual-axis” tilt series, 2D projections are acquired from two orthogonal single-axis tilt series [47−50], in which the second tilt series can be accomplished with rotating specimen by 90°. UsingMao-hua LI, et al/Trans. Nonferrous Met. Soc. China 24(2014) 3031−3050 3041dual-axis tilt tomography, the missing wedge in Fourier space will be reduced to a missing pyramid (see Fig. 13(b)). Therefore, the dual-axis tilt technique canimprove the fidelity of tomographic reconstructions and reduce artifacts. Figure 14 describes the 3D reconstructions of CdTe tetrapods from one single-axis tilt series, another perpendicular single-axis tilt series and dual-axis tilt series, respectively, showing theincrease in the information of 3D reconstruction by dual-axis tilt series [47]. Figure 14(a) shows that some of the legs of the tetrapods are missing or weak due to the missing wedge (indicated by the arrows). In Fig. 14(b),Fig. 13 Schematic diagram of missing wedge generated due to restricted tilt range in Fourier space (a) (θ is the sampling angle and α is the maximum tilt angle) and missing wedge (gray) reduced to missing pyramid (green) by dual-axis tilt tomography (b) [47,48]Fig. 14 3D reconstructions of CdTe tetrapods: (a) Reconstructions from same volume using one single-axis tilt series; (b) Another perpendicular single-axis tilt series; (c) Dual-axis tilt series; (d) Magnification of tetrapod boxed shown in (c) [47]Mao-hua LI, et al/Trans. Nonferrous Met. Soc. China 24(2014) 3031−3050 3042although the missing legs in Fig. 14(a) are present, some legs from another direction are missing (indicated by the arrows). Figure 14(c) illustrates that no legs are missing. Figure 14(d) shows the magnification of the tetrapod boxed shown in Fig. 14(c).3.2 On-axis tilt tomographyOn-axis tilt is a full 360° single-axis tilt. A micropillar sample mounted on a dedicated tomography holder is used in this technique, as shown in Fig. 11(a) [36,51−53]. It allows the sample to rotate over a tilt range of 360°. The size of specimens manufactured by a FIB technique is approximately 100−300 nm. The on-axis rotation holder is able to eliminate the missing wedge, thus, the fanning and elongation effects will be minimized [36,51−53]. KE et al [53] have demonstrated slices of the 3D reconstruction from carbon nanotubes (CNTs) inside semiconductor contact holes using two different tilt series: ±90° (Figs. 15(a), (c)) and ±70° (Figs. 15(b), (d)). Long white arrows indicate fanning effects due to the missing wedge in Figs. 15(b) and (d). A CNT (indicated by short white arrow) is clearly observed in Fig. 15(a), but is faint in Fig. 15(b). Another short white arrow (Fig. 15(d)) indicates a fanning effect, which might be misinterpreted as a CNT. The results indicate that on-axis tilt series can improve the fidelity of reconstructions. In addition, pillar-shaped specimens can be used to resolve the problem of the sample thickness increasing at higher tilt angles.3.3 Conical tilt tomographyLANZA VECCHIA et al [54] have reported a conical tilt tomography. Through this method, the missing wedge in Fourier space will be reduced to the missing cone. Figure 16 shows the schematic diagrams of a single-axis tilt tomography, a dual-axis tilt tomography and a conical tilt tomography in Fourier space, from which it can be seen that the conical tiltFig. 15 Slices of CNTs grown inside semiconductor contact holes at two different positions using full ±90° tilt series (a) and (c), and ±70° tilt series (b) and (d), respectively) [53]。
红外光谱法研究再生丝素蛋白薄膜的构象转变

第49卷第9期2021年5月广州化工Guangzhou Chemical IndustryVol.49No.9May.2021红外光谱法研究再生丝素蛋白薄膜的构象转变吴永琼,程佳琪,唐雨冉,黄川,郭鸣明(西南大学化学化工学院,重庆400715)摘要:通过流延法制备的再生丝素蛋白薄膜具有高透光率和可控的降解速率,是制造柔性透明电子器件的理想基底材料。
但再生丝素蛋白薄膜的结构和性质通常受溶液性质的影响。
在此,本文使用高温高压法从蚕茧中提取丝素蛋白,并通过流延法制备了再生丝素蛋白及其复合膜。
结合红外光谱以及傅立叶自解卷积的方法分析发现,碱性物质能够有效削弱高温和糖类化合物对丝素蛋白构象转变的促进作用。
关键词:丝素蛋白;薄膜;构象转变;红外光谱中图分类号:0657文献标志码:A文章编号:1001-9677(2021)09-0095-05 Study on Conformational Transition of Regenerated Silk FibroinFilms by Infrared SpectroscopyWU Yong-qiong,CHENG Jia-qi,TANG Yu-ran,HUANG Chuan,GUO Ming-ming(School of Chemistry and Engineering,Southwest University,Chongqing400715,China)Abstract:The regenerated silk fibroin film prepared by casting method has high light transmittance and controllable degradation rate,which is an ideal substrate material for manufacturing flexible and transparent electronic devices. However,the structure and properties of regenerated silk fibroin films are usually affected by properties of solution.Here, silk fibroin was extracted from silkworm cocoons by the high temperature and high-pressure method,and the regenerated silk fibroin and its composite film were prepared by casting method.The effects of alkaline substances and carbohydrate compounds on the secondary structure of regenerated silk fibroin films were analyzed by infrared spectroscopy.Key words:silk fibroin;film;conformational transition;infrared spectroscopy再生丝素蛋白薄膜具有良好的机械性能、可弯曲性、低表面粗糙度和高透明度,可用于柔性透明器件,其机械性能和降解速率取决于丝素蛋白的分子量和稳定构象的含量。
ZnGa2O4微晶玻璃
Cite this: J. Mater. Chem. C, 2014, 2, 10002
Long-lasting luminescent ZnGa2O4:Cr3+ transparent glass-ceramics†
ab a a b a Se ´bastien Chenu,* Emmanuel Ve ´ron, Ce ´cile Genevois, Alain Garcia, Guy Matzen a and Mathieu Allix*
Institut de Chimie de la Mati` ere Condens´ ee de Bordeaux, 87 Avenue du Docteur Schweitzer, 33608 Pessac, France † Electronic supplementary 10.1039/c4tc02081b information (ESI) available. See DOI:
Introduction
A long-lasting luminescent material presents light emission for a long time (i.e. minutes or hours) aer stopping the excitation source.1 Such phosphors have been of great research interest as night or dark environment vision materials for a wide range of applications such as security signs, emergency route signage, identication markers, or medical diagnostics.2 Among the eligible materials, the red long-lasting luminescence properties of the ZnGa2O4:Cr3+ spinel material have been extensively studied, particularly for application in in vivo bioimaging.3–5 Different attempts have been carried out to improve the emission intensity and duration3,6 and the long lasting luminescence mechanism has been revealed.7 Recently, Zn1+xGa2À2x(Ge/Sn)xO4 (0 # x # 0.5) spinel solid solutions have been reported8 to exhibit very bright and long lasting red luminescence for more than 360 h.9,10 In these studies, the persistent phosphors are elaborated by a usual solid-state process, which yields opaque polycrystalline ceramic materials. Therefore, only the surface of the material is active for light emission, thus limiting the eld of applications such as signage to luminescent paints or inks.9,10 Because of the ability to transmit light in the entire material volume and the intrinsic advantages of a crystalline host, transparent crystallized materials have attracted considerable
- 1、下载文档前请自行甄别文档内容的完整性,平台不提供额外的编辑、内容补充、找答案等附加服务。
- 2、"仅部分预览"的文档,不可在线预览部分如存在完整性等问题,可反馈申请退款(可完整预览的文档不适用该条件!)。
- 3、如文档侵犯您的权益,请联系客服反馈,我们会尽快为您处理(人工客服工作时间:9:00-18:30)。
Abstract
According to the Kosterlitz-Thouless-Theory two-dimensional solid films melt by the unbinding of dislocation pairs. A model including quenched random impurities was already studied by Nelson [Phys. Rev. B 27 (1983) 2902] , who predicted a reentrance into the disordered phase at low temperatures and weak disorder. New investigations of the physically related XY-model [e.g. T. Nattermann et al., J. Phys. (France) 5 (1995), 565] and a work of Cha and Fertig [Phys. Rev. Lett. 74 (1995) 4867] refuse this reentrant melting. In this work we map the system onto a two-dimensional vector Coulomb gas and via a renormalization we derive flow equations both for the square and for the triangular lattice. An analysis of these flow equations shows a new behaviour in the low- temperature range, where the reentrance into the non-crystalline phase with short-range order is not found, but the crystalline phase with quasi1 long-range order is preserved below a critical disorder strength of σ ¯c = 16 π. Finally we estimate the influence of commensurate substrates and obtain phase diagrams, which show that the melting by dislocation unbinding can only be expected, if the lattice constant of the crystalline film is a multiple of the lattice constant of the substrate potential.
Polarisierbarkeit . . . . . . . . . . . . . . . . . . . . . . . . . . . 3.3.1 3.3.2
Polarisierbarkeit mit Unordnung . . . . . . . . . . . . . .
INHALTSVERZEICHNIS 4 Flußgleichungen und Phasendiagramme 4.1 Ergebnisse f¨ ur das Quadratgitter . . . . . . . . . . . . . . . . . . 4.1.1 4.1.2 4.2 Herleitung der Flußgleichungen . . . . . . . . . . . . . . . Fluß und Phasendiagramm . . . . . . . . . . . . . . . . . 45 45 45 47 49 49 52 52 54 57 57 63 69 71 71 73 77 77 78 81 81 82 85 85 87 89
Ergebnisse f¨ ur das Dreiecksgitter . . . . . . . . . . . . . . . . . . 4.2.1 4.2.2 4.2.3 Modifikationen f¨ ur das Dreiecksgitter . . . . . . . . . . . . Flußgleichungen f¨ ur das Dreiecksgitter . . . . . . . . . . . Phasendiagramm f¨ ur das Dreiecksgitter . . . . . . . . . .
arXiv:cond-mat/9710344v1 [cond-mat.stat-mech] 31 Oct 1997
Melting of crystalline films with quenched random disorder
Diploma thesis
Peter Stahl∗ Institut f¨ ur Theoretische Physik, Universit¨ at zu K¨ oln, Z¨ ulpicher Str. 77, D-50937 K¨ oln, Germany
2.3
Bisherige Resultate . . . . . . . . . . . . . . . . . . . . . . . . . . 2.3.1 2.3.2 Wiedereintritt in die ungeordnete Phase . . . . . . . . . . Scheitern der N¨ aherung f¨ ur kleine Fugazit¨ aten . . . . . .
2 Das Modell 2.1 Herleitung des Modells . . . . . . . . . . . . . . . . . . . . . . . . 2.1.1 2.1.2 2.2 Kristalliner Film ohne Unordnung . . . . . . . . . . . . . Beschreibung der Unordnung . . . . . . . . . . . . . . . .
∗
now: Institute of Process Engineering, Swiss Federal Institute of Technology (ETH Z¨ urich), CH-8092 Z¨ urich, Switzerland
Inhaltsverzeichnis
1 Einleitung 1.1 1.2 Der Kosterlitz-Thouless-Phasen¨ ubergang . . . . . . . . . . . . . . Der Einfluß von Unordnung . . . . . . . . . . . . . . . . . . . . . 1 2 8 11 11 11 14 15 16 18 20 20 22 24 29 29 34 36 36 37 38 39 41 i
4.3
. . . . . . . . . . . . . . . . . . . . . .
5 Einfluß eines Substrats 5.1 5.2 Kommensurables Substrat . . . . . . . . . . . . . . . . . . . . . . Phasendiagramm bei unterliegendem Substrat . . . . . . . . . . .
Abbildung auf ein Coulombgas . . . . . . . . . . . . . . . . . . . 2.2.1 2.2.2 Abbildung des Systems ohne Unordnung . . . . . . . . . . Abbildung des Unordnungsanteils . . . . . . . . . . . . . .
6 Zusammenfassung A Coulombgas-Beschreibung A.1 Abbildung auf ein Coulombgas . . . . . . . . . . . . . . . . . . . A.2 Vergleich mit der Elektrodynamik B Unordnungswechselwirkung B.1 Varianz bei einer einzelnen freien Versetzung . . . . . . . . . . . B.2 Varianz bei einem Versetzungsdipol . . . . . . . . . . . . . . . . . C Berechnungen zur Polarisierbarkeit C.1 Polarisierbarkeit in der Elektrodynamik . . . . . . . . . . . . . . C.2 Winkelintegration des Dipoltensors . . . . . . . . . . . . . . . . . D Mittelung des Ordnungsparameters D.1 Berechnung ohne Unordnung . . . . . . . . . . . . . . . . . . . . D.2 Berechnung mit Unordnung . . . . . . . . . . . . . . . . . . . . . Literaturverzeichnis . . . . . . . . . . . . . . . . .
ii
Kapitel 1
Einleitung
In der Festk¨ orperphysik versteht man unter einem dreidimensionalen Kristall eine (fast) unendliche Wiederholung identischer Struktureinheiten, die Translationssymmetrie aufweist. Der Anteil der Struktureinheiten, die die Oberfl¨ ache bilden soll verschwindend gering sein. In drei Dimensionen bilden alle Stoffe - sieht man von Helium und Quasikristallen wie Al86 Mn14 ab - solche kristallinen Strukturen, die aber von eingefrorener Unordnung gest¨ ort werden k¨ onnen. Daher geh¨ oren auch dreidimensionale Kristallstrukturen wie Metalle zum allt¨ aglichen Erfahrungsbereich und das Schmelzen der Kristalle zu Fl¨ ussigkeiten bei Temperaturerh¨ ohung kann unter geeignetem Druck beobachtet werden. Hierbei handelt es sich um einen Phasen¨ ubergang erster Ordnung, bei dem ein Sprung in der Entropie auftritt. Ausgel¨ ost wird er durch die energetische Anregung des Gitters. Obwohl sie auf Oberfl¨ achen h¨ aufig auftreten sind zweidimensionale kristalline Filme hingegen nicht so leicht zu beobachten, dennoch kann man das Schmelzen auch hier an einigen Systemen untersuchen. Dies sind unter anderen: • Elektronen, die in einer einzigen Schicht etwa 100 ˚ Au ache ¨ ber der Oberfl¨ fl¨ ussigen Heliums aufgebracht werden. Dies geschieht mittels eines elektrischen Felds, welches senkrecht zur Oberfl¨ ache steht [1] . Bei gen¨ ugend geringer Dichte verhalten sie sich klassisch. • Polystyrolkugeln mit einem Durchmesser von etwa 0,3 µm bilden in L¨ osungen mit geeignetem pH-Wert Kolloide. Bringt man diese zwischen zwei Glasplatten mit einem Abstand von etwa 1 µm, formen diese Kugeln ein zweidimensionales Dreiecksgitter, nehmen also Kristallstruktur an [8]. Die Phasen¨ ubergangs-Temperatur ist dabei systemabh¨ angig. Sie wird von der Gitterkonstanten und den Lam´ e-Koeffizienten bestimmt. Dies f¨ uhrt dazu, daß die erw¨ ahnte Elektronenschicht eine Schmelztemperatur von etwa 1 K hat, w¨ ahrend die Schmelztemperatur der Kolloide in der Gr¨ oßenordnung von 102 K liegt. Im Gegensatz zum dreidimensionalen Fall, gibt es bei freien zweidimensionalen Kristallstrukturen f¨ ur T > 0 aufgrund von Fluktuationen in den Moden der 1