Development and Validation of Gel-Chromatographic and Spectrophotometric Methods for Quantitative
粮食中赭曲霉素A检验方法的研究进展
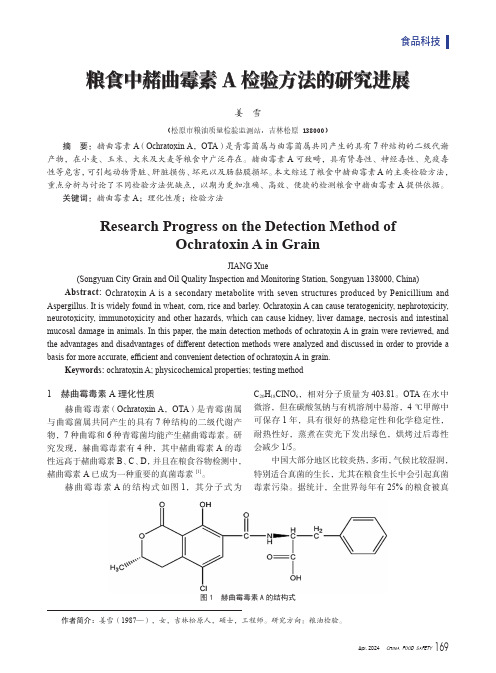
Apr. 2024 CHINA FOOD SAFETY169食品科技粮食中赭曲霉素A 检验方法的研究进展姜 雪(松原市粮油质量检验监测站,吉林松原 138000)摘 要:赭曲霉素A (Ochratoxin A ,OTA )是青霉菌属与曲霉菌属共同产生的具有7种结构的二级代谢产物,在小麦、玉米、大米及大麦等粮食中广泛存在。
赭曲霉素A 可致畸,具有肾毒性、神经毒性、免疫毒性等危害,可引起动物肾脏、肝脏损伤、坏死以及肠黏膜损坏。
本文综述了粮食中赭曲霉素A 的主要检验方法,重点分析与讨论了不同检验方法优缺点,以期为更加准确、高效、便捷的检测粮食中赭曲霉素A 提供依据。
关键词:赭曲霉素A ;理化性质;检验方法Research Progress on the Detection Method ofOchratoxin A in GrainJIANG Xue(Songyuan City Grain and Oil Quality Inspection and Monitoring Station, Songyuan 138000, China)Abstract: Ochratoxin A is a secondary metabolite with seven structures produced by Penicillium and Aspergillus. It is widely found in wheat, corn, rice and barley. Ochratoxin A can cause teratogenicity, nephrotoxicity, neurotoxicity, immunotoxicity and other hazards, which can cause kidney, liver damage, necrosis and intestinal mucosal damage in animals. In this paper, the main detection methods of ochratoxin A in grain were reviewed, and the advantages and disadvantages of different detection methods were analyzed and discussed in order to provide a basis for more accurate, efficient and convenient detection of ochratoxin A in grain.Keywords: ochratoxin A; physicochemical properties; testing method1 赫曲霉毒素A 理化性质赫曲霉毒素(Ochratoxin A ,OTA )是青霉菌属与曲霉菌属共同产生的具有7种结构的二级代谢产物,7种曲霉和6种青霉菌均能产生赭曲霉毒素。
银杏达莫联合依达拉奉右莰醇治疗急性脑梗死的疗效分析

DOI:10.19368/ki.2096-1782.2023.11.181银杏达莫联合依达拉奉右莰醇治疗急性脑梗死的疗效分析张楠,冯彦梅邳州市中医院脑病科,江苏邳州221300[摘要]目的探究急性脑梗死应用银杏达莫联合依达拉奉右莰醇治疗的临床疗效。
方法选取2020年6月—2022年12月邳州市中医院收治的78例急性脑梗死患者为研究对象,以随机数表法分为两组,对照组39例应用依达拉奉右莰醇治疗,研究组39例应用银杏达莫联合依达拉奉右莰醇治疗,对比两组疗效、不良反应、血液流变指标、神经功能缺损评分、日常生活能力评分及炎性因子水平。
结果研究组总有效率高于对照组(94.87% vs 79.49%),差异有统计学意义(χ2=4.129,P<0.05)。
治疗前,两组血液流变指标、神经功能缺损评分、功能恢复评分及炎性因子水平比较,差异无统计学意义(P>0.05)。
治疗后,研究组红细胞沉降率、血浆黏度水平均较对照组更低,差异有统计学意义(P<0.05)。
研究组神经功能缺损评分为(5.65±0.68)分,较对照组的(6.29±1.07)分更低,功能恢复评分为(3.68±0.63)分,较对照组的(3.22±0.58)分更高,差异有统计学意义(t= 3.153、3.355,P<0.05)。
研究组白介素-6、肿瘤坏死因子水平比对照组更低,差异有统计学意义(P<0.05)。
两组不良反应发生率比较,差异无统计学意义(P>0.05)。
结论银杏达莫联合依达拉奉右莰醇用于急性脑梗死治疗,患者血液流变学及神经功能均得到极大缓解,炎性因子水平降低,日常生活能力提升,安全可靠。
[关键词]银杏达莫;依达拉奉右莰醇;急性脑梗死;神经功能;生活能力;不良反应[中图分类号]R743 [文献标识码]A [文章编号]2096-1782(2023)06(a)-0181-04Analysis of the Efficiency of Ginkgundamo Combined with Edaravone and Dexborneol in the Treatment of Acute Cerebral InfarctionZHANG Nan, FENG YanmeiDepartment of Cerebral Disease, Pizhou Hospital of Traditional Chinese Medicine, Pizhou, Jiangsu Province, 221300 China[Abstract] Objective To investigate the clinical efficacy of acute cerebral infarction treated with Ginkgundamo com⁃bined with edaravone and dexborneol. Methods 78 patients with acute cerebral infarction admitted to Pizhou Hospital of Traditional Chinese Medicine from June 2020 to December 2022 were selected as the research objects. They were divided into two groups by random number table. 39 patients in the control group were treated with edaravone and dex⁃tranol, and 39 patients in the study group were treated with ginkgundamo combined with edaravone and dextranol. The efficacy, adverse reactions, hemorheological indicators, neurological deficit scores, fuctional recoveny scores, and lev⁃els of inflammatory factors of the two groups were compared. Results The total effective rate of the research group was higher than that of the control group (94.87% vs 79.49%), and the difference was statistically significant (χ2=4.129, P< 0.05). Before treatment, there was no statistically significant difference between the two groups in terms of blood rheol⁃ogy indicators, neurological deficit score, daily living ability score, and inflammatory factor levels (P>0.05). After treat⁃ment, the erythrocyte sedimentation rate and plasma viscosity level in the study group were lower than those in the control group, and the difference was statistically significant (P<0.05). The neurological deficit score of the study group was (5.65±0.68) points, which was lower than the control group´s (6.29±1.07) points, and the fuctional recoveny score was (3.68±0.63) points, which was higher than the control group´s (3.22±0.58) points, and the difference was sta⁃[作者简介] 张楠(1988-),女,本科,主治医师,主要从事脑病科临床工作。
C18键合磁珠固相萃取液质联用检测蜂王浆中磺胺二甲嘧啶残留
安徽农业科学。
JournalofAnhuiAsh.Sci.2012。
40(27):13586—13587责任编辑李菲菲责任校对李岩C。
8键合磁珠固相萃取一液质联用检测蜂王浆中磺胺二甲嘧啶残留李金峰1,李颖1,蒋原2,薛峰2,朱海h(1.深圳市易瑞生物技术有限公司,广东深圳518102;2.江苏出入境检验检疫局动植物-b食品检测中心,江苏南京210001)摘要[目的]建立一种应用c,。
键合磁珠固相萃取一液质联用检测蜂王浆中磺胺二甲嘧啶残留的方法。
[方法]MCX固相萃取小柱联合c.。
磁珠对蜂王浆进行前处理,用HPLC一串联质谱仪对净化后样本进行检测。
[结果]该方法的线性范围是5~80斗g/kg,相关系数0.9931。
添加水平为5、10、20¨g/k时各种化合物的平均回收率范围为93%~104%,RsD值均不大于11.3%。
[结论]该方法简单、快速,结合自动化设备,可实现蜂王浆样品中磺胺二甲嘧啶测定前处理的自动化。
关键词固相萃取;磁珠;磺胺二甲嘧啶;超高效液相色谱一串联质谱中图分类号s609.9文献标识码A文章编号0517—6611(2012)27—13586—02DeterminationofSuifadimidineinRoyalJellybyC18"functionalizedMagneticSilicaNanoparticlesSolidPhaseExtraction--HighPer-formanceLiquidChromatography--TandemMassSpectrometryLIJin-fengetal(ShenzhenBioeasyTechnology,Inc.,Shenzhen,Guangdong518102)Abstract[Objective]TodevelopamethodofCls-funetionalizedmagneticsilicananoparticlessolidphaseextraction—highperformanceliquidchromatography—tandemmassspectrometryfordeterminationofsulfadimidineinroyaljelly.[Method]‘rheroyaljellysampleswerepretreatedbyMCXSPEcolumnandCFfunctionalizedmagneticsilicananoparticles,thedetectionwascarriedoutbyHPLC—MS/MS.1Result】nede-tectionmethodshowedgoodlinearrelationshipintherangeof5—80¨g/kg(r=0.9931).Therecoveryrangeswerebetween93%一104%withtherelativestandarddeviations(RSD)below11.3%.[Conclusion]rI’}lepretreatmentmethodissimple,fast,time—saving,andeasytorealizetheautomationofpretreatmentwiththeautomaticequipment.KeywordsSolidphaseextraction;Magneticsilicananoparticles;Sulfadimidine;Highperformanceliquidchromatography--tandemmassspectrometry磺胺类药物为一类广谱抗菌药,由于其性质稳定、价廉易得,被广泛应用于畜禽养殖的病虫害防治。
高效液相色谱法测定四环素类抗生药物中土霉素_强力霉素_四环素和金霉素
理化检验 —化学分册
吕海涛等 :高效液相色谱法测定四环素类抗生药物中土霉素 、强力霉素 、四环素和金霉素
的吸附作用 ,往往会引起色谱峰拖尾 ,柱效下降 。根 据四环素类药物在中性或碱性条件下能与 Mg2 + 、 Ca2 + 等很多金属离子反应生成具有强紫外吸收的 稳定配合物的特点 ,本文利用高效液相色谱法 ,使用 光电二极管阵列检测器 ,建立了一种简便 、快速 、灵 敏的测定四环素类药物的方法 ,能同时测定四环素 (O TC) 、土霉素 ( DC) 、金霉 素 ( C TC) 和强 力霉 素 ( TC) ,并成功地应用于抗生素药片中四环素类药物 的测定 。
L Β Ha i2tao
( T he Col le ge of S cience , L ai y an g A g ricult u ral U ni versi t y , S han don g 266109 , Chi na)
CHEN Feng
( De pt. of B ot any , T he U ni versit y of Hon g Kon g)
称取 经 粉 碎 过 筛 后 的 四 环 素 类 药 片 粉 末 0. 200 0 g ,加入流动相 B 液 50 mL ,在常温下超声 波浸取 10 min ,过滤 ,用少量流动相 B 洗涤残渣 ,定 容至 100 mL 。分析测定时 ,再用流动相 B 稀释至适 当的浓度 。此溶液可在 4 ℃暗处稳定放置 2d 。
(香港浸会大学 生物学系 , 香港)
摘 要 : 利用高效液相色谱 ,发展了一种快速 、灵敏 、同时测定土霉素 、强力霉素 、四环素和金霉 素的方法 。在反相 C18 柱上进行梯度洗脱分离 ,流动相由甲醇和乙酸钠缓冲溶液组成 (内含 ED TA 和氯化钙 ,p H 8. 10) , 紫外检测波长为 386 nm 。四环素类药物的质量浓度在 8~4 000μg ·L - 1 范 围内呈线性关系 ,回收率为 95 %~102 % ,相对标准偏差为 1. 2 %~3. 6 % ,检出限分别为 6 ,13 ,6 和 7μg ·L - 1 ,方法应用于四环素类抗生药物的分析 。
OECD234

© OECD, (2011) You are free to use this material for personal, non-commercial purposes without seeking prior consent from the OECD, provided the source is duly mentioned. Any commercial use of this material is subject to written permission from the OECD.
OECD/OCDE
Hale Waihona Puke 234Adopted: 28 July 2011
OECD GUIDELINE FOR THE TESTING OF CHEMICALS
Fish Sexual Development Test INTRODUCTION 1. This Test Guideline (TG) is based on a decision from 1998 to develop new or update existing TGs for the screening and testing of potential endocrine disrupters. The Fish Sexual Development Test (FSDT) was identified as a promising test method covering a sensitive fish life stage responsive to both oestrogen and androgen-like chemicals. The test method went through an inter-laboratory validation exercise from 2006 to 2010, where Japanese medaka (Oryzias latipes), zebrafish (Danio rerio) and three spined stickleback (Gasterosteus aculeatus) were validated and fathead minnow (Pimephales promelas) was partially validated (41) (42) (43). This protocol includes Japanese medaka, the three-spined stickleback and zebrafish. The protocol is in principle an enhancement of TG 210: Fish, Early Life Stage Toxicity Test (1), where the exposure is continued until the fish are sexually differentiated, i.e. about 60 days post-hatch (dph) for Japanese medaka, the three-spined stickleback and zebrafish (the exposure period can be shorter or longer for other species that are validated in the future), and endocrine-sensitive endpoints are added. The FSDT assesses early life-stage effects and potential adverse consequences of putative endocrine disrupting chemicals (e.g. oestrogens, androgens and steroidogenesis inhibitors) on sexual development. The combination of the two core endocrine endpoints, vitellogenin (VTG) concentration and phenotypic sex ratio enable the test to indicate the mode of action of the test chemical. Due to the population-relevant change in phenotypic sex ratio, the FSDT can be used for hazard and risk assessment. However, if the test is used for hazard or risk assessment, the stickleback should not be used because the validation data available so far showed that in this species the alterations of phenotypic sex ratio by the test substances were uncommon. 2. The protocol is based on fish exposed via water to chemicals during the sex labile period in which the fish is expected to be most sensitive to the effects of endocrine disrupting chemicals that interfere with sexual development. Two core endpoints are measured as indicators of endocrine-associated developmental aberrations, the VTG concentrations and sex ratios (proportions of sex) determined via gonad histology. Gonadal histopathology (evaluation and staging of oocytes and spermatogenetic cells) is optional. Additionally, the genetic sex is determined whenever possible (e.g. in Japanese medaka and the three spined stickleback). The presence of a genetic sex marker is a considerable advantage as it increases the power of the sex ratio statistics and enables the detection of individual phenotypic sex reversal. Other apical endpoints that should be measured include hatching rate, survival, length and body weight. The test method might be adaptable to other species than those mentioned above provided that the other species undergo a validation equal to the one accomplished for Japanese medaka, the three-spined stickleback and zebrafish, that the control fish are sexually differentiated at the end of the test, that VTG levels are sufficiently high to detect significant chemical-related variations, and that sensitivity of the test system is established using endocrine active reference chemicals ((anti)-oestrogens, (anti)-androgens, aromatase inhibitors etc). In addition, any validation report(s) referring to FSDT data using other species should be reviewed by the OECD, and the validation outcome should be considered as satisfactory.
人源葡萄糖转运蛋白GLUT1的晶体结构(中文翻译)
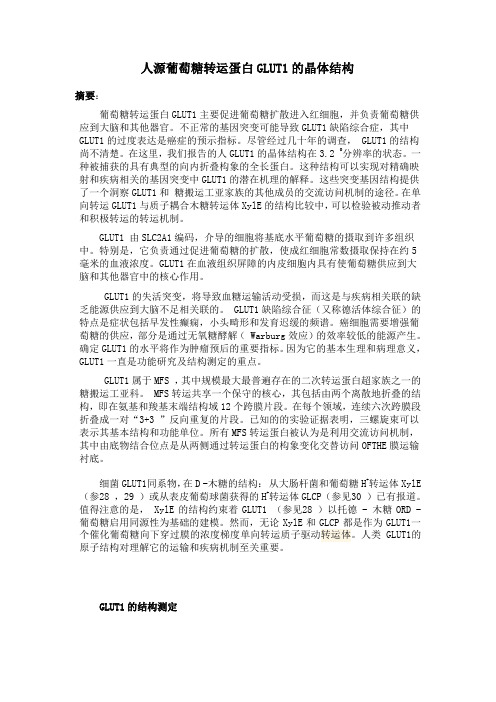
人源葡萄糖转运蛋白GLUT1的晶体结构摘要:葡萄糖转运蛋白GLUT1主要促进葡萄糖扩散进入红细胞,并负责葡萄糖供应到大脑和其他器官。
不正常的基因突变可能导致GLUT1缺陷综合症,其中GLUT1的过度表达是癌症的预示指标。
尽管经过几十年的调查, GLUT1的结构尚不清楚。
在这里,我们报告的人GLUT1的晶体结构在3.2 ˚分辨率的状态。
一种被捕获的具有典型的向内折叠构象的全长蛋白。
这种结构可以实现对精确映射和疾病相关的基因突变中GLUT1的潜在机理的解释。
这些突变基因结构提供了一个洞察GLUT1和糖搬运工亚家族的其他成员的交流访问机制的途径。
在单向转运GLUT1与质子耦合木糖转运体XylE的结构比较中,可以检验被动推动者和积极转运的转运机制。
GLUT1 由SLC2A1编码,介导的细胞将基底水平葡萄糖的摄取到许多组织中。
特别是,它负责通过促进葡萄糖的扩散,使成红细胞常数摄取保持在约5毫米的血液浓度。
GLUT1在血液组织屏障的内皮细胞内具有使葡萄糖供应到大脑和其他器官中的核心作用。
GLUT1的失活突变,将导致血糖运输活动受损,而这是与疾病相关联的缺乏能源供应到大脑不足相关联的。
GLUT1缺陷综合征(又称德活体综合征)的特点是症状包括早发性癫痫,小头畸形和发育迟缓的频谱。
癌细胞需要增强葡萄糖的供应,部分是通过无氧糖酵解( Warburg效应)的效率较低的能源产生。
确定GLUT1的水平将作为肿瘤预后的重要指标。
因为它的基本生理和病理意义,GLUT1一直是功能研究及结构测定的重点。
GLUT1属于MFS ,其中规模最大最普遍存在的二次转运蛋白超家族之一的糖搬运工亚科。
MFS转运共享一个保守的核心,其包括由两个离散地折叠的结构,即在氨基和羧基末端结构域12个跨膜片段。
在每个领域,连续六次跨膜段折叠成一对“3+3 ”反向重复的片段。
已知的的实验证据表明,三螺旋束可以表示其基本结构和功能单位。
所有MFS转运蛋白被认为是利用交流访问机制,其中由底物结合位点是从两侧通过转运蛋白的构象变化交替访问OFTHE膜运输衬底。
Q1A(R2)中英文对照(可编辑修改word版)
人用药品注册技术要求国际协调会ICH三方指导文件新原料药和制剂的稳定性试验Q1A(R2)现第四版2003年2月6日制定Q1A(R2) 文件历程现第四版新原料药和制剂的稳定性试验Q1A(R)修订说明本修订的目的为了明确由于采用了ICH Q1F“在气候带Ⅲ和Ⅳ注册申请的稳定性数据包”而使Q1A(R)而产生的变更。
这些变更如下:1.在下面章节中将中间储存条件从温度30℃±2℃/相对湿度60%±5%修改为温度30℃±2℃/相对湿度65%±5%:2.1.7.1 原料药-储存条件-一般情况2.2.7.1 制剂-储存条件-一般情况2.2.7.3 在半渗透性容器中包装的制剂3 术语-“中间试验”2.在下面章节中可以使用温度30℃±2℃/相对湿度65%±5%替代温度25℃±2℃/相对湿度60%±5%作为长期稳定性试验的条件:2.1.7.1 原料药-储存条件-一般情况2.2.7.1 制剂-储存条件-一般情况3. 在温度25℃±2℃/相对湿度40%±5%的基础上增加了温度30℃±2℃/相对湿度35%±5%作为长期稳定性试验条件,并且在后面的章节中包括了失水比率相关举例的相关情况:2.2.7.3 在半透性容器中包装的制剂在试验阶段中间将中间将储存条件从温度30℃±2℃/相对湿度60%±5%调整为温度30℃±2℃/相对湿度65%±5%是可以的,但相应的储存条件和调整的日期要在注册申报资料中清楚地说明和列出。
如果适用的话建议ICH三方在公布和执行此修订指南三年后,注册申请资料中完整的试验能够包含在中间储存条件,即温度30℃±2℃/相对湿度65%±5%下的实验资料。
S TABILITY T ESTING OF N EWD RUG S UBSTANCES ANDP RODUCTS1.INTRODUCTION1.1.Objectives of the GuidelineThe following guideline is a revised version of the ICH Q1A guideline and defines the stability data package for a new drug substance or drug product that is sufficient for a registration application within the three regions of the EC, Japan, and the United States. It does not seek necessarily to cover the testing for registration in or export to other areas of the world.The guideline seeks to exemplify the core stability data package for new drug substances and products, but leaves sufficient flexibility to encompass the variety of different practical situations that may be encountered due to specific scientific considerations and characteristics of the materials being evaluated. Alternative approaches can be used when there are scientifically justifiable reasons.1.2.Scope of the GuidelineThe guideline addresses the information to be submitted in registration applications for new molecular entities and associated drug products. This guideline does not currently seek to cover the information to be submitted for abbreviated or abridged applications, variations, clinical trial applications, etc.新原料药和制剂稳定性试验1.导言1.1.目的下述的指导原则是ICH Q1A 的修订版本,并且它为新原料药和制剂在欧洲、日本、美国三个地区注册所需要的稳定性资料做出规定要求。
注射用头孢唑肟钠的高分子聚合物检查方法的建立与验证

growth of endothelial cells [J].J Cancer Res Clin Oncol,
2005, 131(4):205- 13.
[12] Mialon A, Sankinen M, Soderstrom H, et al: DNA topoiso-
merase I is a cofactor for c- Jun in the regulation of epider-
[7] Cragg GM,Newman DJ.A tale of two tumor targets: Topoiso- merase I and tubulin. The Wall and Wani contribution to cancer chemotherapy[J]. J Nat Prod, 2004, 67(2):232- 44.
- 429-
的相对标准差应小于 5.0%。 1.4 对 照 溶 液 的 制 备 : 取 头 孢 唑 肟 钠 供 试 品 约 20mg, 精密称定, 置 100ml 量瓶中, 加水溶解并稀释 至刻度, 摇匀。 1.5 测 定 法 : 取 本 品 约 2.0g, 精 密 称 定 , 至 10ml 量 瓶中, 加水溶解并稀释至刻度, 摇 匀 , 立 即 取 200μl 注入色谱仪, 以流动相 A 为流动相进行测定, 记录 色谱图; 另取对照品溶液 200μl 注入色谱仪, 以流动 相B 为流动相进行测定, 记录色谱图, 按外标法计 算。 2 结果 2.1 色谱系统分析效果考察: 以流动相 A 为流动 相, 称取供试品适量, 以 0.20mg/ml 的蓝色葡聚糖溶 液溶解并稀释, 使 成 200mg/ml, 进 样 200μl, 采 用 聚 合物峰与高聚合物和相邻的头孢唑肟峰谷高度的比 值作为考察色谱系统对高聚物分析效果的指标 ( 见 图 1) 。
- 1、下载文档前请自行甄别文档内容的完整性,平台不提供额外的编辑、内容补充、找答案等附加服务。
- 2、"仅部分预览"的文档,不可在线预览部分如存在完整性等问题,可反馈申请退款(可完整预览的文档不适用该条件!)。
- 3、如文档侵犯您的权益,请联系客服反馈,我们会尽快为您处理(人工客服工作时间:9:00-18:30)。
Acta Chromatographica 22(2010)3, 375–390 DOI: 10.1556/AChrom.22.2010.3.30231–2522 © 2010 Akadémiai Kiadó, BudapestDevelopment and Validation of Gel-Chromatographic and Spectrophotometric Methods for Quantitative Analysis of Bioactive Copper Complexes in New Antihypocupremical FormulationsI. S AVIC *, G. N IKOLIC , I. S AVIC , AND M. C AKICDepartment of Pharmaceutics, Faculty of Technology, University of Nis,Bulevar Oslobodjenja 124, Leskovac 16000, SerbiaE-mail: ici86@info-net.rs or ici_teh@Summary. Gel-permeation chromatographic (GPC) and visible spectrophotometric methods have been developed and validated for quantitative analysis of complexes of copper(II) with the polysaccharides pullulan and dextran, active pharmaceutical com-pounds in new antihypocupremical formulations. Linearity, precision, accuracy, speci-ficity, and limits of detection (LOD) and quantification (LOQ) were determined in ac-cordance with ICH Q2(R1) guidelines. GPC was performed isocratically with redistilled water as mobile phase at a flow rate of 1 mL min −1. Visible spectrophotometry was per-formed in water, using 640 nm for direct assay of the copper(II) complex with pullulan and dextran. The calculated F and t values at the 95% confidence level were less than the theoretical values, showing there were no significant differences between the perform-ance of the methods.Key Words: antihypocupremical formulations, GPC, visible spectrophotometryIntroductionMicrocytic hypochromic anemia is one of the outcomes of copper defi-ciency. Many preparations are used for treatment. These are mixtures of mi-croelements in the form of their salts (CuSO 4 or CuCl 2), which are toxic and unstable [1, 2]. Copper complexes with amino acids can also be used for treatment, as has been well described in the literature [3]. The active phar-maceutical compound has a repetitive dose schedule (0.6–2 mg daily) and is absorbed from the lower part of the gastrointestinal tract.M etal complexes with polysaccharides and their derivatives are of growing importance in medicine and pharmacy. For example, Polypher is well known as a blood substitute [4]. New blood substitutes with hemo-I. Savic et al. 376stimulating and antianemic function, complexes of dextran and pullulan with Fe(II), Fe(III), Cu(II), and Co(II) ions, differ from the existing analogues in having good biocompatibility and hemocompatibility and more pro-nounced and prolonged action [5–8]. Magnetic complexes based on poly-saccharide derivatives with Fe, Ca, Zn, Co, Ni, and Cu oxides are used in roentgenology studies. These complexes must be very stable during pro-longed storage and must not be toxic [9, 10].Fig. 1. Structural models of the complexes of Cu(II) with dextran (a) and pullulan (b)Reduced low-molar pullulan (RLMP,Мw6000 g mol−1) and reduced low-molar dextran (RLMD, Мw 5000 g mol−1) have been chosen as new ma-terials for complexing and subsequent interaction with Cu(II) ions. In alka-line solutions (pH > 7), Cu(II) ions form complexes with these ligands [11, 12]. The bioactive complex of copper(II) with RLMP contains 13.1% copper and the complex of copper(II) with RLMD contains 19.8% copper. The com-plexes obtained are green, amorphous, almost odorless and freely soluble in water at 25°С [13].In the solid state the complexes are very stable during prolonged storage at room temperature and are not toxic [14, 15]. The struc-Quantitative Analysis of Bioactive Copper Complexes 377 tures of bioactive copper(II) complexes with the oligosaccharides dextran or pullulan (Fig. 1) were confirmed by physicochemical and spectroscopic characterization [16–19].Bioactive copper(II) complexes with RLMP and RLMD, as active phar-maceutical compounds, were prepared by making solid dosage forms (tab-lets) in the laboratory. These complexes are not yet official in any pharma-copoeia. The patent literature has data on the synthetic procedure only, with physicochemical and spectroscopic characterization [11, 20]. Results from determination of correlations between the structure and stability of complexes of copper(II) with RLMD by use of conductiometry have been well described in the literature [15, 21].F or routine analysis of the active drug content of pharmaceutical for-mulations we developed simple, specific, and direct GPC and visible spec-trophotometric methods with sufficient reliability. Both methods fulfilled European Pharmacopoeia analytical quality requirements [22] for content uniformity testing of finished pharmaceutical products when these are pre-sent as single active principles, and, hence, can be successfully used for rou-tine quality control of tablets.ExperimentalMaterialsThe bioactive copper(II) complex with dextran oligosaccharides was syn-thesized by the original procedure [12]. Synthesis of the complex of cop-per(II) with pullulan oligosaccharides has been described in detail by Niko-lic et al. [11]. Antihypocupremical tablets [F1, which contains 1.5 mg cop-per(II) complex with pullulan, and F2, which contains 1.5 mg copper(II) complex with dextran] were prepared by the original procedure [23].Qual-ity-control tests for measurement of friability, disintegration, hardness, weight variation, and assay were performed on all formulations in accor-dance with the European Pharmacopoeia [22].Extraction of the Active Ingredient from FormulationsThe tablets were accurately weighed and powdered. The amount of drug in the weighed quantity of powder was calculated on the basis of the label claim and the active ingredients in formulations F1 and F2 were then ex-tracted with water. The solutions were sonicated for 20 min and then fil-tered through Whatman no. 1 filter paper into 25-mL volumetric flasks.I. Savic et al. 378Appropriate dilutions were prepared and the solutions were subjected for both GPC and visible spectrophotometric analysis.Instrumentation and Analytical ConditionsThe validation runs were performed on two HPLC instruments. The first was an Agilent Technologies (Palo Alto, CA, USA) 1100 liquid chromato-graph with a Zorbax Eclipse XDB PSM-60 column (Eldex Laboratories, Napa, CA, USA) and Waters (Milford, MA, USA) 2414 refractive index (RI) detector. The second system was a Hitachi (San Jose, CA, USA) L-7100 high-pressure pump, Waters 717 plus autosampler, Eldex CH-150 column, and Waters 410 RI detector. Data acquisition and processing were performed us-ing AgilentChemStation automation system software. GPC analysis was performed by isocratic elution with water at a flow rate of 1 mL min−1. The water used as mobile phase was prepared freshly and filtered through a 0.45-μm membrane filter (Millipore, USA). Injection volume was 80 μL. Quantification was effected by measurement of absorption at 640 nm.V alidation runs were performed on two double-beam visible spectro-photometer: a Varian Cary-100 Conc and a Perkin–Elmer (Germany) Lambda 15. The aqueous solutions were measured in 1-cm quartz cells. The spectra were recorded using a 1-mm slit and 120 nm min−1 scanning speed. The assay was performed at the analytical wavelength 640 nm for formula-tions F1 and F2.A Mettler–Toledo AG245 electronic balance, an Electrolab Friabilator USP (XXIII), an Electrolab disintegration tester (USP), and an Erweka TBH20 (hardness tester) were also used for performing the quality-control tests on the antihypocupremical formulations.Preparation of Standard Solutions and Quality-ControlStandard SolutionsGPC MethodPrimary stock solutions of copper(II) complex with polysaccharides pullu-lan or dextran (1 mg mL−1) were prepared in ultra-pure water and further diluted with water to obtain calibration standards in the concentration range 18–180 μg mL−1. Quality-control (QC) standard solutions were run with each batch of calibration standards to calculate validation data. QC samples were prepared in ultra-pure water spiked with active substances atQuantitative Analysis of Bioactive Copper Complexes 379 120, 150, and 180 μg mL−1 by following the same procedure as for calibra-tion standards.Visible Spectrophotometric MethodAqueous primary stock solutions of 1 mg mL−1 copper(II) complexes with pullulan or dextran were prepared. All measurements were made at room temperature. Calibration solutions were prepared by appropriate dilution of the primary stock solution with ultra-pure water to obtain concentrations in the range 4–40 μg mL−1 and 6–180 μg mL−1 for the copper(II) complexes with pullulan and dextran, respectively. Quality-control standard solutions were prepared in the range of the calibration plot at different concentra-tions, in triplicate.Method ValidationLinearityBoth methods were validated for linearity, sensitivity, precision and accu-racy in accordance with International Conference on Harmonization Q2(R1) guidelines for validation of analytical procedures [24, 25]. Six-point calibra-tion plots were generated with appropriate concentrations of calibration standard solutions for both visible spectrophotometric and GPC methods. For the visible spectrophotometric method the range was optimized at 4–40 μg mL−1 for the copper(II) complex with pullulan and 6–180 μg mL−1 for the copper(II) complex with dextran. For the GPC methods the calibration range was 18–180 μg mL−1 for both formulations. Linearity was evaluated by use of the least-squares regression method using unweighted data.Precision and AccuracyBoth precision and accuracy were determined by analysis of QC standards (in addition to calibration standards) prepared in triplicate at different con-centrations covering the entire linear range. Precision is the repeatability of an analytical method under normal operational conditions. Inter-day, intra-day, and inter-instrument variation were studied to determine the interme-diate precision of the proposed analytical methods. QC standards at differ-ent concentrations were prepared in triplicates three different times in a day to study intra-day variation. The same procedure was followed for three different days to study inter-day variation. One set of QC standards at dif-I. Savic et al. 380ferent concentrations was reanalyzed using another HPLC system and visi-ble spectrophotometer, by proposed methods, to study inter-instrument variation. The relative standard deviation (RSD, %) of the predicted concen-trations from the regression equation was taken as precision. Accuracy is the amount (%) of active substance recovered by assay from a known added amount. Results from nine analyses at three concentrations covering the specified range was determined [26]. The repeatability of the method was determined by assaying six sample solutions of the highest test concentra-tion (180 μg mL−1) for the GPC method and 40 and 180 μg mL−1, respec-tively, for the copper(II) complexes with pullulan and dextran for the visible spectrophotometric method.SpecificityThe specificity of method was assessed by comparing chromatograms (GPC) and scans (visible spectrophotometry) obtained from the drug and from a blank solution of the excipients in water without the drug. The ex-cipients chosen were those commonly used in tablet formulations, and in-cluded lactose, starch, silica, PVP-K30, and magnesium stearate. The drug to excipient ratio used was similar to that in formulations F1 and F2.LOD and LOQThe limits of detection (LOD) and quantification (LOQ) were evaluated by use of the equations LOD =3.3S0/b and LOQ =10S0/b, were S0 and b are the standard deviation and slope of the calibration plot [27–30].Robustness of the GPC MethodRobustness should show the reliability of an analysis in respect of deliber-ate variation of the method conditions. To determine method robustness, experimental conditions were deliberately altered. The flow rate of the mo-bile phase was 1 mL min−1. To study the effect of flow rate on the resolu-tion, it was changed by ±0.5 units to 0.5 and to 1.5 mL min−1 while the mo-bile-phase components were held constant in accordance with the method. The effect of column temperature on resolution was studied at 20 and 30°C instead of 25°C.Quantitative Analysis of Bioactive Copper Complexes 381 Robustness of Visible Spectrophotometric MethodFor evaluation of method robustness, the wavelength was changed by ±10 units from 630 to 650 nm, and the solvents (water and acetonitrile) and temperature were altered.Results and DiscussionGPC MethodA GPC method was developed which can be conveniently used for routine quality control analysis of the two active substances in pharmaceutical for-mulations. The chromatographic conditions were optimized to provide good assay performance. The mobile phase for each formulation was se-lected on the basis of its solubility. The copper(II) complexes with polysac-charides were quite soluble in water and acetonitrile. During optimization of the method three different columns were used: Zorbax PSM-60 (M w 500–10000 g mol−1), Zorbax PSM-300 (M w 3000–300 000 g mol−1) and Zorbax PSM Bimodal-S (M w 500–1 × 10⁶ g mol−1) with acetonitrile–water combina-tions in different ratios as mobile phases. Chromatographic separation was achieved on the Zorbax PSM-60 column. Satisfactory separation of the stan-dards used was achieved with ultra-pure water as mobile phase. If acetoni-trile was used instead of water, resolution of the copper(II) complex was unsatisfactory. Maximum absorption of the copper(II) complexes was at 640 nm and this wavelength was chosen for the analysis. The retention times of the copper(II) complexes with pullulan and dextran were 5.820 and 5.619 min, respectively. The total run time was short for both drugs. The chromatograms are shown in Figs 2 and 3.T he chromatographic data column efficiency and peak asymmetry were measured for the active substances. The number of theoretical plates, N, was 161662 for Cu(II)–RLMP and 133130 for Cu(II)–RLMD, which indi-cates that column efficiency is satisfactory [HETP = 0.001 for Cu(II)–RLMP and 0.002 for Cu(II)–RLMD]. The peak asymmetry values of 0.67 for Cu(II)–RLMP and 0.69 for Cu(II)–RLMD indicate the peaks are not ideally symmet-ric, i.e. are not Gaussian.I. Savic et al. 382Fig. 2. Typical chromatograms showing elution of (a) the copper(II) complex with pullulan and (b) the copper(II) complex with dextran, at concentrations of 20 μg mL−1,with their respective retention timesT he methods were specific, because none of the excipients interfered with the active substances of interest. Hence, the methods were suitable for assay of the antihypocupremical formulations. Six-point calibration plots were constructed after analysis of calibration standards and found to be lin-ear (r≥ 0.997) for both active substances over their calibration ranges (Table I). The precision of the fit was further confirmed by the SE, at 95% confidence limits, of the intercepts and slopes. A one-way analysis of vari-ance (ANOVA) test [31, 32] was performed on the basis of the values ob-served for each pure drug during replicate analysis of standard solutions.Quantitative Analysis of Bioactive Copper Complexes 383 Calculated F-values (F calc) were found to be less than the critical F-value (F crit) at 5% significance levels (Table II). The GPC method was accurate, pre-cise, reproducible, and very sensitive. All the validation data for the two drugs were within specified limits (Table I). Accuracy and precision were determined by construction of calibration plots, two on the same day (intra-day) and a third on a different day (inter-day) and by use of different in-struments. Intra-day and inter-day precision (as RSD) at different concen-trations were <2%, indicative of the high precision of the GPC method. The calculated LOQ and LOD concentrations confirmed that the method was sufficiently sensitive. Hence, the method was suitable for assay of the anti-hypocupremical formulations.Fig. 3. Typical chromatograms showing elution of formulations F1 (a) and F2 (b), at concentrations of 20 μg mL−1, with their respective retention timesI. Savic et al.384Table I. Validation data for the GPC method of analysis of the complexes of copper(II)with pullulan and dextranValidationCu(II)–RLMP Cu(II)–RLMD dataRange18–180 18–180 (μg mL−1)Regressiony = 2.01184x + 3430.556 y = 4.62023x + 3217.09equationSE of slope 5.001 × 10⁻³ 4.530 × 10⁻³SE of inter-6.246 × 10⁻³ 5.340 × 10⁻⁴ceptCorrelation0.9976 0.9982 coefficient(r)Limit ofquantifica-1.46 1.59 tion(μg mL−1)Limit ofdetection0.48 0.53 (μg mL−1)Drug concentration (μg mL−1)Precision120 150 180 120 150 180150.94120.07179.26148.75Mean 119.12181.02RSD (%) 0.82 ± 0.49 1.32 ± 0.81 0.92 ± 0.620.75 ± 0.080.8 ± 0.19 1.5 ± 0.13Recovery99.26 99.16 100.56 100.58 100.62 99.58(%)Two calibration graphs were generated on the same day and on three consecutivedays (n = 3). The six standard concentrations were evenly distributed in the linear range.Precision and accuracy were determined by analysis of quality-control samples at three concentrations. Results show the precision of the method at three concentrations withinthe calibration range. The slopes are presented as mean ± SD with RSD (%) given in pa-renthesesW hen the chromatographic conditions flow rate and column tempera-ture were deliberately varied, no significant change in the assay value wasobserved. System suitability data, for example tailing and the RSD values,are well within accepted limits. Tailing was 1.0 and 0.9 and RSD was 0.8and 0.6% for flow rate and column temperature variations, which confirmsthe robustness of the method.Table II . Results from one-way ANOVA test of the linearity of assay of Cu(II) complexsolutions by the proposed methods F -value Source of varia-tion Degree of freedom(d.f.)Sum of squares (SS) Mean sum of squares (MS) F calc F critGPC method Between group 46.7750 × 10⁻³ 1.6940 × 10⁻³ Within group 20 6.4223 3.2112 × 10⁻¹Total 24 6.42910.0053 2.8661a Visible spectrophotometric methodBetween group4 8.4321 × 10⁵ 2.1080 × 10⁵ Within group30 6.3665 × 10¹⁰ 2.1222 × 10⁹ Total 34 6.3666 × 10¹⁰ 0.9999 2.6896ba Theoretical value of F (4, 20) based on one-way ANOVA test at the P = 0.05 level of significanceb Theoretical value of F (4, 30) based on one-way ANOVA test at the P = 0.05 level of significanceVisible Spectrophotometric MethodThe development of a simple, rapid, sensitive, and accurate analytical method for routine quantitative analysis of samples will reduce unneces-sary tedious sample preparation and the cost of materials and labor. Cop-per(II) complexes with the polysaccharides pullulan and dextran are visible light-absorbing molecules that absorb at a specific wavelength and this fact has been successfully used for their quantitative analysis by a visible spec-trophotometric method. The λmax of the copper(II) complexes in aqueous media was found to be 640 nm. The visible spectra of the active substances and their formulations are shown in Figs 4 and 5.T he correlation coefficients were highly significant (Table III ). Like the GPC method, a one-way ANOVA test [31, 32] was also performed for the visible spectrophotometric method based on the values observed during replicate measurement of standard solutions of the pure drug. F calc was found to be less than F crit at the 5% significance level for this method also (Table II ).Fig. 4. Visible absorption spectra of aqueous solutions of (а) complex Cu(II)–RLMP and(b) formulations F1All the method-validation data are well within the limits as specified inthe ICH Q2(R1) guidelines, as shown in Table III.(b) formulations F2Table III. Validation data for the visible spectrophotometric method of analysis ofcopper(II) complexes with pullulan or dextranValidation data Cu(II)–RLMP Cu(II)–RLMDRange (μg mL−1) 4–40 6–180Regressiony = 0.0020 x + 0.03185 y = 0.0001 x + 0.04117equationSE of slope 3.891×10⁻² 6.224×10⁻²SE of intercept 2.546×10⁻⁴ 4.331×10⁻³Correlation0.9996 0.9989 coefficient (r)Limit ofquantification0.65 0.79 (μg mL−1)Limit of detection0.21 0.28 (μg mL−1)Drug concentration (μg mL−1)Precision12 15 18 120 150 180Mean 11.81 14.88 17.67 120.48 146.72 182.07RSD (%) 1.7±0.130.66±0.080.82±0.22 1.2±0.080.98±0.03 1.1±0.71Percent recovery 98.40 99.23 98.2 100.40 97.81 101.15 Two calibration graphs were generated on three consequent days (n = 3) with aminimum of six concentrations evenly distributed throughout the entire range. The accuracy, represented by percent recovery, and precision were determined using QC solutions. Precision (RSD, %) is calculated as mean ± SD with n=3 for each con-centrationF or evaluation of method robustness, the wavelength range and the temperature of analysis were changed. These changes had no effect on the absorbance of the complexes. RSD was 0.45 and 0.70% for variation of wavelength range and temperature, respectively. These changes thereforehad no significant effects on assay results, suggesting the method wasrobust.Applicability of the MethodsThe methods were used for analysis of copper(II) complexes in antihypocu-premical formulations. The results obtained by use of the methods were compared statistically using a point hypothesis test [33, 34]. For both drugsrecovery from the formulations was 93.16–101.87% when assayed by use ofthe GPC method and 99.61–100.32% when assayed by use of the visible spectrophotometric method (Table IV). Table IV shows that calculated F and t values at the 95% confidence level were less than the theoretical values, confirming no significant differences between the performance of the GPC and the visible spectrophotometric methods. The visible spectrophotometric method is, therefore, a cost-effective and time-saving alternative to the GPC method.Table IV. Analysis of the complexes by the GPC and visible spectrophotometric methodsRecovery (mean ± RSD; n = 3)Formulation Component Visiblespectrophotometricmethod GPC methodtvalue aFvalue aF1 Cu(II)–RLMP100.32 ± 1.71 93.16 ± 0.42 1.03F2Cu(II)–RLMD99.61 ± 1.45 101.87 ± 1.53 0.922.06a Theoretical F (ν1 = 4, ν2 = 4) and t (ν = 8) values at the 95% confidence level are 6.39and 2.306, respectivelyRSD, relative standard deviationQ uality-control tests were performed on formulations F1 and F2; the results are listed in Table V. Friability, disintegration, and hardness of the formulations were within the prescribed limits.Table V. Results from quality-control testing of formulations F1 and F2 in accordancewith the United States PharmacopeiaFormulation F1a F2aFriability 0.002 ± 3.6·10-40.0031 ± 1.2·10-4 Hardness (kPa) 70 ± 0.029 60 ± 0.018Weight variation (%) −0.95 to 2.1 (± 0.048) −1.37 to 2.26 (± 0.052)Disintegration Within 15 min (3.2-4.3 min)(± 0.10) Within 15 min (2.4-4.05)(± 0.08)a Uncoated tablet. Mean ± SD (n = 3 for checking hardness and disintegration; n = 10 for friability testing; and n = 20 for weight variation)ConclusionsThe purpose of this work was to validate the two analytical methods for quantitative analysis of copper(II) complexes with the polysaccharides pul-lulan and dextran in pharmaceuticals. The methods proved to be simple, precise, and accurate. There were no differences in accuracy and precision between them, so both were applicable to routine pharmaceutical quality control of antihypocupremical formulations.AcknowledgmentsThis work was supported by the Ministry of Science and Technological De-velopment of the Republic of Serbia, project TR-19035. The authors are grateful for the financial support provided by this Ministry.References[1] O. Gaiduk, R. Pantaler, N. Grebenyuk, V. Ostrovskaya, J. Anal. Chem., 64, 216–220(2009)[2] Y. Lind, A. Wicklund Glynn, BioMetals, 12, 181–187 (1999)[3] M. Heidarpour Bami, M. Mohri, H. Seifi, A. Alavi Tabatabaee, Vet. Res. Commun.,32, 553–561 (2008)[4] O. Sibikina, E. Novikova, A. Iozep, L. Iozep, Rus. J. Appl. Chem., 80, 342–344 (2007)[5] M. Hasegawa, H. Nagae, Y. Ito, A. Mizutani, K. Hirose, M. Ohgai, Y. Yamashita,N. Tozawa, K. Yamada, K. Kito, S. Hokukoku, US Patent, 5, 424–419, (1995)[6] G. Nikolić, M. Cakić, Lj. Ilić, S. Ristić, Ž. Cakić, Pharmazie, 57, 155–158 (2002)[7] Lj. Ilić, S. Ristić. M. Cakić. G. Nikolić, S. Stanković, Patent WO 02/46241, (2002)[8] K. Burger, L. Nagy, Biocoordination Chemistry: Metal Complexes of Carbohy-drates and Sugar–type Ligands, Ellis Horwood, New Jersey, 1990, pp. 236[9] G. Nikolić, M. Cakić, Colloid J., 69, 464–473 (2007)[10] R.P. Bandwar, C.P. Rao, M. Giralt, J. Hidalgo, G.U.Kulkarni, J. Inorg. Biochem., 66,37–44 (1997)[11] G.S. Nikolić, M. Cakić, Ž. Mitić, Lj. Ilić, Complex compounds of copper(II)-ionswith pullulan and its reduced and oxidized derivatives. Synthesis process, phys-icochemical characterization, spectra-structure correlation and pharmacological in-vestigation of potential pharmaceutical preparation based on the complex, Serbian Patent P-0223, (2008)[12] Ž. Mitić, G.S. Nikolić, M. Cakić, R. Nikolić, Lj. Ilić, Russ. J. Phys. Chem., 81, 1433–1437 (2007)[13] Ž. Mitić, G.S. Nikolić, M. Cakić, SPEC-2008 V International Conference of Spectro-scopy, Shedding light on disease: Optical diagnosis for the New Millennium, 25–29 October 2008, Sao Paulo, Brazil (Conference Proceedings) 2008, pp. 86[14] Lj. Ilić, Ž. Mitić, G. Nikolić, M. Cakić, XVII Ulusal Kimya Kongresi, 8–11 Sep. Istan-bul (Bildiri ozetleri Kimya), 2003, pp. 190[15] Ž. Mitić, M. Cakić, R. Nikolić, Lj. Ilić, G. Nikolić, J. World Polym. (Serb.), 7, 225–229(2004)[16] M. Cakić, Ž. Mitić, G.S. Nikolić, Lj. Ilić, G.M. Nikolić, Spectroscopy, 22, 177–185(2008)[17] G.S. Nikolić, M. Cakić, Ž. Mitić, Lj. Ilić, Russ. J. Coord. Chem., 34, 322–328 (2008)[18] Ž. Mitić, G.S. Nikolić, M. Cakić, P. Premović, Lj. Ilić, J. Mol. Struct., 924–926, 264–273 (2009)[19] Ž. Mitić, G. Nikolić, M. Cakić, R. Nikolić, Lj. Ilić, 12th European Conference on theSpectroscopy of Biological Molecules, From molecules to tissues, 1–6 September 2007, Bobigny-Paris region, France (Book of Abstracts), 2007, pp. 319[20] W.F. Leech, D.G. McLaren, K.D. McSporran, Administration of copper to an ani-mal, US Patent 0029942, 2009[21] Ž. Mitić, G.S. Nikolić, FIP-2008 World Congress of Pharmacy and PharmaceuticalSciences, 68th International Congress of FIP, Reengineering Pharmacy Practice in a Changing World, 29 August – 04 September 2008, Basel, Switzerland (Book of Ab-stracts), 2008, pp. 186[22] European Pharmacopoeia, Directorate for the Quality of Medicines of the Councilof Europe, Strasbourg, France, fourth edn., 2004[23] I. Savic, G. Nikolic, I. Savic, B. Stojanovic, M. Cakic, 1st International Congress…Engineering, materials and management in the processing industry”, 14–16 Octo-ber 2009, Jahorina, Republika Srpska (Proceedings CD), 2009, pp. 313–316[24] The European Medicines Agency Pre-Authorisation Evaluation of Medicines for Hu-man Use. ICH Q2(R1): Validation of Analytical Procedures: Text and Methodology, EMEA/410412/2007, London, 2009[25] M. Swartz, I. Krull, Pharm. Technol., 22, 104–119 (1998)[26] M. Varma, N. Kapoor, M. Sarkar, R. Panchagnula, J. Chromatogr. B, 813, 347–352(2004)[27] J. Ermer, J. Pharm. Biomed. Anal., 24, 755–767 (2001)[28] D. Perez-Bendito, M. Silva, Kinetic Methods in Analytical Chemistry, Ellis Hor-wood, Chichester, 1988, p. 254[29] H.A. Mottola, Kinetic Aspects of Analytical Chemistry, Wiley, New York, 1988,p. 40[30] V. Thomsen, D. Schatzlein, D. Mercuro, Spectroscopy, 18, 112–114 (2003)[31] R. Duncan, R.G. Knapp, M.C. Miller, Introductory Biostatistics for the Health Sci-ences, 2nd edn., Delmer Publishers, 1983, pp. 115–150[32] S. Bolton, Pharmaceutical Statistics: Practical and Clinical Application, 3rd edn.,Marcel Dekker, New York, 1997, pp. 153, 216–269[33] C. Hartmann, J. Smeyers-Verbeke, W. Penninckx, Y. Heyden, P. Vankeerberghen,D. Massart, Anal. Chem.,67, 4491–4499 (1995)[34] D. Skoog, D. West, F. Holler, Fundamentals of Analytical Chemistry, Saunders Col-lege Publishing, Philadelphia, 1996, p. 51Accepted by DA。