CD73-IN-1-HNMR-28411-MedChemExpress
SAS-1
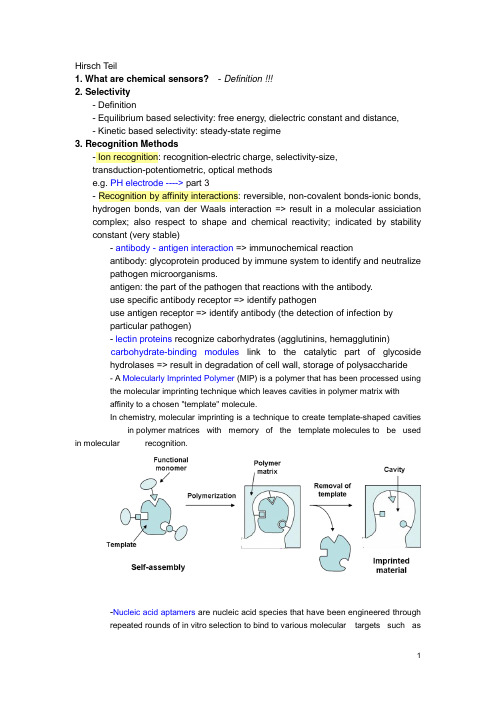
Hirsch Teil1. What are chemical sensors?- Definition !!!2. Selectivity- Definition- Equilibrium based selectivity: free energy, dielectric constant and distance,- Kinetic based selectivity: steady-state regime3. Recognition Methods- Ion recognition: recognition-electric charge, selectivity-size,transduction-potentiometric, optical methodse.g. PH electrode ----> part 3- Recognition by affinity interactions: reversible, non-covalent bonds-ionic bonds, hydrogen bonds, van der Waals interaction => result in a molecular assiciation complex; also respect to shape and chemical reactivity; indicated by stability constant (very stable)- antibody - antigen interaction => immunochemical reactionantibody: glycoprotein produced by immune system to identify and neutralizepathogen microorganisms.antigen: the part of the pathogen that reactions with the antibody.use specific antibody receptor => identify pathogenuse antigen receptor => identify antibody (the detection of infection byparticular pathogen)- lectin proteins recognize caborhydrates (agglutinins, hemagglutinin)carbohydrate-binding modules link to the catalytic part of glycosidehydrolases => result in degradation of cell wall, storage of polysaccharide- A Molecularly Imprinted Polymer (MIP) is a polymer that has been processed usingthe molecular imprinting technique which leaves cavities in polymer matrix withaffinity to a chosen "template" molecule.In chemistry, molecular imprinting is a technique to create template-shaped cavities in polymer matrices with memory of the template molecules to be used in molecular recognition.-Nucleic acid aptamers are nucleic acid species that have been engineered throughrepeated rounds of in vitro selection to bind to various molecular targets such assmall molecules, proteins, nucleic acids, and even cells, tissues and organisms.Aptamers are useful in biotechnological and therapeutic a pplications as they offer molecular recognition properties that rival that of the commonly used bimolecular antibodies.- Recognition by nucleic acids: hydrogen bonds between two distinct pairs of nucleobases => two complementary nucleic acids form a double strand association complex => called hybridizationnucleic acid sensors: short single strand NA as receptor to recognize a particular NA sequence in the analyte NA => detection of genetic anomalies and pathogen mircoorganism- Recognition by enzyme: dynamic processEnzyme: protein compound that function as catalysts in chemical reaction occurring in living system.- Recognition by cells and tissues: advantages of enzyme incorporated in biological materials => in their natural environmentsee part 3, Wegener - Recognition by gases and vapors: based on sorption at solid material => surface-adsorption, inner-absorption; purely physical phenomenon or chemical reaction.4. Transduction MetohdosChemical transduction: monitoring the change of chemical composition of the sensing element in response to the recognition process. => change in concentration/amount is measured => detect primary product -> secondary product or coreagent -> labeling productLABEL can be a simple molecular species or nanoparticals that can be detected by available physiochemical methods => enzyme, fluorescent dyes, luminescent dyes, electroactive compoundsPhysical transduction: a specific physical property of the sensing element that is affected by its interaction with the analyte is monitored. => mass, reflective index, dielectric properties, electrical resistivity => LABEL-FREE- Thermometric transductionRecognition of the analyte leads to change in temperature => only catalytical processes generate sufficient heat to the measurement => application: combustible gases react with O2 at the surface of a catalyst.- Transduction based on mechanical effectsRecognition leads to change in mass of the sensing element => monitored by mass tranducer based on quartz crystal microbalance (QCM)----------------------------------------------------------------------------------------------------------------- QCM, correct name: Thickness shear modePiezoelectric effect:generation of electrical charges on the surface of a solid by strain, pressure or torsion (mechanical deformation of solid) =>electricity resulting from pressureI nverse piezoelectric effect:application of charges to surfaces of piezoelectricsolid generates mechanical deformation (elongation, contraction, torsion)QCM is based on Inverse piezoelectric effect!# AT cut => 35`15`=> minimum temperature coefficient at 50~70 CIt makes the AT-cut well suited to applications requiring high degree of frequency stability over wide temperature ranges.## Electrodes are applied on both sides, and AC voltage applied.DC cannot flow across the crystal because it consists of an insulator material;however the crystal somewhat behaves as capacitor and allow an AC current to f low along the left-hand loop.AC voltage applied => leads to shear oscillation of crystal => when the voltage frequency matches the intrinsic vibration frequency of the crystal => the vibration amplitude is at maximal => the resonant => resonant frequency (f0) => depend on crystal thickness (e.g. d q= 330 um, f0= 5MHZ), density and elasticity of piezoelectric material### AT-cut resonator: thickness: ~0.2 mm, diameter of the active area: 5~20 mm #### Deposition of a homogenous mass film (a rigid overlay)Sauerbrey equation:Cf indicate sensitivity of QCMcondition of this equation: rigid deposited mass; △m<2% of crystal mass;operated in vacuum or in gaseous atmopphereIn liquid: the liquid breaks the vibration by friction => lessen f0Thickness of the layer must be greater than the wave decay lengththat is of 250 nm of 5 MHz resonator at water. ----> part 2!!!##### QCM in practice => see p.41----------------------------------------------------------------------------------------------------------------- - Resistive and capacitive transductionRecognition leads to changes in the electrical property of this materialResistive transduction: gases interact with MOS => change in electrical resistivity Capactive transduction => dielectric constant- Electrochemical transductionsee part 2, Matysik - Optical transductionOptical transduction can be based on light emission or light absorption, also by physical quantity (reflective index) and light scattering.5. Sensor Configuration and Fabrication- Lateral flow assayA typical test strip consists of the following components:1. Sample pad – an absorbent pad onto which the test sample is applied2. Conjugate pad –this contains antibodies specific to the target analyte;conjugated to coloured particles (e.g. gold nanoparticles)3. Reaction membrane –typically a hydrophobic nitrocellulose or celluloseacetate membrane onto which anti-target analyte antibodies are immobilized in a line across the membrane as a capture zone or test line, and a control zonecontaining antibodies specific for the conjugate antibodies.4. Wicking pad –a further absorbent pad designed to draw the sample acrossthe reaction membrane by capillary action and collect it.Double antibody sandwich assays: the sample migrates from the sample pad through the conjugate pad where any target analyte present will bind to the c onjugate.=> The sample then continues to migrate across the membrane until it reaches the test line where the target or conjugate complex will bind to the immobilized antibodies producing a visible line on the membrane. => The sample then migrates further along the strip until it reaches the control line, where excess conjugate will bind and producea second visible line on the membrane.This control line indicates that the sample has migrated across the membrane as intended. Two clear lines on the membrane is a positive result. A single line in the control zone is a negative result. Double antibody sandwich assays are most suitable for larger analytes, such as bacterial pathogens and viruses, with multiple antigenic sites. 6. Methods and Material in Sensor Preparation- Immobilization at solid surface => integration of a transducer with the receptor Physical adsorption at a solid supportNon covalent immobilization at solid surface => hydrophobic interaction, hydrogen bonding, electrostatic attraction; monolayer; no restrict access; not stable; Langmuir isotherm -> equilibrium interactionSupport material: silica, cellulose acetate, PVCCovalent bonding to the solid supportCovalent conjugation => stable, covalent bond, time consuming, expensiveCommon reactive group: -OH, -NH2, -C=O, -SH- Carboxylic acid with DCC- Glutaraldehyde reacts with the a.a. of lysine in protein => widely used Support: porous material => high specific area, high density of immobilized compounds => hydrogel: immobilized by entrapment/covalent corsslink - Natural polymers: Cellulose, Dextran- Synthetic polymers: Polystyrene- Active polymers: Epoxide (without preliminary activation) -->DNA array !!!- Inactive Polymers: Vicinal hydroxyls actived by CNBr- Inorganic support: Silica, AL2O3, TiO2 => stable at extreme PH- Metal support: noble metals, thiols on golds --> self assembled monolayers!Affinity reaction: avidin-biotin !!!Thin molecular layers: one or several molecular layers in solid support - Self-assembly of amphiphilic compounds: preparation of liposome andmicelles; liposome can be used of entrapment of molecular- Bilipid layer membranes: Langmuir-Blodgett technique- Layer by Layer assembly- Sol-Gel chemistry methods: silica gel => -O-Si-O-- Hydrogels: Xerogel, aerogel- Conducting polymers: Polyacetylene, polyaniline --> gas senor based on CP (----> part 3 !!!); also as entrapment matrix for biological receptors- Mesoporous materials: porous materials with pore (diameter: 2-50 nm,close to protein) => enzyme immobilization by entrapment (crosslinking withglutaraldehyde)- Deposition of polymers onto solid surfaces: dip coating, drop coating, spin coating ----> part 2 !!!Perm-selective memberanes: Nafin ----> Clark oxygen electrode Support-free crosslinkingEntrapment in a polymer networkEncapsulation7. Microfabrication Methodes- Spot Arraying: Contact-based & Noncontact-based; DNA microarray !!!!!Pros & Cons- Thick-film Technology: screen-printing technique (5-50 um thick layer)- Thin-film Technology: Photolithography (2 um)- Softlithography ----> experiment !!!!- Microcontact printing ----> experiment !!!!8. Optical Sensors- Electromagnetic RadiationOptical sensor => interaction of electromagnetic radiation with sensor layer - frequency; wavelength; photon energy (definition)- Structure: integration with wavelength-selection (optical filters) device and light sources (lasers), light detectors (phototransistors)- Optical Waveguides- Optical FibersOptical fibers' structuretotal internal reflection => evanescent wave- Spectrochemical Transduction MethodsSpectrochemical method analysis => light absorption or emission by sample => optical label performs absorption or emission (organic dye or metal complexes) - Light absorption: absorbance => concentration; sensitivity => thickness, absorpyivity, absorptivity => wavelength- Diffuse reflectance spectrometry: refelctance => concentration; suitable forsolid in near IR- Luminescence: Fluorescence spectromerty => fluorophore (label, organic dye or metal complexes, luminescent nanparticle ); steady-statefluorescence measurement, Time-resolved fluormetry; fluorescencequenching; resonance energy transfer (FRET); chemical- andbioluminescence => luminol; electrochemicaluminescence; Ramanspetrometry- Surface Plasmon Resonance Spectroscopy (SPR)。
华蟾毒素(CBG)酶联免疫吸附检测试剂盒 (ELK8271) 说明书

华蟾毒素(CBG)酶联免疫吸附检测试剂盒货号:ELK8271规格:96T(本试剂盒仅供体外研究使用,不用于临床诊断)灵敏度:91.3ng/mL检测范围:312.5-20000ng/mL特异性:可检测重组或天然的CBG,且不与其它相关蛋白交叉反应。
试剂盒组成中文名称英文名称规格保存条件48T96T酶标板(可拆)Pre-coated Microplate 6条x8孔12条x8孔4°C/-20°C(6个月)冻干标准品Standard(lyophilized)124°C/-20°C(6个月)标准品&样品稀释液Standard/Sample Diluent Buffer10mL20mL4°C生物素结合物(100×)Biotinylated-Conjugate(100x)30μL60μL4°C/-20°C(6个月)生物素结合物稀释液Biotinylated Conjugate Diluent5mL10mL4°C浓缩HRP酶结合物(100×)Streptavidin-HRP(100×)60μL120μL4°C/-20°C(6个月)酶结合物稀释液HRP Diluent6mL12mL4°C浓缩洗涤液(25×)Wash Buffer(25×)10mL20mL4°C显色底物溶液(TMB)TMB Substrate Solution6mL10mL4°C(避光)反应终止液Stop reagent3mL6mL4°C封板覆膜Plate Covers12常温产品说明书Instruction manual1份1份常温特别说明1.打开包装后请及时检查所有物品是否齐全完整。
所有试剂的批号见标签。
2.试剂盒保存:-20°C(长时间存放,试剂按照标签提示温度保存);2-8°C(一周内使用);避免反复冻融,过期后请勿使用。
依达拉奉右莰醇通过抑制TLR4NF-κB信号通路减轻实验性自身免疫性脑脊髓炎小鼠炎症反应

实验研究依达拉奉右莰醇通过抑制TLR4/NF-κB信号通路减轻实验性自身免疫性脑脊髓炎小鼠炎症反应晚丽,李作孝△摘要:目的探讨依达拉奉右莰醇对实验性自身免疫性脑脊髓炎(EAE)小鼠炎症反应的影响及其机制。
方法30只雌性C57BL/6小鼠随机分为空白组、模型组、依达拉奉右莰醇干预组各10只。
除空白组外,其余2组小鼠均采用髓鞘少突胶质细胞糖蛋白35-55(MOG35-55)多肽诱导EAE模型。
从造模次日开始,依达拉奉右莰醇干预组腹腔注射依达拉奉右莰醇12.5mg/kg,空白组及模型组腹腔注射等量生理盐水,1次/d,连续14d。
观察小鼠发病情况,并行神经功能障碍评分;HE和LFB染色观察脊髓组织病理改变;实时荧光定量PCR检测脑组织匀浆中白细胞介素(IL)-1β、IL-6及肿瘤坏死因子(TNF)-αmRNA表达水平;蛋白免疫印迹法检测脊髓组织中Toll样受体4(TLR4)、核因子κB p65(NF-κB p65)蛋白表达水平。
结果空白组小鼠均未发病,其余2组小鼠不同程度发病。
与模型组相比,依达拉奉右莰醇干预组小鼠的发病潜伏期、高峰期延迟,高峰期神经功能障碍评分降低(P<0.01)。
空白组小鼠脊髓组织未见异常;模型组脊髓组织大量炎性细胞浸润、髓鞘结构紊乱;依达拉奉右莰醇干预组较模型组的炎性细胞浸润减少、髓鞘结构紊乱情况改善。
与空白组相比,其余2组小鼠脑组织匀浆中IL-1β、IL-6、TNF-αmRNA表达水平以及脊髓组织中TLR4、NF-κB p65蛋白表达水平显著升高,以依达拉奉右莰醇干预可逆转建模引起的上述改变(P<0.05)。
结论依达拉奉右莰醇可减轻EAE小鼠炎症反应,其机制可能与抑制TLR4/NF-κB信号通路活化有关。
关键词:脑脊髓炎,自身免疫性,实验性;Toll样受体4;NF-κB;炎症;白细胞介素类;肿瘤坏死因子α;依达拉奉右莰醇;TLR4/NF-κB信号通路中图分类号:R744.51文献标志码:A DOI:10.11958/20212362Edaravone dexborneol reduces inflammation in mice with experimental autoimmuneencephalomyelitis by inhibiting TLR4/NF-κB signaling pathwayWAN Li,LI Zuoxiao△Department of Neurology,the Affiliated Hospital of Southwest Medical University,Luzhou646000,China△Corresponding Author E-mail:****************Abstract:Objective To investigate the effect and mechanism of edaravone dexborneol on the inflammatory response in mice with experimental autoimmune encephalomyelitis(EAE).Methods Thirty female C57BL/6mice were randomly divided into the blank group,the model group and the edaravone dexborneol intervention group,with10mice in each group. Except for the blank group,EAE model was induced by myelin oligodendrocyte glycoprotein35-55(MOG35-55) polypeptide in the other two groups.From the day after modeling,mice in the edaravone dexborneol intervention group were intraperitoneally injected with edaravone dexborneol12.5mg/kg,while the mice in the blank group and the model group were intraperitoneally injected with the equal amount normal saline,once a day for consecutive14days.The behavioral changes of mice were observed,and neurological dysfunction scores were performed.HE and LFB staining were used to detect spinal cord pathological changes.The mRNA expression levels of interleukin(IL)-1β,IL-6and tumor necrosis factor-α(TNF-α)in brain homogenate were detected by real-time fluorescence quantitative PCR.The protein expression levels of Toll-like receptor4(TLR4)and nuclear factorκB p65(NF-κB p65)in spinal cord tissue were detected by Western blot assay.Results None of the mice in the blank group had the disease,and the other two groups of mice had different degrees of pared with the model group,the incubation period and peak period were delayed in the edaravone dexborneol intervention group,and neurological deficit scores in peak period decreased(P<0.01).No abnormality was found in spinal cord tissue structure in mice of the blank group,and a large number of inflammatory cell infiltration,myelin structure 基金项目:泸州市人民政府-西南医科大学科技战略合作基金项目(2018LZXNYD-ZK17)作者单位:西南医科大学附属医院神经内科(邮编646000)作者简介:晚丽(1994),女,硕士在读,主要从事神经免疫方面研究。
marked manuscript

Quality evaluation of Flos Lonicerae through a simultaneous determination of seven saponins by HPLC with ELSDXing-Yun Chai1, Song-Lin Li2, Ping Li1*1Key Laboratory of Modern Chinese Medicines and Department of Pharmacognosy, China Pharmaceutical University, Nanjing, 210009, People’s Republic of China2Institute of Nanjing Military Command for Drug Control, Nanjing, 210002, People’s Republic of China*Corresponding author: Ping LiKey Laboratory of Modern Chinese Medicines and Department of Pharmacognosy, China Pharmaceutical University, Nanjing 210009, People’s Republic of China.E-mail address: lipingli@Tel.: +86-25-8324-2299; 8539-1244; 135********Fax: +86-25-8532-2747AbstractA new HPLC coupled with evaporative light scattering detection (ELSD) method has been developed for the simultaneous quantitative determination of seven major saponins, namely macranthoidinB (1), macranthoidin A (2), dipsacoside B (3), hederagenin-28-O-β-D-glucopyranosyl(6→1)-O-β-D- glucopyranosyl ester (4), macranthoside B (5), macranthoside A (6), and hederagenin-3-O-α-L-arabinopyranosyl(2→1)-O-α-L-rhamnopyranoside (7)in Flos Lonicerae, a commonly used traditional Chinese medicine (TCM) herb.Simultaneous separation of these seven saponins was achieved on a C18 analytical column with a mixed mobile phase consisting of acetonitrile(A)-water(B)(29:71 v/v) acidified with 0.5% acetic acid. The elution was operated from keeping 29%A for 10min, then gradually to 54%B from 10 to 25 min on linear gradient, and then keep isocratic elution with 54%B from 25 to 30min.The drift tube temperature of ELSD was set at 106℃, and with the nitrogen flow-rate of 2.6 l/min. All calibration curves showed good linear regression (r2 0.9922) within test ranges. This method showed good reproducibility for the quantification of these seven saponins in Flos Lonicerae with intra- and inter-day variations of less than 3.0% and 6.0% respectively. The validated method was successfully applied to quantify seven saponins in five sources of Flos Lonicerae, which provides a new basis of overall assessment on quality of Flos Lonicerae.Keywords: HPLC-ELSD; Flos Lonicerae; Saponins; Quantification1. IntroductionFlos Lonicerae (Jinyinhua in Chinese), the dried buds of several species of the genus Lonicera (Caprifoliaceae), is a commonly used traditional Chinese medicine (TCM) herb. It has been used for centuries in TCM practice for the treatment of sores, carbuncles, furuncles, swelling and affections caused by exopathogenic wind-heat or epidemic febrile diseases at the early stage [1]. Though four species of Lonicera are documented as the sources of Flos Lonicerae in China Pharmacopeia (2000 edition), i.e. L. japonica, L. hypoglauca,L. daystyla and L. confusa, other species such as L. similes and L. macranthoides have also been used on the same purpose in some local areas in China [2]. So it is an important issue to comprehensively evaluate the different sources of Flos Lonicerae, so as to ensure the clinical efficacy of this Chinese herbal drug.Chemical and pharmacological investigations on Flos Lonicerae resulted in discovering several kinds of bioactive components, i.e. chlorogenic acid and its analogues, flavonoids, iridoid glucosides and triterpenoid saponins [3]. Previously, chlorogenic acid has been used as the chemical marker for the quality evaluation of Flos Lonicerae,owing to its antipyretic and antibiotic property as well as its high content in the herb. But this compound is not a characteristic component of Flos Lonicerae, as it has also been used as the chemical marker for other Chinese herbal drugs such as Flos Chrysanthemi and so on[4-5]. Moreover, chlorogenic acid alone could not be responsible for the overall pharmacological activities of Flos Lonicerae[6].On the other hand, many studies revealed that triterpenoidal saponins of Flos Lonicerae possess protection effects on hepatic injury caused by Acetaminophen, Cd, and CCl4, and conspicuous depressant effects on swelling of ear croton oil [7-11]. Therefore, saponins should also be considered as one of the markers for quality control of Flos Lonicerae. Consequently, determinations of all types of components such as chlorogenic acid, flavonoids, iridoid glucosides and triterpenoidal saponins in Flos Lonicerae could be a better strategy for the comprehensive quality evaluation of Flos Lonicerae.Recently an HPLC-ELSD method has been established in our laboratory for qualitative and quantitative determination of iridoid glucosides in Flos Lonicerae [12]. But no method was reported for the determination of triterpenoidal saponins in Flos Lonicera. As a series studies on the comprehensive evaluation of Flos Lonicera, we report here, for the first time, the development of an HPLC-ELSD method for simultaneous determination of seven triterpenoidal saponins in the Chinese herbal drug Flos Lonicerae, i.e.macranthoidin B (1), macranthoidin A (2), dipsacoside B (3), hederagenin-28-O-β-D-glucopyranosyl(6→1)-O-β-D- glucopyranosyl ester (4), macranthoside B (5), macranthoside A (6), and hederagenin-3-O-α-L-arabinopyranosyl(2→1)-O-α-L-rhamnopyranoside (7) (Fig. 1).2. Experimental2.1. Samples, chemicals and reagentsFive samples of Lonicera species,L. japonica from Mi county, HeNan province (LJ1999-07), L. hypoglauca from Jiujang county, JiangXi province (LH2001-06), L. similes from Fei county, ShanDong province (LS2001-07), L. confuse from Xupu county, HuNan province (LC2001-07), and L. macranthoides from Longhu county, HuNan province (LM2000-06) respectively, were collected in China. All samples were authenticated by Dr. Ping Li, professor of department of Pharmacognosy, China Pharmaceutical University, Nanjing, China. The voucher specimens were deposited in the department of Pharmacognosy, China Pharmaceutical University, Nanjing, China. Seven saponin reference compounds: macranthoidin B (1), macranthoidin A (2), dipsacoside B (3), hederagenin-28-O-β-D-glucopyranosyl(6→1)-O-β-D- glucopyranosyl ester (4), macranthoside B (5), macranthoside A (6), and hederagenin-3-O-α-L-arabinopyranosyl(2→1)-O-α-L-rhamnopyranoside (7) were isolated previously from the dried buds of L. confusa by repeated silica gel, sephadex LH-20 and Rp-18 silica gel column chromatography, their structures were elucidated by comparison of their spectral data (UV, IR, MS, 1H- NMR and 13C-NMR) with references [13-15]. The purity of these saponins were determined to be more than 98% by normalization of the peak areas detected by HPLC with ELSD, and showed very stable in methanol solution.HPLC-grade acetonitrile from Merck (Darmstadt, Germany), the deionized water from Robust (Guangzhou, China), were purchased. The other solvents, purchased from Nanjing Chemical Factory (Nanjing, China) were of analytical grade.2.2. Apparatus and chromatographic conditionsAglient1100 series HPLC apparatus was used. Chromatography was carried out on an Aglient Zorbax SB-C18 column(250 4.6mm, 5.0µm)at a column temperature of 25℃.A Rheodyne 7125i sampling valve (Cotati, USA) equipped with a sample loop of 20µl was used for sample injection. The analog signal from Alltech ELSD 2000 (Alltech, Deerfield, IL, USA)was transmitted to a HP Chemstation for processing through an Agilent 35900E (Agilent Technologies, USA).The optimum resolution was obtained by using a linear gradient elution. The mobile phase was composed of acetonitrile(A) and water(B) which acidified with 0.5% acetic acid. The elution was operated from keeping 29%A for 10min, then gradually to 54%B from 10 to 25 min in linear gradient, and back to the isocratic elution of 54%B from 25 to 30 min.The drift tube temperature for ELSD was set at 106℃and the nitrogen flow-rate was of 2.6 l/min. The chromatographic peaks were identified by comparing their retention time with that of each reference compound tried under the same chromatographic conditions with a series of mobile phases. In addition, spiking samples with the reference compounds further confirmed the identities of the peaks.2.3. Calibration curvesMethanol stock solutions containing seven analytes were prepared and diluted to appropriate concentration for the construction of calibration curves. Six concentrationof the seven analytes’ solution were injected in triplicate, and then the calibration curves were constructed by plotting the peak areas versus the concentration of each analyte. The results were demonstrated in Table1.2.4. Limits of detection and quantificationMethanol stock solution containing seven reference compounds were diluted to a series of appropriate concentrations with methanol, and an aliquot of the diluted solutions were injected into HPLC for analysis.The limits of detection (LOD) and quantification (LOQ) under the present chromatographic conditions were determined at a signal-to-noise ratio (S/N) of 3 and 10, respectively. LOD and LOQ for each compound were shown in Table1.2.5. Precision and accuracyIntra- and inter-day variations were chosen to determine the precision of the developed assay. Approximate 2.0g of the pulverized samples of L. macranthoides were weighted, extracted and analyzed as described in 2.6 Sample preparation section. For intra-day variability test, the samples were analyzed in triplicate for three times within one day, while for inter-day variability test, the samples were examined in triplicate for consecutive three days. Variations were expressed by the relative standard deviations. The results were given in Table 2.Recovery test was used to evaluate the accuracy of this method. Accurate amounts of seven saponins were added to approximate 1.0g of L. macranthoides,and then extracted and analyzed as described in 2.6 Sample preparation section. The average recoveries were counted by the formula: recovery (%) = (amount found –original amount)/ amount spiked ×100%, and RSD (%) = (SD/mean) ×100%. The results were given in Table 3.2.6. Sample preparationSamples of Flos Lonicerae were dried at 50℃until constant weight. Approximate 2.0g of the pulverized samples, accurately weighed, was extracted with 60% ethanol in a flask for 4h. The ethanol was evaporated to dryness with a rotary evaporator. Residue was dissolved in water, followed by defatting with 60ml of petroleum ether for 2 times, and then the water solution was evaporated, residue was dissolved with methanol into a 25ml flask. One ml of the methanol solution was drawn and transferred to a 5ml flask, diluted to the mark with methanol. The resultant solution was at last filtrated through a 0.45µm syringe filter (Type Millex-HA, Millipore, USA) and 20µl of the filtrate was injected to HPLC system. The contents of the analytes were determined from the corresponding calibration curves.3. Results and discussionsThe temperature of drift tube and the gas flow-rate are two most important adjustable parameters for ELSD, they play a prominent role to an analyte response. In ourprevious work [12], the temperature of drift tube was optimized at 90°C for the determination of iridoids. As the polarity of saponins are higher than that of iridoids, more water was used in the mobile phase for the separation of saponins, therefore the temperature for saponins determination was optimized systematically from 95°C to 110°C, the flow-rate from 2.2 to 3.0 l/min. Dipsacoside B was selected as the testing saponin for optimizing ELSD conditions, as it was contained in all samples. Eventually, the drift tube temperature of 106℃and a gas flow of 2.6 l/min were optimized to detect the analytes. And these two exact experimental parameters should be strictly controlled in the analytical procedure [16].All calibration curves showed good linear regression (r2 0.9922) within test ranges. Validation studies of this method proved that this assay has good reproducibility. As shown in Table 2, the overall intra- and inter-day variations are less than 6% for all seven analytes. As demonstrated in Table 3, the developed analytical method has good accuracy with the overall recovery of high than 96% for the analytes concerned. The limit of detection (S/N=3) and the limit of quantification (S/N=10) are less than 0.26μg and 0.88μg respectively (Table1), indicating that this HPLC-ELSD method is precise, accurate and se nsitive enough for the quantitative evaluation of major non- chromaphoric saponins in Flos Lonicerae.It has been reported that there are two major types of saponins in Flos Lonicerae, i.e. saponins with hederagenin as aglycone and saponins with oleanolic acid as the aglycone [17]. But hederagenin type saponins of the herb were reported to have distinct activities of liver protection and anti-inflammatory [7-11]. So we adoptedseven hederagenin type saponins as representative markers to establish a quality control method.The newly established HPLC-ELSD method was applied to analyze seven analytes in five plant sources of Flos Lonicerae, i.e. L. japonica,L. hypoglauca,L. confusa,L. similes and L. macranthoides(Table 4). It was found that there were remarkable differences of seven saponins contents between different plant sources of Flos Lonicerae. All seven saponins analyzed could be detected in L. confusa and L. hypoglauca, while only dipsacoside B was detected in L. japonica. Among all seven saponins interested, only dipsacoside B was found in all five plant species of Flos Lonicerae analyzed, and this compound was determined as the major saponin with content of 53.7 mg/g in L. hypoglauca. On the other hand, macranthoidin B was found to be the major saponin with the content higher than 41.0mg/g in L. macranthoides,L. confusa, and L. similis, while the contents of other analytes were much lower.In our previous study [12], overall HPLC profiles of iridoid glucosides was used to qualitatively and quantitatively distinguish different origins of Flos Lonicerae. As shown in Fig.2, the chromatogram profiles of L. confusa, L. japonica and L. similes seem to be similar, resulting in the difficulty of clarifying the origins of Flos Lonicerae solely by HPLC profiles of saponins, in addition to the clear difference of the HPLC profiles of saponins from L. macranthoides and L. hypoglauca.Therefore, in addition to the conventional morphological and histological identification methods, the contents and the HPLC profiles of saponins and iridoids could also be used as accessory chemical evidence toclarify the botanical origin and comprehensive quality evaluation of Flos Lonicerae.4. ConclusionsThis is the first report on validation of an analytical method for qualification and quantification of saponins in Flos Lonicerae. This newly established HPLC-ELSD method can be used to simultaneously quantify seven saponins, i.e. macranthoidin B, macranthoidin A, dipsacoside B, hederagenin-28-O-β-D-glucopyranosyl(6→1)-O-β-D- glucopyranosyl ester, macranthoside B, macranthoside A, and hederagenin-3-O-α-L-arabinopyranosyl(2→1)-O-α-L-rhamnopyranoside in Flos Lonicerae. Together with the HPLC profiles of iridoids, the HPLC-ELSD profiles of saponins could also be used as an accessory chemical evidence to clarify the botanical origin and comprehensive quality evaluation of Flos Lonicerae.AcknowledgementsThis project is financially supported by Fund for Distinguished Chinese Young Scholars of the National Science Foundation of China (30325046) and the National High Tech Program(2003AA2Z2010).[1]Ministry of Public Health of the People’s Republic of China, Pharmacopoeia ofthe People’s Republic of China, V ol.1, 2000, p. 177.[2]W. Shi, R.B. Shi, Y.R. Lu, Chin. Pharm. J., 34(1999) 724.[3]J.B. Xing, P. Li, D.L. Wen, Chin. Med. Mater., 26(2001) 457.[4]Y.Q. Zhang, L.C. Xu, L.P. Wang, J. Chin. Med. Mater., 21(1996) 204.[5] D. Zhang, Z.W. Li, Y. Jiang, J. Pharm. Anal., 16(1996) 83.[6]T.Z. Wang, Y.M. Li, Huaxiyaoxue Zazhi, 15(2000) 292.[7]J.ZH. Shi, G.T. Liu. Acta Pharm. Sin., 30(1995) 311.[8]Y. P. Liu, J. Liu, X.SH. Jia, et al. Acta Pharmacol. Sin., 13 (1992) 209.[9]Y. P. Liu, J. Liu, X.SH. Jia, et al. Acta Pharmacol. Sin., 13 (1992) 213.[10]J.ZH. Shi, L. Wan, X.F. Chen.ZhongYao YaoLi Yu LinChuang, 6 (1990) 33.[11]J. Liu, L. Xia, X.F. Chen. Acta Pharmacol. Sin., 9 (1988) 395[12]H.J. Li, P. Li, W.C. Ye, J. Chromatogr. A 1008(2003) 167-72.[13]Q. Mao, D. Cao, X.SH. Jia. Acta Pharm. Sin., 28(1993) 273.[14]H. Kizu, S. Hirabayashi, M. Suzuki, et al. Chem. Pharm. Bull., 33(1985) 3473.[15]S. Saito, S. Sumita, N. Tamura, et al. Chem Pharm Bull., 38(1990) 411.[16]Alltech ELSD 2000 Operating Manual, Alltech, 2001, p. 16. In Chinese.[17]J.B. Xing, P. Li, Chin. Med. Mater., 22(1999) 366.Fig. 1 Chemical structures of seven saponins from Lonicera confusa macranthoidin B (1), macranthoidin A (2), dipsacoside B (3), hederagenin-28-O-β-D-glucopyranosyl(6→1)-O-β-D- glucopyranosyl ester (4), macranthoside B (5), macranthoside A (6), and hederagenin-3-O-α-L-arabinopyranosyl(2→1)-O-α-L-rhamnopyranoside (7)Fig. 2Representative HPLC chromatograms of mixed standards and methanol extracts of Flos Lonicerae.Column: Agilent Zorbax SB-C18 column(250 4.6mm, 5.0µm), temperature of 25℃; Detector: ELSD, drift tube temperature 106℃, nitrogen flow-rate 2.6 l/min.A: Mixed standards, B: L. confusa, C: L. japonica, D: L. macranthoides, E: L. hypoglauca, F: L. similes.Table 1 Calibration curves for seven saponinsAnalytes Calibration curve ar2Test range(μg)LOD(μg)LOQ(μg)1 y=6711.9x-377.6 0.9940 0.56–22.01 0.26 0.882 y=7812.6x-411.9 0.9922 0.54–21.63 0.26 0.843 y=6798.5x-299.0 0.9958 0.46–18.42 0.22 0.724 y=12805x-487.9 0.9961 0.38–15.66 0.10 0.345 y=4143.8x-88.62 0.9989 0.42–16.82 0.18 0.246 y=3946.8x-94.4 0.9977 0.40–16.02 0.16 0.207 y=4287.8x-95.2 0.9982 0.42–16.46 0.12 0.22a y: Peak area; x: concentration (mg/ml)Table 2 Reproducibility of the assayAnalyteIntra-day variability Inter-day variability Content (mg/g) Mean RSD (%) Content (mg/g) Mean RSD (%)1 46.1646.2846.2246.22 0.1346.2245.3647.4226.33 2.232 5.385.385.165.31 2.405.285.345.045.22 3.043 4.374.304.184.28 2.244.284.464.024.255.204 nd1)-- -- nd -- --5 1.761.801.821.79 1.701.801.681.841.77 4.706 1.281.241.221.252.451.241.341.201.26 5.727 tr2)-- -- tr -- -- 1): not detected; 2): trace. RSD (%) = (SD/Mean) ×100%Table 3 Recovery of the seven analytesAnalyteOriginal(mg) Spiked(mg)Found(mg)Recovery(%)Mean(%)RSD(%)1 23.0823.1423.1119.7122.8628.1042.7346.1351.0199.7100.699.399.8 0.722.692.672.582.082.913.164.735.515.7698.197.6100.698.8 1.632.172.152.091.732.182.623.884.404.6598.8103.297.799.9 2.94nd1)1.011.050.980.981.101.0297.0104.8104.1102.0 4.250.880.900.910.700.871.081.561.752.0197.197.7101.898.9 2.660.640.620.610.450.610.751.081.211.3397.796.796.096.8 0.97tr2)1.021.101.081.031.111.07100.9102.799.1100.9 1.81): not detected; 2): trace.a Recovery (%) = (Amount found –Original amount)/ Amount spiked ×100%, RSD (%) = (SD/Mean) ×100%Table 4 Contents of seven saponins in Lonicera spp.Content (mg/g)1 2 3 4 5 6 7 L. confusa45.65±0.32 5.13±0.08 4.45±0.11tr1) 2.04±0.04tr 1.81±0.03 L. japonica nd2)nd 3.44±0.09nd nd nd nd L. macranthoides46.22±0.06 5.31±0.13 4.28±0.10 tr 1.79±0.03 1.25±0.03 tr L. hypoglauca11.17±0.07 nq3)53.78±1.18nd 1.72±0.02 2.23±0.06 2.52±0.04 L. similes41.22±0.25 4.57±0.07 3.79±0.09nd 1.75±0.02tr nd 1): trace; 2): not detected.. 3) not quantified owing to the suspicious purity of the peak.。
安捷伦产品目录

15
Real-Time PCR
16
Mx3000P QPCR System
17
Brilliant III Ultra-Fast SYBR Green QPCR and QRT-PCR Reagents
18
Brilliant III Ultra-Fast QPCR and QRT-PCR Reagents
Agilent / STRATAGENE
Agilent website: /genomics
Welgene | Agilent Stratagene
威健股份有限公司 | Stratagene 總代理
Table of Content
Table of Contents
/ XL1-Red Competent Cells SoloPack Gold Supercompetent Cells
/ TK Competent Cells Specialty Cells
/ Classic Cells / Fine Chemicals For Competent Cells
適用於 UNG 去汙染或 bisulphite
sequencing
適用於 TA Cloning
最高敏感性
取代傳統 Taq 的好選擇
-
2
威健股份有限公司 | Stratagene 總代理
PCR Enzyme & Instrument
Agilent SureCycler 8800
市場上領先的 cycling 速度和 sample 體積 10 ~ 100 μL 簡易快速可以選擇 96 well 和 384 well 操作盤 優秀的溫控設備讓各個 well 都能保持溫度的穩定 七吋的高解析度觸控螢幕讓操作上更為簡便 可以透過網路遠端操控儀器及監控儀器 Agilent 專業的技術支援可以幫助您應對各種 PCR 的問題
蛋白核酸样品制备-bio-rad产品介绍
Quantum Prep质粒中型制备试剂盒采用了简便的离心柱操作流程,显著地缩短了大量质粒DNA制备所需的时间,所制备的DNA可用于转染、亚克隆和其它酶处理。
Chelex树脂
Bio-Rad提供两种以Chelex为基质的树脂,用于从多种粗样品(如血液、细菌、组织和头发)中抽提DNA。由于所抽提的DNA通常用于下游的PCR,因此它必须不含能抑制扩增反应的金属离子,Chelex由成对的亚氨基二乙酸离子结合在苯乙烯二乙烯苯基质上形成,对多价阳离子具有很强的选择性,从而有效地去除这类污染杂质。
■■哺乳动物、植物、酵母、微生物样品的细胞裂解和蛋白抽提实验方法
■■该试剂盒能使用于任何特殊种类的蛋白提取,不仅局限于下游MicroRotofor等电聚焦
■■试剂盒抽提的蛋白样品结果,不必再改变缓冲液条件,而能迅速使用MicroRotofor进行等电聚焦实验。
ReadyPrep小研磨试剂盒
Readyprep mini grinders研磨处理小量生物样品,对于核酸和蛋白质具有极高的回收率,每个小研磨棒( minigrinders )包括1.5ml含研磨树脂的研磨管和相应的研磨杵,研磨树脂是一种中性强张力的微粒状研磨剂,不与蛋白质和核酸结合。Readyprep mini grinders是一次性使用的试剂盒,并且不含有核酸酶或蛋白酶,他们也是MicroRotofor裂解试剂盒(哺乳动物)的组成成分,可以分开单独出售,每20个为一个包装,mini grinders具有以下特性:
Aurum质粒小型制备试剂盒能为ቤተ መጻሕፍቲ ባይዱ下领域的研究制备高产量重现性高的质粒DNA:
■■全自动荧光测序
■■限制性酶切
■■连接和转化
■■转染
离子色谱法测定甲磺酸伊马替尼中残留的二甲胺

离子色谱法测定甲磺酸伊马替尼中残留的二甲胺嵇海澄;李孝壁;李琴;姜涛;胡春勇【摘要】Objective To establish a method the determination of dimethylamine in imatinib mesylate by ion chromatography. Methods The determination was carried out on a Dionex IonPacCS12A(250mm×4.6mm)column with 20mmol/L methanesulfonic acid solution as eluent by electrical conductivity detector.The flow rate was1.0mL/min,The column temperature was 30℃,and temperature of conductivity detection pool was 35℃. Results There was a good linearity over the range of 0.10-9.84μg/mL with a the correlation coefficient r higher than 1.0000(n=6).The RSD for repeatition was 0.11%(n=6),The average recovery was 97.5%with RSD of accuracy at 1.8%. Conclusion The Methods was simple,accurate and good reproducibility,which can be used for the determination of dimethylamine for imatinib mesylate.%目的:建立了一种离子色谱法测定伊马替尼中二甲胺的方法。
硫辛酸注射液联合胰激肽原酶肠溶片对DPN_的临床疗效及生存质量的影响

DOI:10.16658/ki.1672-4062.2024.01.174硫辛酸注射液联合胰激肽原酶肠溶片对DPN的临床疗效及生存质量的影响王莉,朱海峰濉溪县中医医院内分泌科,安徽淮北235100[摘要]目的探讨硫辛酸注射液联合胰激肽原酶肠溶片对2型糖尿病周围神经病变(Diabetic Peripheral Neu⁃ropathy, DPN)患者的临床疗效、生存质量及安全性的影响。
方法选取2021年2月—2022年4月濉溪县中医医院60名DPN患者作为研究对象。
通过随机数表法分为两组,每组30例。
对照组采用常规治疗,观察组在对照组基础上加用硫辛酸注射液和胰激肽原酶肠溶片治疗。
比较两组患者的神经病变评分、神经电生理指标、生存质量评分、安全性指标和不良反应发生率。
结果治疗后,观察组神经病变评分(6.2±0.9)分低于对照组(7.6±1.1)分,差异有统计学意义(t=5.438,P<0.05);观察组神经电生理指标、生存质量评分、安全性指标均优于对照组,差异有统计学意义(P均<0.05);两组患者不良反应发生率比较,差异无统计学意义(P>0.05)。
结论硫辛酸注射液联合胰激肽原酶肠溶片对DPN患者有良好的临床疗效,能够改善神经功能、改善神经电生理指标、提高生存质量,且安全性高。
[关键词] 硫辛酸注射液;胰激肽原酶肠溶片;2型糖尿病周围神经病变;临床疗效[中图分类号] R587.2 [文献标识码] A [文章编号] 1672-4062(2024)01(a)-0174-05Effect of Lipoic Acid Injection Combined with Pancreatic Kininogenase Enteric-coated Tablets on Clinical Efficacy and Quality of Survival in DPN WANG Li, ZHU HaifengDepartment of Endocrinology, Suixi County Hospital of Traditional Chinese Medicine, Huaibei, Anhui Province, 235100 China[Abstract] Objective To investigate the effects of lipoic acid injection combined with pancreatic kininogenase enteric-coated tablets on the clinical efficacy, quality of survival and safety of patients with type 2 diabetic peripheral neuropathy (DPN). Methods 60 DPN patients admitted to Suixi County Hospital of Traditional Chinese Medicine from February 2021 to April 2022 were selected as the study objects. They were divided into two groups with 30 cases in each group by random number table method. The control group received conventional treatment, and the observation group was treated with lipoic acid injection and pancreatic kininogenase enteric-coated tablets on the basis of control group. Neuropathy score, neuroelectrophysiological index, quality of life score, safety index and incidence of adverse reactions were compared between the two groups. Results After treatment, the neuropathy score of observation group (6.2±0.9) points was lower than that of control group (7.6±1.1) points, and the difference was statistically significant (t= 5.438, P<0.05). Neuroelectrophysiological indexes, quality of survival scores and safety indexes of the observation group were better than those of the control group, and the differences were statistically significant (all P<0.05). There was no significant difference in the incidence of adverse reactions between the two groups (P>0.05). Conclusion Li⁃[作者简介]王莉(1982-),女,本科,主治医生,研究方向为糖尿病周围神经病变。