Microstructure and mechanical properties of wrought Mg-4.1Li-2.5Al-1.7Zn-1Sn alloy
TC17钛合金激光焊接接头微观组织和力学性能
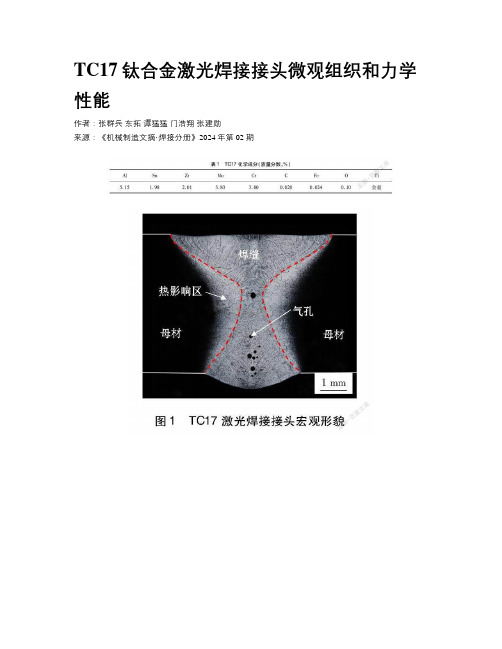
TC17钛合金激光焊接接头微观组织和力学性能作者:张群兵东拓谭猛猛门浩翔张建勋来源:《机械制造文摘·焊接分册》2024年第02期摘要:文中对TC17钛合金进行了激光焊接,对接头的宏观形貌、微观组织、显微硬度和拉伸性能进行了研究。
结果表明,TC17母材的微观组织为β相+等轴初生αp相,β相内存在大量次生αs相;热影响区微观组织变化较为复杂,随着离焊缝距离的减小,αp逐渐减少,β逐渐增多,αs先消失、再产生、然后再次消失;焊缝由β相柱状晶组成,柱状晶内部是细长的枝晶,在焊缝的中下部存在较多气孔;从母材到焊缝,硬度总体呈下降趋势;受αs含量变化的影响,随着离焊缝距离的减小,热影响区显微硬度先降低、再升高、然后再次降低;由于焊缝硬度最低且存在气孔缺陷,接头拉伸断裂在焊缝。
关键词:激光焊;微观组织;力学性能;TC17钛合金中图分类号: TG 456.7Microstructure and Mechanical Properties of TC17 Titanium Alloy Laser Welded JointZhang Qunbing1, Dong Tuo1, Tan Mengmeng1, Men Haoxiang1, Zhang Jianxun2(1. Xi’an Aeronautical Institute,Xi’an, 710077, China; 2. State key laboratory for mechanical behavior of materials,Xi’an Jiaotong University,Xi’an, 710049, China)Abstract: In this paper, the laser welding of TC17 titanium alloy was carried out, and the macroscopic morphology, microstructure, microhardness and tensile properties of the joint were studied. The results show that TC17 titanium alloy base material is composed of β phase and equiaxed αp phase,and there is a lot of acicular secondary αs phase in β phase. The microstructure of heataffected zone is complicated. With the decrease of distance from the weld zone,αp gradually decreases,β gradually increases,αs first disappears, then occurs, and finally disappears again. The microstructure of weld zone is mainly composed of columnar dendrites, and the porosity defects were mainly concentrated in the middle and lower part of the weld zone. From the base metal to the weld zone,hardness generally decreased. Affected by the αs phase, the microhardness of the heataffected zone decreases first, then increases and then decreases. Due to the lowest hardness and porosity defects of weld zone, the tensile fracture of TC17 titanium alloy laser welded joint was in the weld zone.基金项目:陕西省自然科学基础研究计划项目(2019JQ-915)Key words: laser welding; microstructure; mechanical property; TC17 titanium alloy0前言钛合金具有比强度高、力学性能好、耐腐蚀性强等优点,已广泛应用于航空领域。
7050-T7651_铝合金厚板显微组织及力学性能不均匀性

2023 年第 43 卷航 空 材 料 学 报2023,Vol. 43第 4 期第 76 – 85 页JOURNAL OF AERONAUTICAL MATERIALS No.4 pp.76 – 85 7050-T7651铝合金厚板显微组织及力学性能不均匀性王经涛1,2*, 孙 宁1,2, 黄同瑊1, 程志远1,2, 郭富安1,2, 郭丰佳1,2(1.山东南山铝业股份有限公司 国家铝合金压力加工工程技术研究中心,山东 龙口 265713;2.山东南山科学技术研究院有限公司 ,山东 龙口 265713)摘要:采用金相显微镜、扫描电镜、透射电镜和力学拉伸试验机,研究160 mm 7050-T7651铝合金特厚板不同厚度位置的金相组织、晶粒取向、织构类型、时效纳米析出相分布以及力学性能的差异。
结果表明:从板材表层到心部,组织中的第二相粒子含量降低,但尺寸增加;板材表层以小角度晶界亚结构组织为主,小角度晶界比例在79%~85%之间,而板材心部小角度晶界的比例为58%左右,相比于板材表层小角度晶界比例降低了26.6%~31.8%;板材表层以{001}<110>剪切织构为主,占比为3.64%,并随厚度增加,变形织构组分含量逐渐增多;板材厚度方向力学性能呈现出沿厚度表层-心部-表层方向先降低后升高的趋势,且力学性能最优位置均为板材表层位置。
关键词:7050-T7651铝合金厚板;显微组织;织构;力学性能;不均匀性doi:10.11868/j.issn.1005-5053.2023.000008中图分类号:TG146.1 文献标识码:A 文章编号:1005-5053(2023)04-0076-10Inhomogeneity of microstructure and mechanical propertiesof 7050-T7651 aluminum alloy thick plateWANG Jingtao1,2*, SUN Ning1,2, HUANG Tongjian1, CHENG Zhiyuan1,2,GUO Fuan1,2, GUO Fengjia1,2(1. National Engineering Research Center for Plastic Working of Aluminium Alloys, Shandong Nanshan Aluminium Co., Ltd. , Longkou 265713,Shandong, China;2. Shandong Nanshan Academy of Science and Technology Co., Ltd. , Longkou 265713,Shandong, China)Abstract:The differences in the microstructure, grain orientation, texture type, aging nano precipitate phase distribution and mechanical properties of 160 mm 7050-T7651 aluminum alloy extra-thick plate at different thickness positions were studied by means of metallographic microscope, scanning electron microscope, transmission electron microscope and mechanical tensile test. The results show that from the surface to the center of the plate, the content of the second phase particles in the microstructure decreases, but the size increases; The surface layer of the plate is mainly composed of small angle grain boundaries. The proportion of small angle grain boundaries ranges from 79% to 85%, while the proportion of small angle grain boundaries in the center of the plate is about 58%, which is a decrease of 26.6% to 31.8% compared to the proportion of small angle grain boundaries on the surface layer of the plate; The surface layer of the plate is mainly characterized by {001}<110>shear texture, accounting for 3.64%. As the thickness increases, the content of deformation texture components gradually increases. The mechanical properties of the plate in the thickness direction show a trend of first decreasing and then increasing along the thickness surface-center-surface direction, and the optimal positions for mechanical properties are all located at the surface of the plate.Key words: 7050-T7651 aluminum alloy thick plate;microstructure;texture;mechanical property;inhomogeneity现阶段国内外飞机的生产均向着大型多载客、安全长寿命等方向发展,对飞机部件结构材料的强度、耐腐蚀、断裂韧度等性能提出了更加严格的要求。
Microstructural evolution and mechanical propertie

International Journal of Minerals, Metallurgy and Materials Volume 25, Number 11, November 2018, Page 1294https:///10.1007/s12613-018-1682-8Corresponding author: Hamed Jamshidi Aval E-mail:h.jamshidi@nit.ac.ir© University of Science and Technology Beijing and Springer-Verlag GmbH Germany, part of Springer Nature 2018Microstructural evolution and mechanical properties of friction stir-weldedC71000 copper–nickel alloy and 304 austenitic stainless steelHamed Jamshidi AvalDepartment of Materials and Industrial Engineering, Babol Noshirvani University of Technology, Shariati Avenue, Babol, 47148-71167, Iran(Received: 20 February 2018; revised: 29 May 2018; accepted: 11 June 2018)Abstract: Dissimilar joints comprised of copper–nickel and steel alloys are a challenge for manufacturers in modern industries, as these met-als are not thermomechanically or chemically well matched. The present study investigated the effects of tool rotational speed and linear speed on the microstructure and mechanical properties of friction stir-welded C71000 copper–nickel and 340 stainless steel alloys using a tungsten carbide tool with a cylindrical pin. The results indicated that a rotational-to-linear speed ratio of 12.5 r/mm did not cause any macro defects, whereas some tunneling defects and longitudinal cracks were found at other ratios that were lower and higher. Furthermore, chro-mium carbide was formed on the grain boundaries of the 304 stainless steel near the shoulder zone and inside the joint zone, directing carbon and chromium penetration toward the grain boundaries. Tensile strength and elongation percentages were 84% and 65% of the corresponding values in the copper–nickel base metal, respectively.Keywords: dissimilar friction stir welding; copper–nickel alloy; austenitic stainless steel; microstructure; mechanical properties1. IntroductionCopper–nickel alloys exhibit substantial corrosion resis-tance and anti-algae properties against biological sediments. Pure copper is not stable in oxygenated electrolytes, espe-cially in marine and chlorine ion environments where cop-per–nickel alloys are widely used, with copper as the main component [1]. The addition of nickel to copper improves the mechanical strength, durability, and resistance to corro-sion, abrasion, and cavitation in sea and polluted water. This alloy also exhibits significant stress corrosion cracking and corrosion fatigue resistance. Corrosion resistance can be in-creased by adding more nickel to copper–nickel alloys [2]. Since these alloys can be easily assembled and welded, they are prime candidates for plumbing systems, ship bodies, and other marine structures.Generally, stainless steel plays a major role in the modern world. Welding of austenite stainless steel is known for two important properties: maintenance of corrosion resistance and prevention of crack formation. Dissimilar joints of coatings on offshore platform insulators, achieved by different tech-niques, are among copper–nickel plate applications for corro-sion prevention. Other applications include the joining of copper–nickel pipes with steel flanges and/or direct joining of these pipes with steel pipes in marine industries [3].Nevertheless, welding of dissimilar metals is always challenging because of numerous factors. These include different melting points, thermal conductivity, and thermal expansion coefficients; galvanic corrosion; the high solidi-fication rate of molten copper; entry of molten copper into steel grain boundaries (especially in the heat-affected zone (HAZ)); formation of hot cracks; high copper oxidation at high temperatures; and type of filler metal [4−9]. It is essen-tial to select the appropriate filler metal and welding para-meters for dissimilar-metal fusion welding of copper–nickel and stainless steel alloys in order to reduce probable defects (e.g., cavitation and gas cavities).Recent developments in solid-state welding have made it an alternative to fusion welding. In comparison to other welding techniques, friction-stir welding is a solid-state technique with an outstanding combination of high speed, precision, and variety. Among different welding methods, friction-stir welding of dissimilar alloys is important due to the ability to join alloys with different properties. In addition,H. Jamshidi Aval, Microstructural evolution and mechanical properties of friction stir-welded C71000 copper–nickel (1295)different welding configurations in this method (e.g., lap and butt joints) make it applicable in different situations.Few studies have been conducted on friction-stir welding of dissimilar copper and stainless steel alloys. In this regard, Imani et al. [10] investigated a pure copper and stainless steel joint with a thickness of 3 mm using friction-stir weld-ing. It was found that the tool offset toward the copper side played a significant role in eliminating defects in the joints. In addition, Ramirez et al. [11] examined the effects of tool offset on the microstructure and mechanical properties of joints in friction-stir welding of pure copper and 316 stain-less steel with a thickness of 2 mm. They studied 0, 0.6, and 1.6 mm offsets relative to the joint interface. When a major part of the tool was on the steel side, the joint efficiency was 55% of copper base metal. Maximum joint efficiency, i.e., 87% of copper base metal, was reported in the 0.6-mm off-set relative to the joint interface.Furthermore, Najafkhani et al. [12] studied the joint of pure copper and 316 stainless steel with a thickness of 5 mm using friction-stir welding. In their study, all joints cracked from the heat-affected zone of the copper base metal. The highest tensile strength and elongation percentage were 220 MPa and 7%, respectively. In addition, Shamsujjoha et al. [13] studied the lap joint of pure copper with 1018 carbon steel using friction-stir welding. They found that the joining process at the interface was both mechanical and metallur-gical. Jafari et al. [14] also studied the friction-stir welding of pure copper and 304 stainless steel with a thickness of 3 mm. The heat input from the welding increased the grain size in the heat-affected zone and decreased joint ductility by increasing the number of welding passes.According to the literature, there are no studies on the friction-stir welding of copper−nickel and austenite stainless steel alloys. Accordingly, the present study investigated the effects of process parameters on the microstructure and me-chanical properties of friction stir-welded C71000 cop-per−nickel and 304 stainless steel alloys using a tungsten carbide tool with a cylindrical pin. Optical microscopy and scanning electron microscopy (SEM) were used to study the microstructure and detect the created phases in different zones. The mechanical properties of joints were also eva-luated by tensile and microhardness tests.2. ExperimentalIn the present study, C71000 copper−nickel and 304 aus-tenite stainless steel plates with thicknesses of 2 mm were used. Both plates were cut perpendicular to the rolled metal direction and had a dimension of 50 mm × 100 mm. The chemical compositions and mechanical properties of alloysare listed in Tables 1 and 2. The plates were welded in a buttjoint configuration. The copper−nickel alloy was on the re-treating side, while the stainless steel alloy was on the ad-vancing side. According to the literatures [10−11], 0.75 mmof the tool axis was offset to the copper−nickel alloy relativeto the joint interface. Fig. 1 shows the schematic of the tool offsetting procedure. A tungsten carbide tool with a cylin-drical pin with a height of 1.8 mm was used for welding. Fig.2 demonstrates the dimensions and geometry of the appliedtool in welding and Table 3 indicates the welding parameters.The present study selected two rotational speeds of 800 and1000 r/min and three linear speeds of 40, 60, and 80mm/min.Table 1. Chemical composition of alloy wt%ZnMnFeCrCuCNiAlloy0.90.010.05―Base0.0519.12C71000―1.20Base18.500.440.058.10SS304Table 2. Mechanical properties of alloysAlloyUltimate tensilestrength / MPaYieldstrength / MPaMicro-hardness,HV0.1Elonga-tion / %C71000338 110 9032 SS304585 210 15242Fig. 1.Schematic illustration of friction stir butt welding.Fig. 2. Tool geometrical characteristics.1296Int. J. Miner. Metall. Mater ., Vol. 25, No. 11, Nov. 2018Table 3. Friction stir welding process parametersRotational-to-linear speed ratio / (r ⋅mm –1)Linear speed / (mm ⋅min –1)Rotational speed / (r ⋅min –1)Sample No.20.00 40 800113.33 60 800 2 10.00 80 800 3 25.00 40 1000 4 16.65 60 1000 5 12.508010006The samples were transversely cut for metallographic studies. A marble solution was used for etching the micro-structure on the stainless steel side after sanding and polish-ing, whereas a nitric acid and distilled water solution was used for the copper–nickel alloy. Scanning electron micro-scopy (SEM) and X-ray diffraction (XRD) were used to evaluate the joint interface and examine the distribution and type of intermetallic compounds in the joint cross section. The mechanical properties of the joint were investigated us-ing a tensile test according to the ASTM E8-M03 standard. The tensile test was carried out at a crosshead speed of 1 mm/min. A Vickers microhardness testing machine with a load of 3 N and test time of 15 s was used to evaluate the hardness distribution of a joint cross section.3. Results and discussion3.1. Weld appearanceThe qualitative test of the welded samples indicated that samples No. 1–5 had defects. Longitudinal cracks on the copper–nickel side or tunneling defects on the stainless steel side were observed in all defected samples. Fig. 3 shows the effects of rotational and linear speed on the appearance of welding samples No. 1, 3, 4, and 6, as representative sam-ples containing cracks, tunneling defects, and defect-free welds. It is generally difficult to explain the causes of de-fects in the samples; however, the heat input may be an in-fluential factor. Many researchers have introduced various analytical, numerical, and empirical models in order to evaluate the relationship between rotational and linear tool speed and heat input and to examine their effects on the temperature distribution in the friction-stir welding proce-dure. With a proper estimation, the rotational-to-linear speed ratio can be considered a measure of welding heat input.In this study, samples No. 3 and 4 received the least and most heat input, respectively. The lower temperature of sample No. 3 caused insufficient material flow into the stir zone. After the tool was moved forward, the flow of material stopped before arriving at the advancing side. Therefore, there was inadequate material to fill the hole on the advanc-ing side (stainless steel). The tunnel hole led to the loss of joint strength in this sample, and the two parts were easily separated.Fig. 3. Surface appearance of welded samples: (a) No. 4; (b) No. 1; (c) No. 6: (d) No. 3.Fig. 3 presents the longitudinal cracks because of a tunneling defect in sample No. 3. Fig. 4 shows the effect of welding heat input on longitudinal crack length. It can be seen that by increasing the rotational-to-linear speed ratio (increasing welding heat input), the maximum temperature in the joint increased, which led to the higher temperature gradient in the welded samples. The significant difference in thermal conductivity of copper–nickel and stainless steel al-loys (thermal conductivity of copper–nickel is 2.8 times higher than that of stainless steel) [15–16] at a high temper-ature gradient produced longitudinal cracks as a result of thermal stress in the joint. According to the visual inspection of welded samples, a tunneling defect developed in the joint at a rotational-to-linear speed ratio of less than 10.00 r/mm.H. Jamshidi Aval, Microstructural evolution and mechanical properties of friction stir-welded C71000 copper–nickel (1297)On the other hand, at the rotational-to-linear speed ratio of 13.33 r/mm or higher, longitudinal cracks were formed at the joint interface.3.2. Macrostructure and microstructureThe evaluation of mechanical and metallurgical proper-ties was only carried out for sample No. 6 because it had no defects. The macrostructure of the joint and microstructure of different zones are shown in Figs. 5 and 6. The micro-structure of stainless steel included austenite and δ-ferrite with a grain size of (40 ± 5) µm (Fig. 5(b)). Although the quantity of ferrite phase was not significant, the presence of δ-ferrite could improve the formation of the sigma phase inalloys during friction-stir welding [17].Fig. 4. Effect of the rotational-to-linear speed ratio on cracklength.Fig. 5. Optical images of different zones of sample No. 4: (a) macrostructure of welded sample No. 4; (b) base metal of AISI 304; (c) base metal of C71000; (d) TMAZ in AISI 304 side; (e) SZ in AISI304 side; (f) TMAZ in C71000 side as marked by zone I in (a).1298 Int. J. Miner. Metall. Mater ., Vol. 25, No. 11, Nov. 2018Fig. 6. Microstructure of stir zone of sample No. 4: (a) microstructure of zone II in Fig. 5(a); (b) SZ in C71000 side; (c) SEM image of zone I in (a); (d) SEM image of zone II in (a).The copper–nickel microstructure had a grain size of (50 ± 4) µm and an average particle size of (10 ± 3) µm in the grain boundaries. The results of energy dispersive X-ray spectroscopy (EDS) indicated that these particles were nick-el-rich oxides with iron and zinc (Fig. 7). The stir zone mostly consisted of copper–nickel alloy, which was likely due to the lower flow stress of copper–nickel alloy [18] and location of the main part of the tool on the copper–nickel side. Different behaviors of the two alloys in the etchant so-lution confirmed this finding.Fig. 7. Element mapping result of base metal C71000 alloy.As shown in Fig. 5(a), a steel layer was drawn from the advancing zone to the retreating zone (zone I). The joint cross section as a result of friction-stir procedure consisted of the stir zone (SZ), thermomechanically affected zoneH. Jamshidi Aval, Microstructural evolution and mechanical properties of friction stir-welded C71000 copper–nickel (1299)(TMAZ), and heat-affected zone (HAZ). The mechanical behaviors of the welding materials, especially the welding zone hardness, were affected by high plastic deformation and high temperature during the friction-stir welding. The stir zone microstructure in the friction-stir weld had smaller and equiaxed grains in comparison with the base metal due to high plastic deformation and stir resulting from the tool pin.As presented in Fig. 5(f), grains in the thermomechani-cally affected zone on the copper–nickel side were elon-gated, which is exclusive to this zone [19]. The steel layer on the copper–nickel side contained recrystallized cop-per–nickel grains (Fig. 5(f)). On the other hand, the stir zone microstructure on the copper–nickel side contained equiaxed grains with a size of (15 ± 4) µm as a result of dynamic re-crystallization in this zone (Fig. 6(b)). The oxide particles observed in the copper–nickel base metal are shown in this figure. These particles were mainly at grain boundaries with a size of (5 ± 2) µm and prevented the growth of stir-zone grains.The EDS results showed that zinc and iron concentra-tions in the oxide particles increased (Figs. 7 and 8). The stir zone on the steel alloy side contained small recrystallized grains with a size of (5 ± 1) µm (Fig. 5(e)). Clearly, the grain size in the copper–nickel stir zone was greater than that of the steel-stir zone. The temperature and deformation rate in the friction-stir procedure had inverse effects on the grain size of the stir zone. In fact, an increase in the defor-mation rate led to a reduced grain size, and a rise in temper-ature increased the grain size in the stir zone [20].Fig. 8. Element mapping result of stir zone of C71000 side.The advancing side showed the highest temperature and deformation [21]. According to the stir zone microstructure results, the deformation effect was dominant on the steel side, and the grain size of stir zone reduced relative to the copper–nickel alloy side. On the contrary, elongated grains did not exist in the thermomechanically affected zone on the steel side (Fig. 5(d)). However, annealing twins were found across the base metal, whereas there were fewer twins in the thermomechanically affected zone of the steel. There were no twins in the stir zone on the steel side. An interesting point in the microstructure study was the occurrence of a specific layer-by-layer structure at the interface between copper–nickel and steel alloys near the tool shoulder (Fig. 6(a)). The SEM images of different zones in Fig. 6(a) are presented in Figs. 6(c) and 6(d).According to the line scan analysis presented in Fig. 9, the layer-by-layer structures consisted of copper-rich layers adjacent to iron-rich layers. Based on the comparison of the chemical composition of the copper-rich layer and cop-per–nickel base metal, this zone belonged to the cop-per–nickel base metal. However, the iron-rich layer did not match the chemical composition of steel base metal. The highest mass percentages of copper and chromium in the iron-rich layer were 9% and 30%, respectively. The iron-rich layer had a higher copper percentage, which in-creased to 31wt% in some layers.The high percentages of nickel and copper as austenite stabilizers could promote the formation of austenite phase. Generally, welding of austenite stainless steel can cause de-fects, including formation of the brittle phase, hot cracks, and carbide–chrome in grain boundaries. Copper, as an auste-nite-forming element, eliminates the δ-ferrite and sigma phases. Furthermore, the copper–nickel alloy limits the sigma phase by increasing the cooling rate from 600 to 800°C [22].1300Int. J. Miner. Metall. Mater ., Vol. 25, No. 11, Nov. 2018Fig. 9. SEM image and line scans of chemical elements at the layer structure: (a, b) zone I in Fig. 6(a): (c, d) Fig. 5(f).The sigma phase is very hard and brittle. Its value in-creases by increasing the percentage of chromium, molyb-denum, and silicon, but decreases by increasing the nitrogen, nickel, and carbon contents. Prevention of sigma phase for-mation in stainless steel is difficult when the chrome per-centage is about 20wt%. When the chrome percentage is less than 20wt%, the sigma phase is not observable in auste-nite stainless steels. Due to the very low amount of chrome (up to 9wt%) in the layered structure, formation of sigma phase is not expected.Fig. 10 shows the XRD analysis of the iron-rich zone in the layered structure (point A in Fig. 6(c)); the austenite phase is the only existing phase in this zone. The high per-centage of nickel and copper prevented the formation of sigma phase as expected. The line scan analysis (Fig. 9) in-dicated that nickel concentrations reduced in layer bounda-ries but increased in the iron-rich layers due to nickel migra-tion from the interface to iron-rich layers.According to the EDS results (Fig. 11(a)) regarding point A in Fig. 6(c), the nickel and copper percentages were 24wt% and 21wt%, respectively, indicating the diffusion ofFig. 10. XRD pattern of iron rich layer structure.nickel and copper from the copper–nickel alloy at the inter-face of steel alloy due to the close proximity of this region to the tool shoulder and high temperature of the zone. Ac-cording to the EDS results (Fig. 11(b)), regardless of the in-creased percentage of copper and nickel in the grain boun-daries of the recrystallized zone on the steel side, the high percentage of chrome indicates the increased effect of this element by moving toward the stir zone of the stainless steel. Carbon present in the grain boundaries indicates chrome carbide formation at the joint interface near the tool shoulder.H. Jamshidi Aval, Microstructural evolution and mechanical properties of friction stir-welded C71000 copper–nickel (1301)The chemical compositions of these spots indicate that chrome and carbon move toward high-energy zones and form chrome carbide. Formation of carbide and a chrome-free zone around the grain boundary can severely degrade corro-sion resistance of the joint. Analysis of point C (Fig. 11(c)) indicates that this zone belongs to 304 stainless steel. The transient zone in the joint interface can affect the mechanical properties of the joint. Partial diffusion and formation of iron- and copper-rich layers, as shown in Fig. 9, are alsoobserved in zone I of Fig. 5(a).3.3. Hardness evaluationThe joint microhardness profile at the mid-thickness of the weld cross section is presented in Fig. 12. Hardness of the stir zone increases by moving from the steel base metal. According to the Hall-Petch equation, smaller grains have greater hardness; accordingly, hardness increases by de-creasing the grain size and increasing the particle boundary density. Hardness near the interface fluctuates considering the layer-by-layer structure. This structure produces impor-tant features, such as non-uniform hardness profiles and stress concentration zones. The stir zone on the cop-per–nickel side had a more uniform hardness profile and lower quantity. Hardness gradually decreased to the level of copper–nickel base metal by moving toward the cop-per–nickel base metal.3.4. Tensile properties and fractographyThe stress–strain curves for the base metals and joint are shown in Fig. 13. The yield strength and tensile strength of the joint are 103 MPa and 285 MPa, respectively, while elongation is 21%; these values are significantly lower than the corresponding values in the base metals. Tensile strength and elongation of joint were 84% and 65% of the corres-ponding values, respectively in the copper–nickel base metal. It should be noted that fracture occurred in the weld nugget and at the interface of steel and copper–nickel. The hardness profile shows sudden fluctuations, which cause stress con-centrations and joint strength degradation.Fig. 12. Microhardness profiles of cross-section of joint No. 6.Fig. 11. EDS analysis of points A (a), B (b), and C (c) in Fig. 6(c).1302 Int. J. Miner. Metall. Mater ., Vol. 25, No. 11, Nov. 2018Fig. 13. Stress–strain curve of base metals and welded sample No. 6.The fractured cross section was investigated by SEM af-ter the tensile test. Fig. 14 shows the fractured section and SEM image. The SEM image of the fracture zone shows a brittle cleavage fracture, along with plastic deformation and small uniform holes on the surface. In the brittle cleavage fracture, the crack propagation corresponds to the successive and repeated breaking of atomic bonds along specific crys-tallographic planes. The fracture surface has a faceted tex-ture because of different orientations of the cleavage planes in the grains. In this type of fracture, no substantial plastic deformation occurs and the crack propagates very fast, nearly perpendicular to the direction of the applied stress. In the ductile fracture mode, spherical dimples correspond to microvoids initiating crack formation. Each dimple is half the size of the microvoid, which is formed and then sepa-rated during the fracture process. In the welded sample, brit-tle and ductile failures simultaneously occurred, which could be attributed to the transient zone (Fig. 12) and sud-den fluctuations in the hardness of the sample.Fig. 14. SEM image of fracture surface of the joint No. 6.4. ConclusionsThe present study investigated the friction-stir welding of C71000 and AISI304 stainless steel with a cylindrical pin tool and the following results were obtained.(1) Lack of proper material flow occurred as a result of low temperature at a rotational-to-linear speed ratio of 10 r/mm; therefore, there was not adequate material to fill the hole as the tool traveled forward on the advancing side (stainless steel). In case of rotational-to-linear speed ratio of greater than 20 r/mm, the high heat input produced a higher temperature gradient and resulted in the formation of longi-tudinal cracks as a result of thermal stress in the joint sec-tion.(2) The grain size on the copper–nickel side was larger than that of the stainless steel side. The stirring phenomena during friction-stir welding eliminated annealing twins in the stainless steel base metal and a uniform microstructure with small equiaxed grains formed in the stir zone. Tensile strength and elongation of joint were 84% and 65% of the corresponding values, respectively in the copper–nickel base metal. The fracture surface indicated brittle cleavage and plastic deformation behaviors.(3) Heat and plastic deformation caused element diffu-sion at copper- and iron-rich layers in the stir zone. Nickel and copper, as austenite stabilizers, led to the formation of austenite phase in the iron-rich layers. Chrome and carbon were transferred to grain boundaries, which were high-energy zones, and formed chrome carbide. The layer-by-layer structure and precipitation at the interface made the hardness profile non-uniform and formed possible stress concentra-tion zones.AcknowledgementThe author acknowledges the funding support of Babol Noshirvani University of Technology (No. BNUT/370167/97).References[1] M. Metikoš-Hukovi ć, R. Babi ć, I. Škugor, and Z. Gruba č,Copper-nickel alloys modified with thin surface films: Corro-sion behaviour in the presence of chloride ions, Corros. Sci., 53(2011), No. 1, p. 347.[2] M. Metikoš-Hukovi ć, R. Babi ć, I. Škugor Ron čevi ć, and Z.Gruba č, Corrosion resistance of copper–nickel alloy under fluid jet impingement, Desalination , 276(2011), No. 1-3, p. 228.[3] P. Carol, Corrosion and biofouling resistance evaluation of90-10 copper–nickel, Copper Development Association ,H. Jamshidi Aval, Microstructural evolution and mechanical properties of friction stir-welded C71000 copper–nickel (1303)2005, No. 63, p. 8.[4] S.G. Shiri, M. Nazarzadeh, M. Shariftabar, and M.S. Afarani,Gas tungsten arc welding of CP-copper to 304 stainless steel using different filler materials, Trans. Nonferrous Met. Soc.China, 22(2012), No. 12, p. 2937.[5] C.W. Yao, B.S. Xu, X.C. Zhang, J. Huang, J. Fu, and Y.X.Wu, Interface microstructure and mechanical properties of laser welding copper-steel dissimilar joint, Opt. Lasers Eng., 47(2009), No. 7-8, p. 807.[6] I. Magnabosco, P. Ferro, F. Bonollo, and L. Arnberg, An in-vestigation of fusion zone microstructures in electron beam welding of copper-stainless steel, Mater. Sci. Eng. A, 424(2006), No. 1-2, p. 163.[7] T.A. May and A.C. Spowage, Characterisation of dissimilarjoints in laser welding of steel–kovar, copper–steel and cop-per–aluminium, Mater. Sci. Eng. A, 374(2004), No. 1-2, p.224.[8] C. Roy, V.V. Pavanan, G. Vishnu, and P.R. Hari, M. Ariva-rasu, M. Manikandan, D. Ramkumar, and N. Arivazhagan, Characterization of metallurgical and mechanical properties of commercially pure copper and AISI 304 dissimilar weld-ments, Procedia Mater. Sci., 5(2014), p. 2503.[9] M. Velu and S. Bhat, Metallurgical and mechanical examina-tions of steel–copper joints arc welded using bronze and nickel-base superalloy filler materials, Mater. Des., 47(2013), p. 793.[10] Y. Imani, M.K. Besharati, and M. Guillot, Improving frictionstir welding between copper and 304L stainless steel, Adv.Mater. Res., 409(2012), p. 263.[11] A.J. Ramirez, D.M. Benati, and H.C. Fals, Effect of tool off-set on dissimilar Cu–AISI 316 stainless steel friction stir welding, [in] Proceeding of the Twenty-first International Offshore and Polar Engineering Conference, Maui, Hawaii, USA, 2011, p. 548.[12] A. Najafkhani, K. Zangeneh-Madar, and H. Abbaszadeh,Evaluation of microstructure and mechanical properties of friction stir welded copper/316L stainless steel dissimilarmetals, Int. J. ISSI, 7(2010), No. 2, p. 21.[13] M. Shamsujjoha, B.K. Jasthi, M. West, and C. Widener, Mi-crostructure and mechanical properties of FSW lap joint be-tween pure copper and 1018 mild steel using refractory metal pin tools, [in] Friction Stir Welding and Processing VII,TMS, San Antonio, Texas, 2013, p. 151.[14] M. Jafari, M. Abbasi, D. Poursina, A. Gheysarian, and B.Bagheri, Microstructures and mechanical properties of fric-tion stir welded dissimilar steel–copper joints, J. Mech. Sci.Technol., 31(2017), No. 3, p. 1135.[15] Copper Development Association Inc., Copper–NickelWelding and Fabrication, Copper Development Association Inc., McLean, Virginia [2013-02-01]. / applications/marine/cuni/fabrication/welding_and_fabrication.html[16] Smiths Metal Centres, 304/304L Stainless Steel Data Sheet,Smiths Metal Centres, Clerkenwell, London [2007-03-05]./datasheets.htm.[17] S.H.C. Park, Y.S. Sato, H. Kokawa, K. Okamoto, S. Hirano,and M. Inagaki, Rapid formation of the sigma phase in 304 stainless steel during friction stir welding, Scripta Mater.,49(2003), No. 12, p. 1175.[18] Y.V.R.K. Prasad, K.P. Rao, and S. Sasidhara, Hot WorkingGuide: A Compendium of Processing Maps, ASM Interna-tional, Materials Park, Ohio, 2015, p. 168.[19] Y. Sun and H. Fujii, Effect of abnormal grain growth on mi-crostructure and mechanical properties of friction stir welded SPCC steel plates, Mater. Sci. Eng. A, 694(2017), p. 81. [20] H. Jamshidi Aval, Influences of pin profile on the mechanicaland microstructural behaviors in dissimilar friction stir welded AA6082–AA7075 butt joint, Mater. Des., 67(2015), p. 413.[21] N. Kumar, R.S. Mishra, and W. Yuan, Friction Stir Weldingof Dissimilar Alloys and Materials, Butterworth-Heinemann, Oxford, 2015, p. 16.[22] J.C. Lippold, Welding Metallurgy and Weldability, John Wi-ley & Sons, Hoboken, New Jersey, 2014, p. 9.。
Interfacial microstructure and mechanical properties of

Interfacial microstructure and mechanical properties of aluminium –zinc-coated steel joints made by a modifiedmetal inert gas welding –brazing processH.T.Zhang a,⁎,J.C.Feng a ,P.He a ,H.Hackl baState Key Laboratory of Advanced Welding Production Technology,Harbin Institute of Technology,Harbin 150001,Heilongjiang Province,PR ChinabFronius.Internation GMBH,A4600Wels-Thalheim,AustriaReceived 10May 2006;accepted 4July 2006AbstractThe microstructure and properties of aluminium –zinc coated steel lap joints made by a modified metal inert gas CMT welding –brazing process was investigated.It was found that the nature and the thickness of the high-hardness intermetallic compound layer which formed at the interface between the steel and the weld metal during the welding process varied with the heat inputs.From the results of tensile tests,the welding process is shown to be capable of providing sound aluminium –zinc coated steel joints.©2006Elsevier Inc.All rights reserved.Keywords:Welding –brazing;Heat input;Intermetallic compound1.IntroductionIn order to reduce pollution and save energy,it is attractive to make car bodies lighter by introducing some aluminium parts as substitutes for the previous steel structures [1,2].Therefore,joining aluminium to steel has become a major problem,requiring resolution.Direct solid-state joining can be used to make these dissimilar metal joints by controlling the thickness of the interme-tallic compound layer that develops within a few micrometers of the joint interface [3–9].However,the shape and size of such solid-state joints are extremely restricted.Thus,the joining of aluminium to steel byfusion welding methods has been widely studied.As is well known,the joining of aluminium to steel by fusion welding is difficult because of the formation of brittle interface phases which can deteriorate the mechanical properties of the joints.However,Kreimeyer and Sepold [10]have shown that if the layer is less than 10μm thick,the joint will be mechanically sound.In addition,the authors also deem that the existence of a zinc coating increases the wettability of the Al to the steel substrate.As another approach,Achar et al.[11]reported that the thickness of the intermetallic compound layer formed during TIG arc welding of Al to steel is decreased by the use of an Al alloy filler metal containing Si.Murakami et al.[12]and Mathieu et al.[13]both point out that the temperature probably determines the thickness of the intermetallic compound layer of the joint and recom-mended the use of lower heat input to obtain a sound joint.Materials Characterization 58(2007)588–592⁎Corresponding author.Tel.:+8645186412974;fax:+8645186418146.E-mail address:hitzht@ (H.T.Zhang).1044-5803/$-see front matter ©2006Elsevier Inc.All rights reserved.doi:10.1016/j.matchar.2006.07.008The cold metal transfer process,identified here as CMT,is a modified metal inert gas welding process which invented by the Fronius Company.The principal innovation of this method is that the motions of the welding wire have been integrated into the welding process and into the overall control of the process.Every time the short circuit occurs,the digital process-control both interrupts the power supply and controls the re-traction of the wire.The wire retraction motion assists droplet detachment during the short circuit,thus greatlydecreasing the heat input during welding.In this study,we selected the CMT process to join aluminium to zinc-coated steel using a lap geometry. The main purpose of this effort was to reveal the rela-tionship between heat input and the microstructure of the joint.Hardness testing was also used to characterize the phases formed during the welding process.In ad-dition,the quality of the joints was assessed by tensile testing.2.ExperimentalDeep drawn sheets of hot-dip galvanized steel and sheets of pure Al1060with thickness of1mm were used in the welding experiments.An Al sheet was lapped over a Zn-coated steel sheet on the special clamping fixture, and the ending of the weld wire was aimed at the edge of the aluminium sheet,as shown in Fig.1.The MIG welding–brazing was carried out using the CMTwelding source with an expert system and1.2-mm-diameter Al–Si filler metal wire.Argon was used as the shielding gas at a flow rate of15L/min.The surface of the samples was cleaned by acetone before welding.Two sets of welding parameters of different heat inputs were selected,as shown in Table1.The heat input,J,is calculated using the equation:J=(60×UI)/v,where U is the mean welding voltage,I is the mean welding current and v is the welding speed.Typical transverse sections of the samples were observed using optical microscopy(OM)and scanning electron microscopy(SEM).The composition of the intermetallic compound layer at the interface between the steel and the weld metal was determined by energy dispersive X-ray spectroscopy(EDX).Hardness values were obtained using a microindentation hardness tester with a load of10g,and a load time of10s.In addition, the samples were cut in10mm widths,and transverse tensile tests(perpendicular to the welding direction) were used to measure the joint tensilestrength.Fig.1.Schematic plan of the welding process.Table1The welding parametersSamplenumberMeanweldingcurrent(A)Meanweldingvoltage(V)Wire feedrate(m/min)Weldingspeed(mm/min)Weldheatinput(J/cm)Sample A6611.8 3.9762613.2Sample B11013.3 5.4913961.5Fig.2.Front(upper)and back(lower)appearances of typical jointswith different heat inputs:(a)Sample A;(b)Sample B.589H.T.Zhang et al./Materials Characterization58(2007)588–5923.Results and discussion 3.1.Macro-and microstructuresThe appearance of the weld seams for different heat inputs are shown in Fig.2.For all welding cases,a smooth weld seam was made.The molten metal wetted the steel better when using lower heat input,i.e.,compare Sample A at lower heat input to Sample B.This may be related to the different degree of evapo-ration of the zinc coating at different heat inputs.While improving the heat input,the greater evaporation of zinc reduces the wettability of the molten metal on the steel.Fig.3shows a typical cross-section of the joints.Higher heat input (Sample B)resulted in a decrease in the contact angle between the steel and the weld metal.Meanwhile,a special zone with lighter colour at the toe of the weldments can be found (designated by white arrows in Fig.3).Optical micrographs shows that a visible intermetallic compound layer has formed be-tween the steel and weld metal during the welding process,Fig.4.The thickness of the intermetallic com-pound layer changes not only with the location within a given joint but also with the varying heat input between different joints.The thickness of the intermetallic compound layer in the center is greater than at the edge of the seam within one joint.For Sample A,the maximum thickness of the compound layer is about 10μm but is 40–50μm for Sample B.The microstructure of the intermetallic compound is shown in greater detail in the SEM micrographs inFig.5.At lower heat input (Sample A),the inter-metallic compound presents a serrated shape oriented toward the weld metal.When the heat input was increased (Sample B),the compound layer became much thicker and grew into the weld metal with tongue-like penetrations.Anisotropic diffusion is a possible explanation for this irregularity.The intermetallic compounds that form under these conditions generally have an orthorhombic structure (see below).Because of the high vacancy concentration along the c -axis of the orthorhombic structure,Al atoms can diffuse rapidly in this direction and cause rapid growth of the inter-metallic compound.EDX analysis was used to determine the phases of the intermetallic compound layer.The results show that the intermetallic compound layer of the joint made by lower heat input consists entirely of Fe 2Al 5.But when the heat input is increased,the intermetallic compound layer consists of two different phases,the FeAl 2phase near the steel surface and a FeAl 3phase which penetrates toward the weld metal.Thus it is clearthatFig.4.Optical microstructures of interface between steel and weld metal:(a)Sample A;(b)SampleB.Fig.3.Cross-section image at limit of penetration in the joint,showing change in contact angle with increased heat input.Arrows point to an intermetallic compound at the tip of the weld metal:(a)Sample A;(b)Sample B.590H.T.Zhang et al./Materials Characterization 58(2007)588–592the intermetallic compound layer that forms is closely related to the heat input during the welding process.With regard to the special zone designated by white arrows in Fig.3,dendritic-appearing structures can be distinguished on a high-magnification SEM micrograph (Fig.6).EDX analysis results show that such dendrite-shaped crystals of an Al-richα-solid solution containing residual zinc routinely formed at this location.3.2.Hardness measurementsHardness testing results also confirm the presence of a hard intermetallic compound layer.The hardness of the interface layer is much higher than that of the base metal and the weld metal and is found to vary for the corresponding intermetallic compound phases.For the high heat input weld(Sample B)the hardness is much higher,Fig.7.Fig.8.The location where the fracture occurred during tensile testing (designated by white arrows):(a)Sample A;(b)SampleB.Fig.7.Microindentation hardness test results of the joints made using different heatinputs.Fig.6.Dendrite crystal structure at the toe of the weldment(SampleB).Fig.5.SEM micrograph of interface between steel and weld metal:(a)Sample A;(b)Sample B.591H.T.Zhang et al./Materials Characterization58(2007)588–5923.3.Tensile test resultsThe tensile tests were performed to provide a qualitative measure of the joint strength and behavior. These results show that the bond strength is excellent, with the fractures occurring in the HAZ of the Al even when the thickness of the intermetallic compound layer was greater than40μm,Fig.8.From a general view-point,the thickness of the intermetallic compound layer should be controlled to less than10μm in order to obtain a sound joint.This implies that the joint made with higher heat input should have a lower intrinsic strength than the other because of the thicker brittle intermetallic compound layer.However,the intrinsic strength of the joints cannot be determined when the fracture occurs in the HAZ of the pure Al.Nevertheless, according to the thickness of the compound layer,we can presume that the intrinsic strength of the joints should be decreased when increasing the welding heat input.4.ConclusionsBased on the experimental results and discussions, conclusions are drawn as follows1)Dissimilar metal joining of Al to zinc-coated steelsheet without cracking is possible by means of a modified metal inert gas(CMT)welding–brazing process in a lap joint.2)Fe–Al intermetallic compound phases were formedat the interface between the steel and the weld metal.The thickness and the composition of the interme-tallic compound layer varied with weld heat input.3)Despite the formation of the intermetallic compoundphases,the interface between steel and weld metal is not the weakest location of the joints.Tensile tests of the joints caused fractured in the Al HAZ,even when the intermetallic compound layer thickness exceeded 40μm.AcknowledgementsThe authors wish to acknowledge the financial support provided by the National Natural Science Foundation under Grant No.50325517for this work. References[1]Schubert E,Klassen M,Zerner I,Walz C,Sepold G.Light weightstructures produced by laser beam joining for future applications in automobile and aerospace industry.J Mater Process Technol 2001;115:2.[2]Schubert E,Zernet I,Sepold ser beam joining of materialcombinations for automotive applications.Proc SPIE 1997;3097:212.[3]Oikawa H,Ohmiya S,Yoshimura T.Resistance spot welding ofsteel and aluminium sheet using insert metal sheet.Sci Technol Weld Join1999;2:80.[4]Czechowski M.Stress corrosion cracking of explosion weldedsteel–aluminum joints.Mater Corros2004;6:464.[5]Fukumoto S,Tsubakino H.Friction welding process of5052aluminium alloy to304stainless steel.Mater Sci Technol 1999;9:1080.[6]Ochi H,Ogawa K,Suga Y,Iwamoto T,Yamamoto Y.Frictionwelding of aluminum alloy and steel using insert metals.Keikinzoku Yosetsu1994;11:1.[7]Shinoda T,Miyahara K,Ogawa M,Endo S.Friction welding ofaluminium and plain low carbon steel.Weld Int(UK) 2001;6:438.[8]Uzun H,Donne CD.Friction stir welding of dissimilar Al6013-T4to X5CrNi18-10stainless steel.Mater Des2005;1:41. [9]Adler L,Billy M,Quentin G.Evaluation of friction-weldedaluminum-steel bonds using dispersive guided modes of a layered substrate.J Appl Phys2001;12:6072.[10]Kreimeyer M,Sepold ser steel joined aluminium-hybridstructures.Proceedings of ICALEO'02,Jacksonville,USA;2002.[11]Achar DRG,Ruge J,Sundaresan S.Joining aluminum to steel,with particular reference to welding(III).Aluminum1980;4:291.[12]Murakami T,Nakata K.Dissimilar metal joining of aluminum tosteel by MIG arc brazing using flux cored wire.ISIJ Int 2003;10:1596.[13]Mathieu A,Mattei S,Deschamps A.Temperature control in laserbrazing of a steel/aluminium assembly using thermographic measurements.NDT&E Int2006;39:272.592H.T.Zhang et al./Materials Characterization58(2007)588–592。
Effect of low temperature thermo-mechanical treatment on microstructure and mechanical properties
J. Cent. South Univ. Technol. (2010) 17: 443−448DOI: 10.1007/s11771−010−0504−6Effect of low temperature thermo-mechanical treatment onmicrostructures and mechanical properties of TC4 alloySUN Li-ping(孙利平)1, LIN Gao-yong(林高用)1,2, LIU Jian(刘健)1, ZENG Ju-hua(曾菊花)11. School of Materials Science and Engineering, Central South University, Changsha 410083, China;2. Key Laboratory of Nonferrous Metal Materials Science and Engineering, Ministry of Education,Central South University, Changsha 410083, China© Central South University Press and Springer-Verlag Berlin Heidelberg 2010Abstract: The effects of low temperature thermo-mechanical treatment (LTTMT) on microstructures and mechanical properties of Ti-6Al-4V (TC4) alloy were studied by optical microscopy (OM), tensile test, scanning electron microscopy (SEM) and transmission electron microscopy (TEM). The experimental results confirm that the strength of TC4 alloy can be improved obviously by LTTMT processing, which combines strain strengthening with aging strengthening. The effect of LTTMT on the alloy depends on the microstructure of the refined and dispersed α+β phase on the basis of high dislocation density by pre-deformation below recrystallization temperature. The tensile strength decreases with the increase of pre-deformation reduction. The optimal processing parameters of LTTMT for TC4 alloy are as follows: solution treatment at 900 ℃ for 15 min, pre-deformation in the range of 600−700 ℃ with a reduction of 35%, finally aging at 540 ℃ for 4 h followed by air-cooling.Key words: Ti-6Al-4V (TC4) alloy; low temperature thermo-mechanical treatment; microstructure; mechanical properties; strain strengthening1 IntroductionTC4 alloy is one of the typical (α+β) Ti alloys. Since Ti-6Al-4V was first applied in 1954, it has become the most important Ti alloy and has been widely used around the world nowadays, for the products of TC4 alloy account for about 60% of all Ti output [1]. Although the alloy has been used for a number of years, researches on this alloy still attract much attention of researchers from both fundamental and practical point of view, such as superplastic forming and diffusion bonding (SPF/DB) technology [2−3], numerical simulation on forging process [4], stress relaxation behavior [5], surface engineering technologies [6−8], constitutive relationship [9−10], fatigue crack growth behavior [11−12], hydrogen treatment [13], and high temperature thermo-mechanical treatment (HTTMT) technology [14]. However, the study of low temperature thermo- mechanical treatment (LTTMT) on TC4 alloy has not been performed, which may be an effective way for strengthening this alloy. In this work, the influences of LTTMT on microstructures and mechanical properties of TC4 alloy were investigated, aiming to find a more effective technology for improving the properties of this alloy.2 ExperimentalThe testing materials used were 1.7 mm-thick hot-rolled TC4 sheets. The finish hot-rolling temperature was 900 ℃. The process flow of LTTMT is illustrated in Fig.1, which includes three stages as follows: solution treatment and quenching, pre-deformation, and aging. The processing parameters of LTTMT were set as follows: solution treatment at 900 ℃ for 15 min, followed by quenching in room-temperature water; pre-deformation in the range of 600−700 ℃, with the pre-deformation reductions of 35%, 50%, and 55%, respectively; aging treatment at 540 ℃ in air for 4 h followed by air-cooling. Besides, the artificial aging before pre-deformation was conducted at 540 ℃ for 2 h, and the natural aging was carried out at the room temperature for 6 d. For the sake of comparing the mechanical property and microstructure at every stage of LTTMT, serial routes are set and shown in Table 1.The microstructure observation was performed using POLYV AR−METⅡ metallographic microscope. Specimens for optical microscopy (OM) were etched bya solution of nitric acid (30 mL)+hydrofluoric acid(20 mL)+H2O (50 mL). Tensile tests were performed on aFoundation item: Project(2008WK2005) supported by the Science and Technology Plan of Hunan Province, ChinaReceived date: 2009−06−25; Accepted date: 2009−08−29Corresponding author: LIN Gao-yong, PhD, Professor; Tel: +86−731−88830266; Fax: +86−731−88876692; E-mail: mater218@Fig.1 Schematic illustration of LTTMT: 1—Heating; 2—Solution treatment; 3—Water cooling; 4—Pre-deformation; 5—Aging; Tβ—Transition temperature of β phase; T r—Temperature of recrystallizationTable 1 Routes of different samplesSample No. Route Processflow1 H Hot-rollingstate 2 S Solutiontreatment 3 SA Solutiontreatment→Artificial aging4 SD1ASolution treatment→Pre-deformation(35%)→Artificial aging5 SD2ASolution treatment→Pre-deformation(50%)→Artificial aging6 SD3ASolution treatment→Pre-deformation(55%)→Artificial aging7 SAD2ASolution treatment→Artificial aging→Pre-deformation(50%)→Artificial aging8 SND2ASolution treatment→Natural aging→Pre-deformation(50%)→Artificial aging9 SD0Solution treatment→Room temperature pre-deformation(40%)CSS−44100 universal electronic tensile test machine. Additionally, the fracture cross-sections of TC4 samples by tensile test were analyzed by scanning electron microscopy (SEM), using KYKY−Amray 2800 in this work. The TEM investigations were carried out on an H−800 transmission electron microscope to observe the sub-structure in TC4 alloy at different stages of the LTTMT.3 Results and discussion3.1 Mechanical propertiesThe measuring values of mechanical properties (tensile strength σb, yield strength σ0.2, and elongation δ) of TC4 alloy processed by LTTMT and other comparing routes are obtained and compiled in Table 2.Comparing mechanical properties of TC4 alloy prepared by SA, SD1A, SD2A and SD3A routes, it is evident that the strength and the plasticity of TC4 alloy Table 2 Mechanical properties of TC4 alloy after treated by LTTMT and other routesSample No.Route σb/MPa σ0.2/MPa δ/%1 H 883.82835.487.622 S 890.14802.907.183 SA 942.34851.91 2.634 SD1A 1 165.64 1 091.94 3.005 SD2A 1076.29 946.55 3.606 SD3 A 1 022.40 938.78 4.007 SAD2A 1 072.76 1 024.93 4.208 SND2A896.08 816.59 4.209 SD0 748.78 666.27 1.00can be improved obviously by LTTMT processing. Pre-deformation reduction influences mechanical properties of TC4 alloy acutely. The tensile strength decreases with the increase of pre-deformation reduction, which is opposite to the variation of HTTMT [14]. And itis remarkable that the plasticity of TC4 alloy rises slightly with the increase of pre-deformation reduction from 35% to 55% in the process of LTTMT.Comparing σb of SAD2A and SD2A routes, it can be found that there is little difference for σb (1 072.76 MPa and 1 076.29 MPa, respectively) of the two routes, indicating that the artificial aging before pre-deformationis not necessary. The tensile strength of TC4 alloy processed by SAD2A route differs a lot from that by SND2A route, which indicates that strengthening effectby artificial aging before pre-deformation is stronger than that by natural aging. Besides, the elongations of these two routes are the same (4.20%), indicating that the effects of natural aging and artificial aging before pre-deformation on plasticity of this alloy may be the same when the pre-deformation reductions are both 50%.The lowest tensile strength σb (748.78 MPa) and the lowest elongation δ (1.00%) occur in the route of SD0. Itis evident that room-temperature rolling after solution treatment is not an effective way for improving the properties of TC4 alloy. From the data in Table 2, it can also be noticed that the value of σb is close to the value ofσ0.2 in every route, i.e., the yield ratio (σ0.2/σb) is high, which may result in difficulty in cold-deformation.3.2 Microstructural evolutionFig.2 shows the optical micrographs of hot-rolled, solution treated and aged TC4 alloy.As shown in Fig.2(a), the microstructure of TC4 alloy after hot-rolling is mainly equiaxed structure withthe prior α phase and transformed β phase. During hot- rolling carried out at 900℃, above the recrystallization temperature (T r), the recrystallization and deformation occur simultaneously. In the sequent air-cooling, β phaseFig.2 Optical micrographs of TC4 alloy by different procedures: (a) Hot rolling; (b) Solution treatment; (c) Solution treatment+ agingwill transform to secondary α phase, which nucleates in βgrains or the grain boundary of prior α phase [1].The microstructure of TC4 alloy upon solution treatment followed by water-quenching is shown in Fig.2(b). From the image, it can be found that the high cooling rate after solution treatment in α+β phase field results in martensite transformation, for acicular α′ phase can be recognized in Fig.2(b). Besides, it can also be found that there exist small amounts of prior α phase and untransformed β phase. Because the martensite in Ti alloy cannot improve the strength as the martensite does in steel, the strengthening efficiency in TC4 alloy is low [1], resulting in that the strength of state S is a little higher than that of state H shown in Table 2.The microstructure of specimen after solution treatment and aging at 540 ℃ for 4 h is shown in Fig.2(c). It can be seen from Fig.2(c) that the microstructure of TC4 alloy is mainly composed of the modified and dispersed α+β phase indicating that artificial aging following solution treatment is a good way to improve the mechanical properties of TC4 alloyas shown in Table 2. In the process of decomposition of α′ phase, α phase, which has a hexagonal lattice with the parameter comparable with α′ phase, may precipitate first, along with the increase of the β-stabilized element content, resulting in that the rest meta-stable phase is reconstructed into β crystal lattice, shown as follows: α′→α′+α→α+β.TEM image of the specimen after solution treatment and pre-deformation (Fig.3(a)) shows the microstructure modified by pre-deformation. This reveals that the grain boundary regions have higher defect density than the grain interior due to the dislocation accumulation alongthe grain boundaries during rolling. It may also be seenin this image that the grains contain the substructure. Asthe density of dislocation increases, the dislocations will pile up in localized areas and tangle with each other, leading to the inhomogenous distribution. Based on the increase of dislocations and their motion, cellular structure will occur in the grains. It is known that the density inside the cellular structure is much lower than that near the cellular wall. The substructure in grains makes the strength of TC4 alloy slightly increased.Fig.3 TEM images of TC4 alloy by different procedures: (a) Solution treatment+pre-deformation (35%); (b) Solution treatment+pre-deformation (35%)+agingOn the basis of the pre-deformation, the aging was carried out in order to modify the microstructure and consequently improve the mechanical properties. It is shown in Fig.3(b) that after aging treatment the structureis relatively regular, and the density of dislocation decreases in the heating process. According to the formerobservation (Fig.3(a)), the dislocations accumulate and tangle with each other, leading to the distortion energy storing in the material, which should be released during heating. Meanwhile, the decomposition of meta-stable phase will occur under the influence of the normalization of sub-grains. Being different from the aging without pre-deformation, the decomposition and the dislocation reaction influence each other in this alloy, which leads to the aging strengthening and the strain strengthening.As shown in Fig.4, the microstructures of TC4 alloy by procedures of SD1A, SD2A and SD3A are mainly refined and dispersed α+β phases. Comparing the micrographs in Figs.4(a) and (b), it can be found that the size of α particles (light phase) increases with the increase of pre-deformation reduction. Additionally, the particles are in the similar size when the pre-deformation reduction is in a small discrepancy, shown in Figs.4(b) and (c). Comparing the microstructures of SA, SD1A, SD2A and SD3A routes, it is evident that the particles of TC4 alloy become smaller and more dispersive byFig.4 Optical micrographs of TC4 alloy by different procedures: (a) Solution treatment+pre-deformation(35%)+aging; (b) Solution treatment+pre-deformation(50%)+aging; (c) Solution treatment+pre-deformation(55%)+aging LTTMT technology.In general, the strength will be enhanced with the increase of pre-deformation reduction, which can be proved in the study of HTTMT on TC4 alloy. However, the inverse law is obtained in this work that the tensile strength decreases with the increase of pre-deformation reduction.There may be two mechanisms for the explanation to this phenomenon. One possible mechanism may be that during the pre-deformation before artificial aging, the density of dislocation in the alloy increases with the increase of pre-deformation reduction, leading to the serious distortion of crystal lattice. On the other hand, the distortion of crystal lattice is a form of inner energy in the alloy. Thus, the inner distortion energy increases with the increase of pre-deformation reduction, inducing that the phases decomposed in the aging treatment agglomerate and grow into larger size, which results in the lower efficiency of strengthening. Additionally, the crystal lattices of decomposition phase may be different transitional crystal lattices based on different pre-deformation reductions, which may influence the effect of hardening.Another possible mechanism may be that during the heating of aging treatment, the recovery and polygoniza- tion occur along with the phase transformation, which weakens the effect of strain strengthening provided by pre-deformation. The phases decomposed during the aging will influence the polygonization, and on the other hand, the polygonization will change the density and the diffusion form of the decomposed phases (Fig.3(b)). As the pre-deformation reduction increases, the influence of recovery and polygonization on the diffusion decomposition phases will become greater during aging, which may be one reason for the lower hardening.From the above explanations, it seems that the mechanisms of the pre-deformation reduction on the strength of TC4 alloy during LTTMT should be further studied.From Table 2, it can be noted that the values of elongation (δ) of S and SD1A routes differ a lot (from 7.18% to 3.00%), indicating that the plasticity of TC4 alloy upon LTTMT is lower than that upon solution treatment, which may be identified in Fig.5. Besides, it is suggested that the structure of continuous β phase with diffusive α phase can represent large brittleness, which may be the possible reason for the lower plasticity by LTTMT [15].Comparing the morphologies of dimples in Figs.5(a) and (b), it can be found that the dimples in Fig.5(a) are more uniform and deeper than those in Fig.5(b). Besides, the size of dimples in Fig.5(a) is larger than that in Fig.5(b). Generally, the plasticity will be better when the size of dimples is larger and the rupture condition of theJ. Cent. South Univ. Technol. (2010) 17: 443−448447Fig.5 SEM images of tensile fractures of TC4 alloy by different procedures: (a) Solution treatment; (b) Solution treatment+ pre-deformation(35%)+aging; (c) Higher magnification of Fig.5(a); (d) Higher magnification of Fig.5(b)material is the same. Therefore, the plasticity of TC4 alloy upon LTTMT is lower than that upon solution treatment, consisting with the results in Table 2.According to the observation in Fig.2(b), the structure after solution treatment may primarily contain hexagonal α′ martensite and small amount of prior α phase along the grain boundary. It may be considered that the particles in Fig.5(c) exist in the form of prior α phase, and those in Fig.5(d) exist in the form of diffusion α phase. It can also be observed that there are dimples with different sizes in Fig.5(d). The reason for this phenomenon may depend on the particles with different sizes [16]. The micro-cavities form in the nucleation site of larger particles at first, and then other micro-cavities form in the smaller particles. Finally, different micro-cavities couple with each other, forming dimples with different sizes. In this work, it may be predicted that the phase decomposes from the meta-phase and grows to different sizes.4 Conclusions(1) The strength of TC4 alloy can be improved obviously by the process of LTTMT, which combines the strain strengthening with aging strengthening. And the optimal processing parameters of LTTMT for TC4 alloy are: solution treatment at 900 ℃ for 15 min, pre- deformation in the range of 600−700 ℃ with a reduction of 35%, finally aging at 540 ℃ for 4 h followed byair-cooling.(2) The tensile strength decreases with the increase of pre-deformation reduction, which can be explained by two mechanisms proposed in this work. Besides, the plasticity rises slightly with the increase of pre-deformation reduction.(3) The effect of LTTMT on the alloy depends on the microstructure of refined and dispersed α+β phase on the basis of high dislocation density by pre-deformation below recrystallization temperature.(4) The room temperature deformation is not an effective way to improve the properties of TC4 alloy, for the tensile strength, yield strength and elongation are all the lowest values in all routes.(5) There is little difference between normal LTTMT and complex LTTMT (including pre-artificial or pre-natural aging before pre-deformation), indicating that the aging before pre-deformation may not be needed.References[1]ZHANG Xi-yan, ZHAO Yong-qing, BAI Chen-guang. Titanium alloy and its application [M]. Beijing: Chemical Industry Press, 2005: 287−305. (in Chinese)[2]HAN Wen-bo, ZHANG Kai-feng, WANG Guo-feng. Superplastic forming and diffusion bonding for honeycomb structure of Ti-6Al-4V alloy [J]. Journal of Materials Processing Technology, 2007, 183(2/3): 450−454.[3]LEE H S, YOON J H, CHAN H P, YOUNG G K, DONG H S, LEE C S. A study on diffusion bonding of superplastic Ti-6Al-4V ELI grade [J]. Journal of Materials Processing Technology, 2007, 187/188:J. Cent. South Univ. Technol. (2010) 17: 443−448 448526−529.[4] LU Cheng, ZHANG Li-wen. Numerical simulation on forgingprocess of TC4 alloy mounting parts [J]. Transactions of NonferrousMetals Society of China, 2006, 16(6): 1386−1390.[5] HYUKJAE L, SHANKAR M. Stress relaxation behavior ofshot-peened Ti-6Al-4V under fretting fatigue at elevated temperature[J]. Materials Science and Engineering A, 2004, 366(2): 412−420. [6] LIU Yong, YANG De-zhuang, WU Wan-liang, YANG Shi-qin. Drysliding wear behavior of Ti-6Al-4V alloy in air [J]. Journal of HarbinInstitute of Technology: English Letter, 2002, 9(1): 67−71.[7] LIU Y, YANG D Z, HE S Y, WU W L. Microstructure developed inthe surface layer of Ti-6Al-4V alloy after sliding wear in vacuum [J].Materials Characterization, 2003, 50(4/5): 275−279.[8] BISWAS A, DUTTA M J. Surface characterization and mechanicalproperty evaluation of thermally oxidized Ti-6Al-4V [J]. MaterialsCharacterization, 2009, 60(6): 513−518.[9] NIE Lei, LI Fu-guo, FANG Yong. New constitution relationship forTC4 alloy [J]. Aeronautical Materials Transaction, 2001, 21(3):13−18.(in Chinese)[10] LI L X, PENG D S. Development of constitute equations forTi-6Al-4V alloy under hot-working condition [J]. Acta MetallurgicaSinica: English Letter, 2000, 13(1): 263−269.[11] SHADEMAN S, SOBOVEJO W O. An investigation of short fatiguecrack growth in Ti-6Al-4V with colony microstructures [J].Materials Science and Engineering A, 2002, 335(1/2): 116−127. [12] SINHA V, MERCER C, SOBOYEJO W O. An investigation of shortand long fatigue crack growth behavior of Ti-6Al-4V [J]. MaterialScience and Engineering A, 2000, 287(1): 30−42.[13] LUO Liang-shun, SU Yan-qing, GUO Jing-jie, FU Heng-zhi.Formation of titanium hydride in Ti-6Al-4V alloy [J]. Journal of Alloys and Compounds, 2006, 425(1/2): 140−144.[14] HUANG Hui. Effect of high temperature thermo-mechanicaltreatment (HTTMT) on the structure and properties of TC4 alloy [J].Optic and Precision Engineering, 1996, 4(4): 48−52. (in Chinese) [15] KUBIAK K, SIENIAWSKI J. Development of the microstructureand fatigue strength of two phase titanium alloys in the processes offorging and heat treatment [J]. Journal of Materials Processing Technology, 1998, 78(1/3): 117−121.[16] CUI Niu-xian. Fracture analysis of metals [M]. Harbin: HarbinInstitute of Technology Press, 1998: 34−45. (in Chinese)(Edited by CHEN Wei-ping)。
Microstructure and mechanical properties
Microstructure and mechanical properties of ZrB 2–SiC nanocomposite ceramicQiang Liu,*Wenbo Han and Ping HuCenter for Composite Materials,Harbin Institute of Technology,Harbin 150001,ChinaReceived 28March 2009;accepted 30May 2009Available online 6June 2009A ZrB 2–SiC nanocomposite ceramic in which 20vol.%nanosized SiC powder was introduced into a ZrB 2matrix was fabricated by hot-pressing at 1900°C for 60min under a 30MPa uniaxed load.The composite microstructure showed intragranular nanostruc-tures that were peculiar to this material.Investigation of the mechanical properties revealed a flexural strength of 930±28MPa and a fracture toughness of 6.5±0.3MPa m 1/2.These improved mechanical properties were strongly dependent on the formation of the unusual intragranular nanostructures.Ó2009Acta Materialia Inc.Published by Elsevier Ltd.All rights reserved.Keywords:Intragranular nanostructure;Mechanical properties;Microstructure;Fracture toughness;NanocompositeUltrahigh-temperature ceramics (UHTCs),suchas borides and carbides,were developed in the 1960s [1].Among UHTCs,zirconium diboride (ZrB 2)is a material of particular interest because of its excellent combination of high melting point,low theoretical den-sity,high electrical conductivity,good chemical inert-ness and superb wear resistance.These properties make it an attractive candidate for high-temperature applications such as refractory materials in foundries,electrical devices,nozzles and armor [2].Moreover,ZrB 2could be used for super-high-temperature struc-tural applications in aerospace [3,4].Its low mechanical properties,however,have long prevented this material from being used in a wide range of applications.Its sus-ceptibility to brittle fracture can lead to unexpected cat-astrophic failure,therefore its mechanical properties must be improved before the potential applications of ZrB 2can be fully realized.The introduction of a second phase of particles has been a successful strategy for improving the mechanical properties of monolithic diboride ceramics.With this aim,introduction of SiC particles [3–6]into ZrB 2yields a ZrB 2–SiC composite ceramic that is far stronger than monolithic ZrB 2.As a rule,however,improvement of mechanical properties is limited by the micro-sized par-ticles of the second phase.The mechanical properties of ceramics can be signif-icantly improved by introducing nanosized ceramic par-ticles into the ceramic-matrix grains or grain boundaries.The most significant achievements with this approach have been reported by Niihara and Nakahira [7–9],who first revealed that an introduction of 5vol.%of nanosized SiC particles into Al 2O 3increased the room-temperature strength of the composite from 350MPa to $1.0GPa (three-point flexure,30mm span).Similar improvements in strength have since been achieved in Al 2O 3–Si 3N 4,MgO–SiC and Si 3N 4–SiC composite systems.Materials constructed by these types of approaches are termed nanocomposite ceramics.At this point in time,however,there have been few attempts to create nanocomposite ceramics out of ZrB 2–SiC.Moreover,the effects of the composite micro-structure on the mechanical properties of ZrB 2–SiC nanocomposite ceramics have never been documented.Therefore,the aim of the present study was to investi-gate the microstructural features and effects on mechan-ical properties of a ZrB 2–SiC nanocomposite ceramic.The starting powders used in this study were:ZrB 2powder (Northwest Institute for Non-ferrous Metal Re-search,China),average particle size 2l m (>99%);and nanosized b -SiC powder (Kaier Nanotechnology Devel-opment Co.Ltd,China),average particle size 30nm (>98%).The nanosized SiC powder was first dispersed in ethanol,with 1h of ultrasonication.Then the powder mixture ZrB 2plus 20vol.%nanosized SiC particles were ball-milled using ZrO 2ball media and ethanol at1359-6462/$-see front matter Ó2009Acta Materialia Inc.Published by Elsevier Ltd.All rights reserved.doi:10.1016/j.scriptamat.2009.05.041*Corresponding author.Tel./fax:+8645186402382;e-mail:dqz0402@Available online at Scripta Materialia 61(2009)690–692/locate/scriptamat180rpm for 12h.All ball-milling was performed in polyethylene bottles.After mixing,the resulting slurry was dried by rotary evaporation and then screened.The obtained powder mixtures were hot-pressed at 1900°C for 60min at a uniaxial pressure of 30MPa in Ar atmosphere.The microstructure of hot-pressed specimens was ob-served by using scanning electron microscopy (SEM,FEI Sirion,Holland)and transmission electron micros-copy (TEM,Hitachi H-9000,Japan)with an X-ray en-ergy dispersive spectroscopy (EDS,EDAX Inc.)analyzer attachment.Flexural strength (r )was tested in three-point bending on 3Â4Â36mm bars,using a 30-mm span and a crosshead speed of 0.5mm min À1.Each specimen was ground and polished with diamond slurries to a 1-l m finish.The edges of all the specimens were chamfered to minimize the effect of stress concen-tration resulting from machining flaws.Fracture tough-ness (K IC )was evaluated by a single-edge notched-beam test with a 16-mm span and a crosshead speed of 0.05mm min À1using 2Â4Â22mm test bars on the same jig used for the flexural strength.All flexural bars were fabricated with the tensile surface perpendicular to the hot-pressing direction.A minimum of five specimens was tested in each experimental condition.Figure 1shows the typical microstructural morphol-ogies of the ZrB 2–SiC nanocomposite ceramic under SEM (Fig.1a)and TEM (Fig.1b).As shown in Figure 1a,a number of submicron SiC particles (dark contrast)are located along the grain boundaries of the ZrB 2(gray contrast).Some smaller SiC particles also appear inside the ZrB 2grains (indicated by arrows);these are termed intragranular nanostructures.Higher magnification examination of the ZrB 2–SiC nanocomposite ceramic by TEM (Fig.1b)showed that the intragranular SiC particles (indicated by arrows)were approximately 100nm in size.The formation of the intragranular nanostructures was dependent on both the migration speed of ZrB 2ma-trix grain boundary and the migration speed of the SiC second phase [10,11].When the migration speed of the second phase was less than that of the matrix grain boundary,the nanosized SiC particles tended to be trapped within the ZrB 2grains during sintering.The fine ZrB 2particles would then coalesce around them,form-ing the intragranular nanostructures.Figure 2shows that the specimen fracture surface used for testing fracture toughness exhibited the typicalcharacteristics of a transgranular fracture.In monolithic ZrB 2ceramic,the predominant fracture mode would have been intergranular [12].There are two possible interpretations for this difference in fracture mode.The first is that the intergranular SiC particles in the ZrB 2–SiC nanocomposite ceramic were firmly bonded to the ZrB 2/ZrB 2interfaces.This rigid bonding could then have suppressed intergranular fracture [13].The other explanation is that there are differences in relaxation of the tensile residual stress around the SiC particles located between the intergranular and intra-granular.Because of the different thermal expansion coefficients between SiC and ZrB 2,a large internal stress will be generated during cooling after sintering.Assum-ing that a SiC particle is spherical,an internal tension will occur in a tangential direction to the ZrB 2matrix around the SiC particle.This will cause a crack to al-ways propagate towards the SiC particle.The internal tangential tension also would be relaxed by lattice and grain-boundary diffusion around the intragranular and intergranular particles,respectively.However,the tem-perature at which the grain-boundary diffusion is acti-vated would be lower than that required by lattice diffusion,thus the internal tangential tension around the intergranular SiC particles would be further relaxed during cooling.As a result,the internal tangential ten-sion around the intragranular SiC particles of the sin-tered body would always be greater than that around the intergranular particles.This would lead to a fracture surface that would always tend to be characteristic of a transgranular fracture.Thus,it is the intragranular nanostructures that predominantly induce the trans-granular fracture characteristic of the ZrB 2–SiC nano-composite ceramic.Examination of the mechanical properties of the ZrB 2–SiC nanocomposite ceramic revealed a fracture toughness that ranged from 6.4to 6.7MPa m 1/2.This represented an increase of approximately 83%over that of the monolithic ZrB 2(2.3–3.5MPa m 1/2)[2].In addi-tion,the flexural strength (920–945MPa)of this nano-composite ceramic was also significantly higher than that recently reported for the monolithic ZrB 2($565MPa)[4].The formation of the intragranular nanostructures appeared to play an important role in the improved mechanical properties of the ZrB 2–SiC nanocomposite ceramic,especially its increased fracture toughness and flexural strength.In order to investigate effects of the intragranular nanostructures on the mechanical properties oftheFigure 1.Typical microstructural morphologies of the ZrB 2–SiC nanocomposite ceramic:(a)SEM image of the sample and (b)TEM image of thesample.Figure 2.SEM image of the fracture surface of the ZrB 2–SiC nanocomposite ceramic.Q.Liu et al./Scripta Materialia 61(2009)690–692691ZrB 2–SiC nanocomposite ceramic,it is necessary to investigate a crack propagation behavior in this mate-rial.Figure 3shows TEM micrographs of crack propa-gation behavior in the ZrB 2–SiC nanocomposite ceramic.It was evident that the crack had never propa-gated in a straight line,but had been deflected,selecting the neighboring particles (Fig.3a).As stated previously,this deflection was caused by thermal internal stress in this material.It can be also seen in Figure 3a that a crack has penetrated through an intragranular particle (indicated by black arrow).The possible reason for this case is that the cracked particle may be an agglomera-tion composed of many fine SiC particles.Because the bond strength of this agglomeration is not high enough,it tends to fracture when a crack meets this kind of par-ticle.However,for other intragranular particles (<100nm),neither crack penetration through the intra-granular particles nor propagation along the particle/matrix interfaces was evident (Fig.3b).This phenome-non indicates that the intragranular particles bridged the crack,pointing to the existence of a particle-bridging mechanism.Based on the experimental observation above,a spe-cific explanation for this effect is as follows.When a pri-mary crack meets an intragranular nanosized SiC particle,it is normally impeded and thus bows (Fig.3a).The bowing crack bypasses the impenetrable particles and instead interacts with neighboring cracks.At this point,the bridging particles firmly pin the cracks and further prevent the crack from extending.As a re-sult,only by increasing the crack extension force can the crack further extend.In other words,it is by means of the particle-bridging mechanism that the strength and toughness of the ZrB 2nanocomposite ceramic are signif-icantly improved.Besides the explanation mentioned above,there is an-other one for the improvement in strength.After the for-mation of the intragranular nanostructures,there are many sub-interfaces within the ZrB 2matrix grains that belong to the interfaces between intragranular particles and matrix grains.As stated previously,moreover,be-cause of the difference in thermal expansion coefficients between the ZrB 2matrix and the SiC second phase,a large number of microcracks were formed around the intragranular particles,as shown in Figure 4.The for-mation of the sub-interfaces and microcracks can cause the matrix grains to be at a potential differentiation state,corresponding to the further grain refining.Thisthen improves the strength of this material according to the Hall–Petch equation [10].As discussed above,it is concluded that the formation of intragranular nanostructure is the fundamental rea-son for the significant increase in the mechanical proper-ties of this nanocomposite ceramic.In conclusion,a hot-pressed ZrB 2–SiC nanocompos-ite ceramic was fabricated by introducing nanosized SiC powder into a ZrB 2matrix.the intragranular nanostruc-tures were peculiar to this ceramic-based composite and induced a transgranular fracture characteristic.The mechanical properties of this nanocomposite ceramic,especially its flexural strength and fracture toughness,were much higher than those of monolithic ZrB 2.It is believed that the formation of intragranular nanostructures is a main reason for the improvements in mechanical properties of the ZrB 2–SiC nanocompos-ite ceramic.Intragranular particle bridging is believed to be the predominant toughening mechanism imparting the improved characteristics to this material.This work was supported by the NSFC(10725207),the Research Fund for the Doctoral Pro-gram of Higher Education (24403037)and National Natural Science Fund for Outstanding Youths (24402052).[1]E.V.Clougherty,R.L.Pober,L.Kaufman,Trans.Met.Soc.AIME 242(1968)1077.[2]F.Monteverde,S.Guicciardi,A.Bellosi,Mater.Sci.Eng.A 346(2003)310.[3]A.L.Chamberlain,W.G.Fahrenholtz,G.E.Hilmas,D.T.Ellerby,J.Am.Ceram.Soc.87(2004)170.[4]F.Monteverde,C.Melandri,S.Gicciardi,Mater.Chem.Phys.100(2006)513.[5]F.Monteverde,Appl.Phys.A 82(2006)329.[6]S.S.Hwang,A.L.Vasiliev,N.P.Padture,Mater.Sci.Eng.A 464(2007)216.[7]K.Niihara, A.Nakahira,in:P.Vincentini (Ed.),Advanced Structural Inorganic Composites,Elsevier Sci-ence Publishers,Trieste,Italy,1990,pp.637–664.[8]K.Niihara,A.Nakahira,Ann.Chim.16(1991)479.[9]K.Niihara,J.Ceram.Soc.Jpn.99(1991)974.[10]W.D.Kingery,H.K.Bowen,D.R.Uhlmann,Introduc-tion to Ceramics,Wiley,1976.[11]C.M.Wang,J.Mater.Sci.30(1995)3222.[12]S.Q.Guo,J.M.Yang,H.Tanaka,Y.Kagawa,Compos.Sci.Technol.68(2008)3033.[13]I.A.Ovid’ko,A.G.Sheinerman,Scripta Mater.60(2009)627.Figure 3.TEM micrographs of crack propagation behavior in the ZrB 2–SiC nanocomposite ceramic:crack propagation is from upper right to lowerleft.Figure 4.TEM micrograph of microcracks around an intragranular particle.692Q.Liu et al./Scripta Materialia 61(2009)690–692。
Study on the Microstructure and Mechanical Properties Composite Ceramic Tool MaterialsPPT课件
Study on the Microstructure and Mechanical Properties of TiB2-Ti(C, N) Composite Ceramic Tool Materials
L. Liu May 21-22, 2011
Center for Advanced Jet Engineering Technologies (CaJET)
2
1 Introduction
➢ the properties of TiB2:
➢ the application of TiB2 :
high melting point of 2980℃
high wear resistance
high Vickers hardness of 32GPa
and temperature
➢ It was reported that titanium carbonitrides had higher temperature hardness, higher transverse rupture strength, better oxidation resistance and thermal conductivity than pure TiN and TiC.
Table 1 the average grain sizes and purities of the raw materials
raw material average Grain size [µm]
TiB2
1.5
Ti(C,N)
0.5
Ni
2.3
Mo
ห้องสมุดไป่ตู้
2008Microstructure and mechanical properties of magnesium alloy AZ31B laser beam welds
Materials Science and Engineering A485 (2008) 20–30Microstructure and mechanical properties of magnesiumalloy AZ31B laser beam weldsR.S.Coelho a,A.Kostka a,∗,H.Pinto a,S.Riekehr b,M.Koc¸ak b,A.R.Pyzalla aa Max-Planck-Institut f¨u r Eisenforschung GmbH,40237D¨u sseldorf,Germanyb GKSS Research Center GmbH,21502Geesthacht,GermanyReceived9March2007;received in revised form17July2007;accepted20July2007AbstractMicrostructure and properties of a Mg AZ31B laser beam weld withoutfiller are studied using electron microscopy,X-ray diffraction and mechanical tests.The microstructure of the weld is characterized by a narrow heat affected zone,columnar grains and precipitate coarsening in the fusion zone.Texture in the fusion zone is significantly different from the texture of the base material.The residual stress distribution observed is similar at the top and the bottom of the weld,maximum tensile residual stress values are observed in the fusion zone.Tensile tests reveal differences in the mechanical behavior of the fusion zone and the parent material,which can be related to the differences of texture and the resulting deformation mechanisms.© 2007 Published by Elsevier B.V.Keywords:Magnesium;Microstructure;Texture;Laser welding;Mechanical properties1.IntroductionBecause of their extremely low weight in combination with their good castability,workability and damping capacity[1],the use of magnesium and its alloys in specific structural applica-tions increases,often replacing aluminium alloys[2,3].In order to further widen thefield of application of Mg alloys,join-ing processes such as tungsten inert gas welding(TIG),laser beam welding(LBW),friction stir welding(FSW)and elec-tron beam welding have been applied to weld magnesium alloys [4–7].Among these processes LBW is particularly attractive for innovative and cost-effective applications,which require high precision,and processing speed[8,9].Although heat input in laser welding is rather low,tem-perature cycles,and thus recovery and recrystallization in the melt pool and heat affected zone(HAZ)produces significant microstructure changes.Theses changes include local variations of grain size,precipitate size,shape,distribution and orientation and,thus,have a strong influence on mechanical properties.∗Corresponding author.Tel.:+492116792989.E-mail address:a.kostka@mpie.de(A.Kostka).The mechanical properties of the welded joint are determined by the properties of the joint constituents(basically parent mate-rial,HAZ and fusion zone).Further,residual stresses,due to their superposition with applied stresses may have a crucial influence primarily on the fatigue strength of welds.In Mg-alloy welds microstructure–property relations are of particular interest.The ductility of commercially used Mg alloys,due to their hexagonal close packed(hcp)crystal lattice, is limited by the number of slip systems on both basal and non-basal planes,which are activated during deformation[10–13].In addition to dislocation slip also twinning contributes to plastic deformation of Mg alloys.Whereas the microstructure–property relations of Mg alloy sheet material have been studied inten-sively[1,14–17],knowledge about microstructure–property relations of welds so far is scarce.The deformation mechanisms activated during deformation of a weld depend strongly on the microstructure and texture of the fusion zone,the HAZ and the base material and the residual stress state of the welds.It is interesting to compare the microstructure–property rela-tions of laser beam welded joints with these obtained in friction stir welding process,where metallic bond is achieved below the melting point of the base material and,thus,avoiding diverse problems associated with the solidification process.Friction stir welded joints of magnesium alloys have received a lot of0921-5093/$–see front matter© 2007 Published by Elsevier B.V. doi:10.1016/j.msea.2007.07.073R.S.Coelho et al./Materials Science and Engineering A 485 (2008) 20–3021interest in science and technology,and so recently have been intensively studied[18–24].A number of investigations have shown that under the influence of the FSW tool(i.e.mechanical deformation)and processing temperatures afine recrystallized microstructure is formed in the stir zone[25].Thesefine recrys-tallized grains in the stir zone improve the local properties of this region.It is also reported that the high dislocation density in the weld region further contributes to a more homogeneous hard-ness profile for FSW Mg alloys[7].Likewise to the LBW,the integrity and performance of FSW joints of magnesium alloys can be significantly influenced by changes in the texture during the friction stir welding process.Recently,Park et al.studied the fractured surface of a FSW AZ61Mg alloy tensile speci-men and observed a strong texture(i.e.,basal plane was tilted 45◦from the fracture surface normal)[25].Other examples include:micro-texture evolutions in AZ61[26],tensile prop-erties of AZ31B-H24[27],and grain size/orientation of AZ31 [28]after FSW.However,the relation between the microstruc-ture and the mechanical properties of the FSW as well as LBW has not been fully established.Therefore,this study is conducted to investigate and establish the relationship between microstructure and mechanical proper-ties of the laser beam welded Mg-alloy AZ31B.In particular,the effect of the different crystallographic textures in fusion zone, HAZ and base material on the plastic deformation behavior of AZ31B LBW is investigated systematically.2.Experimental details2.1.MaterialAZ31B magnesium alloy rolled plates in original dimensions of2mm×1300mm×1000mm size with a nominal composi-tion of3.34–3.63wt%Al,0.45–0.53wt%Zn,0.27–0.29wt% Mn,balance Mg were purchased at Sinomag company,China.ser beam weldingNd:YAG Laser Beam Welding was used to join2mm thick rolled magnesium alloy AZ31B at the GKSS Research Center Geesthacht,Germany.Butt welds were manufactured by joining plates of200mm×330mm×2mm(Fig.1)without wire on a vacuum clamping table.The welding parameters chosen were: 2.2kW laser power,5.5m/min welding speed,0mm focal point, helium shielding gas(16l/min on the top side and40.7l/min on the bottom side),no post-welding heat treatment was performed. The welding direction(WD)coincides with the rolling direction (RD)of the Mg-alloy sheets.2.3.Mechanical testsStandardflat tensile test specimens with gauge sections of 2mm×12mm×70mm were extracted by spark erosion cut-ting from the base material and the welds both in welding direction(WD)and in transversal direction(TD)of the spec-imens(Fig.1).Additional tensile tests of the welded joints in TD were performed up to different deformation levels toclar-Fig.1.Schematic overview of the configuration of the AZ31B magnesium alloy plates joined by laser beam welding in but-joint without wire.The configuration of the machined tensile samples of the welded joint and the base material is shown.WD,welding direction;TD,transversal direction;ND,normal direction. ify the active deformation micromechanisms;specimens were deformed up to different deformation levels of0.35%(sample marked as D1),0.59%(sample marked as D2),0.9%(sam-ple marked as D3)and4.5%strains(sample marked as D4), respectively.In order to determine the mechanical properties of the fusion zone,micro-flat tensile(MFT)test samples with a gauge length of9mm,1.5mm width and0.5mm thickness were manufac-tured from the material in the fusion zone.The longitudinal direction of these MFT samples coincides with the welding direction(WD).This test technique has been specially devel-oped at the GKSS to be able to determine the stress strain curves of narrow weld seams or regions with microstruc-tural gradients(e.g.HAZ)[29].Microhardness measurements were performed across the weld cross-section according to ASTM E384-99standard at three different levels in plate thickness.2.4.Metallography and microscopyMicrostructure characterization was carried out by opti-cal microscopy,scanning(SEM)and transmission electron microscopy(TEM).The specimens were sectioned,ground,polished using lubri-cant without water and etched using acetic–picral solution(10ml acetic acid+4.2g picric acid+10ml H2O+70ml ethanol).For SEM investigations,after polishing,surface oxides on the spec-imens were removed in a Gatan Precision Etching Coating System(Gatan862).EBSD texture analyses were performed using a SEM with Shottkyfield-emission gun and an EDAX/TSL electron back scattering diffraction(EBSD)system equipped with a Digit view camera.The EBSD measurements in the fusion zone and the base material covered sample areas of1500m×350m.Several polefigures and inverse polefigures were generated from each grain map determined.For transmission electron microscopy(TEM)samples were first mechanically ground to a thickness of300m,then 3mm diameter discs were blanked of the base material and fusion zone(disc out-of-plane direction is perpendicular to the normal direction(ND)of the AZ31B sheets).Mechan-22R.S.Coelho et al./Materials Science and Engineering A 485 (2008) 20–30ical thinning of the disc was continued until it reached athickness of100m.Foils were obtained by electrochem-ical double-jet thinning using a(900ml methanol+180ml2-butoxy-ethanol+9.5g licyl+20.1g Mg(ClO4)2)electrolyte ata temperature of243K.In thefinal step of sample preparationthe foils were subjected to short ion milling(Gatan PrecisionIon Polishing System691)in order to remove the surface oxidelayer.2.5.Residual stress analysesResidual stress(RS)analysis was carried out by synchrotronX-ray diffraction at the experimental station G3at DORIS IIIat HASYLAB at DESY,Hamburg,using the sin2ψtechnique [30,31].The radiation energy used was6.9keV and the beamsize was1.5mm×1.5mm.The measurements were carried outwithin a sin2ψrange of0–0.8,step size0.2in sin2ψ,using the Mg(112)reflection.Residual stresses were determined on the top and bottom side of the joint(±30mm from the weld centreline)both in TD and WD.In order to eliminate surface effects,additional residual stress analyses were performed in a depth of about50m below the top side of the weld.3.ResultsA macroscopic view on the AZ31B LBW welds reveals a fine homogeneously structured(Fig.2a)fusion zone of about 1mm width.A closer view on the weld cross-section using OM shows that the fusion zone does not contain any visible cracks, but,that it contains some small pores(Fig.2b).The maximum pore diameter observed in the fusion zone is about50m.3.1.Mechanical properties3.1.1.MicrohardnessMicrohardness measurements on the cross-section of AZ31B LB welds reveal an average microhardness of about53HV0.1 in the AZ31B sheet base material(Fig.3).The HAZ and the fusion zone show a tendency towards slightly higher microhard-ness values(about57HV0.1)compared to the base material. The microhardness profiles determined in different distances to the weld top surface were not significantly different from each other.3.1.2.Yield strength and elongation to fractureIn order to assess the anisotropy of the mechanical properties of the welds,tensile tests were performed in rolling direction (RD)–samples A–which is identical with the welding direction (WD)and in transverse direction(TD)–samples D n–of the welded joints(Fig.1).Fracture of the welded joints tested in TD direction always occurred in the base material in several mm distance from the fusion line within the base material.3.1.2.1.Standard tensile test samples.During the tensile test where loading was applied in WD,yielding of the base material occurs at146±5MPa,whereas the yield strength of the LBW in transverse direction is measured as148±5MPa(Table1;Fig.2.Optical micrograph of the laser beam welded AZ31B magnesium alloy. Macrophoto of the weld,top view(a)and cross-section(b).Fig.4).Elongation to fracture in WD is about20%,which is slightly less than in transverse direction of the Mg AZ31B sheets(24%).In contrast to the base material,samples con-taining a weld reach their yield strength earlier when deformed in TD(92±5MPa)compared to WD(134±5MPa).Elonga-tion to fracture of the welded samples both in WD(about 15±1.5%)and TD(about19±1.5%)is lower than theelonga-Fig.3.Microindentation hardness profiles before(sample D0)and after(sample D5)tensile test show strain hardening.R.S.Coelho et al./Materials Science and Engineering A 485 (2008) 20–3023Table 1Yield,strength and strain anisotropy of the LBW AZ31B magnesium alloy in butt-joint configurationSizeWD =RD TD Rp 0.2(MPa)Rm (MPa)A (%)Rp 0.2(MPa)Rm (MPa)A (%)Tensile sample Base material B Standard 146±5249±520±1.5–––C Standard –––148±5251±524±1.5F Micro 130±10260±1020±3–––Fusion zone E Micro 180±10270±1021±3–––A Standard 134±5247±515±1.5–––D 1Standard ––––85±50.35D 2Standard ––––96±50.59D 3Standard ––––140±50.90D 4Standard ––––200±5 4.52D 5Standard–––92±5247±519±1.5Sample shape,position and orientation,e.g.a–c given in Fig.1.tion to fracture of base material samples taken in the respective directions.In the base material the yield stress anisotropy ratio σTD /σRD is 1.01,which is slightly lower than 1.17given by Lou et al.[32].The same ratio calculated for welded joint issignificantlyFig.4.Tensile stress–strain curves of the samples strained at various directions.Transversal direction (a)and longitudinal (LD =WD)direction (b).lower (σTD /σRD =0.69).Thus,LBW seems to reduce the strong mechanical anisotropy of the joints,which is caused by the strong basal texture of the cold rolled Mg sheets.Fig.5shows samples after standard TD tensile test up to 0.9%(D3)and 4.5%(D4)strain.At 4.5%strain a strong plastic deformation of the fusion zone is observed.We note that this effect is associated with a strong texture reorientation (see Section 3.3.2).3.1.2.2.Micro-flat tensile (MFT)test samples.The micro-flat tensile test samples taken in WD yields at 130±10MPa,its elongation to fracture is 20±3%.The yield strength of the fusion zone material,thus,is significantly higher (180±10MPa)than the yield strength of the macroscopic tensile test sample con-taining the weld and higher than the yield strength of the base material in WD =RD direction.The mechanical proper-ties obtained for the base material by micro flat tensile tests in samples taken in WD agree with those of the standard tensile test sample taken from the base material in the same direction (Table 1).Fig.5.Optical micrograph of the samples after TD-tensile test.Where sample D 3:0.9%accumulated strain does not show any significant changes,sample D 4:4.5%accumulated strain reveals significant deformation of the fusion zone.24R.S.Coelho et al./Materials Science and EngineeringA 485 (2008) 20–30Fig.6.EBSD inverse pole figure map of the laser beam welded AZ31B magnesium alloy prior to deformation (sample D 0).Cross-section of the weld (a)and the top view of the weld (b).Corresponding basal plane pole figures of the cross-section and top view (c).3.2.Microstructure,texture and residual stresses3.2.1.Weld microstructureThe AZ31B sheet base material consists of hexagonal close packed (hcp)␣-Mg and -phase Mg 17(Al,Zn)12[33]precipitates (identified by TEM diffraction patterns).The ␣-Mg grains are equiaxed,their average grain size is about 7.7m (Figs.6and 7).The shape of the Mg 17(Al,Zn)12pre-cipitates is ellipsoidal,their aspect ratio determined using TEM is about 5:1,their maximum length is up to about 200nm.Fig.7.Grain size distribution of the welded sample prior to the tensile defor-mation.Data obtained from the EBSD analyses of the microstructure shown in Fig.3a.In the heat affected zone (HAZ)of the base material near the interface to the fusion zone,SEM micrographs (Fig.8)reveal coarsening of the Mg 17(Al,Zn)12precipitates,the grain size of the ␣-Mg is barely affected by the heat input during welding (Fig.7).The width of the HAZ is about 10m (Figs.6and 7).The microstructure in the fusion zone is also characterized by ␣-Mg grains of slightly smaller average grain size (about 6m)compared to the base material.SEM-EBSD analyses revealed a gradient in grain size across the fusion zone (Figs.6and 7),at the interface to the HAZ grain sizes are as small as 4.9m,while in the centre of the fusion zone grain diameters are as large as 6.4m.The morphology of the grains in the fusion zoneshowsFig.8.SEM micrograph of the base material—fusion zone interface.R.S.Coelho et al./Materials Science and Engineering A 485 (2008) 20–3025Fig.9.TEM micrographs of the fusion zone before(sample D0)(a)and after (sample D5)the tensile deformation(b).Bad TEM diffraction contrast of(b) is due to an extremely high density of dislocations.Diffraction pattern corre-sponding to(b)represents evidence for extremely high accumulation of defects (microtwins)(c).a transition from columnar grains near the fusion line towards equiaxed grains in the centre of the fusion zone.Dislocation and twin density in the fusion zone(Fig.9a)are slightly higher than in the base material.The-phase Mg17(Al,Zn)12precipitates are significantly coarser(300–500nm)in the fusion zone compared to the base material.3.2.2.TextureFig.10shows polefigures obtained by EBSD for those crys-tallographic planes of the␣-Mg,which are associated with deformation processes of the hcp structure:basal slip plane (0001),prismatic(10−10)and twinning(11−20).In the AZ31B sheet base material(Figs.6c and Fig.10,sam-ple D0)the basal planes appear nearly parallel to the sheet normal direction(ND),but,slightly tilted(symmetrically at an angle ofabout25◦)to the transversal direction.In the fusion zone,the(0001)basal planes are tilted intowelding direction(WD)(α≈80◦)and rotated around the ND(β≈15◦)of the fusion zone.Texture analyses performed on weld cross-sections and on topof the welds resulted in almost identical polefigures(Figs.6cand Fig.10,sample D0)indicating that texture inhomogeneitiesin the normal direction(through-thickness)are small both inthe base material and the fusion zone(see also Fig.6,only {0001}polefigures obtained by EBSD analyses on the top side of the weld and the weld cross-section are shown for reasons ofbrevity).3.2.3.Residual stressesResidual stress(RS)distributions across the weld,whichwere measured at different positions across the welds,did notreveal significant differences in the magnitude of the residualstresses in longitudinal and transversal direction indicating ahomogeneous residual stress distribution,where the weldingprocess is stationary(at sufficient distance to the start andfinishpoints).The residual stress distribution in welding direction is sym-metric with respect to the weld centreline(Fig.11).The fusionzone contains tensile residual stresses of up to about40MPain welding direction,which reach their maximum at the weldcentreline and decrease with increasing distance to the weldcentreline.The HAZ is under tensile stresses in welding direc-tion,in the parent material at a distance of about8mm from theweld centreline the transition to compressive residual stressesoccurs.At larger distances to the weld centreline the basematerial contains compressive residual stresses of low mag-nitude.In transversal direction,the magnitude of the residualstresses in general is very small(maximum compressive RS isapproximately20MPa,maximum tensile RS is approximately5MPa).The results of RS analyses performed at the bottom side andafter removing a surface layer of50m thickness(z=−50min Fig.11)by electrochemical polishing do not show significantdifferences in RS distribution and magnitude compared to theresults of the analyses of both the longitudinal and transversalRS at the top surface of the welds.3.3.Effect of tensile deformation on weld microstructureand texture3.3.1.Weld microstructure after tensile testsDeformation of the samples during the tensile test resultsin a strong increase in twin and dislocation density(Fig.9band c)both in the base material and the fusion zone.TEMobservations further prove the twin density to be signif-icantly higher in the fusion zone compared to the basematerial.3.3.2.Texture of the deformed specimensAfter the tensile test,most crystallites in the base mate-rial keep their original orientation before plastic deformation.26R.S.Coelho et al./Materials Science and EngineeringA 485 (2008) 20–30Fig.10.Pole figures (basal {0001}and prismatic {10−10},{11−20})referring the crystallographic texture at various deformation stages.Some of the crystallites,however,reorient about 90◦,thus,a second texture pole in WD appears in the (0001)pole fig-ure of the base material after tensile deformation (Fig.10,sample D 4).Associated with the reorientation are also tex-ture poles in TD of the (10−10)and (11−20)pole figures.Pole figures obtained in the fusion zone of the tensile deformed samples reveal a strong change in texture,the (0001)pole reorient themselves into WD.In addition,in the pole fig-ures of the prismatic planes (10−10)and (11−20),poles in transversal direction appear after tensile deformation (Fig.10,sample D 4).Pole figures shown for the intermediate stages of deformation,samples D 1to D 3reveal the evolution of the deformation texture.These are discussed in detail in Section 4.2.3.3.3.Microhardness of the deformed specimensTensile deformation increases the microhardness both of base material and fusion zone.Strengthening (strain hardening)in the fusion zone appears to be more pronounced than in the base material (Fig.3).4.Discussion4.1.Microstructure,texture and residual stress formation in LBW of AZ31B4.1.1.Microstructure and texture of AZ31B LBWA highly focused heat input is characteristic of laser beam welding.The heat generated is rapidly extracted from the molten fusion zone by the surrounding colder material.During the solid-ification process,grains therefore usually grow epitaxially from the fusion line regions of the HAZ into the fusion zone.At the fusion line where relatively large temperature gradients and a small growth rate occur,the microstructure was predominantly cellular [4].Texture of the Mg sheet base material corresponds to the basal texture often reported for AZ31B sheet metal [32,34,35].Texture formation in the fusion zone is driven by crystal growth,which is controlled by the vectorial heat flow direction during the solidification process [36,37].Thus,in Mg-alloys the 11−20 a -axis of the hcp-crystal lattice,which is the closest-packed crys-tallographic direction,in crystallites within the fusion zone isR.S.Coelho et al./Materials Science and Engineering A 485 (2008) 20–3027Fig.11.Residual stress profiles of the LBW AZ31B magnesium alloy.The top side(a)and the bottom side of the weld(b).expected to grow preferentially in heatflow direction.Due to the low depth-to-width aspect ratio of the LBW welds(maximum 2)the heatflow presumably occurs in the three main specimen directions WD,TD and ND(Fig.12a and b).Therefore,the vec-tor of heatflow(h t)in the fusion zone is tilted from both WD and ND into TD.Texture in the weld is significantly different from texture in the base material,which is a near(0001)fiber texture along the ND,frequently reported for rolled Mg sheets,e.g.[32,34–36].4.1.2.Origin and assessment of residual stresses in AZ31B LB weldsWhen welding a butt-joint,the high density heat input pro-duced by the LB generates temperatures in the weld pool,which are beyond the melting point of the alloy AZ31B,while the base material remains considerably colder.Consequently,steep temperature gradients occur during heating and rapid cooling, due to preferential heatflow into the base material and the atmo-sphere.The inhomogeneous plastic deformation associated with shrinkage during cooling is known to result in the formation of residual stresses(RS)[38,39].These welding residual stresses are higher for the highly stiff or constrained joint with lower distortion[40].The similarity of the residual stress distributions determined on the top and bottom sides as well as50m beneath the top surface can be attributed to the small sheet thickness of the investigated AZ31B butt-joints.The RS profiles experimentally determined in welding and transverse directions are typical for a fusion welding process.Due to the restrained thermal contrac-tion of the weld pool during cooling in welding direction,i.e. parallel to the fusion line,the fusion zone contains tensile RS while the base material far away from the fusion zone isunder Fig.12.Schematic overview of the crystallographic texture before(a)and after tensile deformation in transverse direction(b).The texture components of the base material and the fusion zone are presented as hexagonal unit cells with the same coordinate systems.The welding heatflow within the fusion zone during the LBW is shown in the right up corner.28R.S.Coelho et al./Materials Science and Engineering A 485 (2008) 20–30balancing compressive RS.The maximum tensile RS in welding direction in the centre of the weld of about40MPa correspond to less than one third of the yield strength(200MPa)[1]of the Mg-alloy AZ31B,but may,however,influence the fatigue strength of the joint[41].4.2.Mechanical properties of AZ31B LB weldsIn many structural materials,weld joints exhibit inferior mechanical properties compared to the base material.However, samples tested in WD showed comparable yield and ultimate tensile strengths to those of the base material,while the ductility of the joints is lower than those of the base material.In TD,the yield strength of the joints is significantly lower,ultimate tensile strength is similar and ductility is lower than those of the base material(Table1).The mechanical properties of the welds,thus, show a strong direction of anisotropy.The same is true for the base material,if the mechanical strength in WD,respectively, TD is compared to the strength in ND[42].Reasons for the differences in the mechanical properties observed in the base material and the welded joint can be attributed to hardening mechanisms,such as precipitation hard-ening,grain size or texture hardening.Microscopy studies revealed precipitates in the fusion zone to be significantly coarser than in the base material,therefore, a significant effect of precipitation hardening on the mechan-ical strength of the fusion zone is not expected.Precipitation hardening by Mg17(Al,Zn)12further cannot explain the strength anisotropy observed in the welded joints.In the outer region of the fusion zone,the grain size is significantly smaller than in the base material and in the cen-tre of the fusion zone.The high volume fraction of grain boundaries in the fusion zone contributes to its strengthening, but again does not account for the strong strength anisotropy observed.Magnesium alloys due to their hcp structure are limited to only two independent easy slip systems{0001} 11−20 basal slip and{10−12} 10−11 pyramidal twinning[42,43] and the more complex slip on prismatic{10−10}and pyramidal{10−11}planes.A recent review of relevant literature revealed that basal slip has the lowest critical resolved shear stress(CRSS),ranging from0.45–0.81MPa, the CRSS of twinning is two to four times larger and prismatic slip has an even48–87times larger CRSS com-pared to basal slip[32].In addition to dislocation slip, Mg typically deforms by mechanical twinning,in particu-lar using the{10−12} 10−11 system[35,42].However, the amount of strain that can be accommodated by twin-ning is only about6.5%[42].Therefore,a strong influence of texture on deformation behavior of the welds can be expected.The properties of the macroscopic samples in WD and TD represent the combination of the responses of the weld and the base material,whereas the properties of the microflat tensile test specimens exclusively represent the intrinsic defor-mation behavior of the weld and the base material,respectively (Table1).In the following,the evolution of texture during defor-mation of the welded joints in TD is discussed in detail using polefigures determined on the samples deformed to different maximum strains(Fig.4;Table1).D0:In the fusion zone during in-plane tensile defor-mation along TD,the stress axis initially(point D0in Figs.4,10and12a)is perpendicular to the basal slip planes (0001).At a total strain of about0.1%the stress–strain curve of the welded joints starts to be different from those of the base material and becomes non-linear indicating plastic deforma-tion.D1:The polefigure obtained in the fusion zone in point D1 (Figs.7and10a)clearly shows a reorientation of part of the basal poles into WD.This orientation is due to tensile twin-ning{10−12} 10−11 .The same twinning that changes the basal polefigure also changes the orientation of the prism planes{10−10}and{11−20}.Almost no change in the tex-ture of the base material shows that only basal dislocation slip may occur in the base material.D2:At total strains between about0.3%(D1)and0.6%(D2) strain hardening in the fusion zone is very weak and the tex-ture observed at point D2is not significantly different to the texture at point D1.Thus,the texture in point D2does not give evidence of the active deformation mechanism.The weak hardening observed presumably is due to basal slip in some favorably oriented grains.At the point D2the easy twin orien-tations have been exhausted and the material hardens because it is forced to a harder deformation mode.This is maybe due to an accumulation of cutting dislocations in the basal planes,which has frequently been suggested[44,45]as dominant hardening mechanism of Mg alloys.In addition{10−12}twinning may substantially increase the hardening,because twin boundaries are intragranular obstacles for dislocation movement[46,47]. No texture change occurs in the base material.D3:Polefigures obtained in the fusion zone of the sample where tensile deformation was stopped at point D3show a strong difference compared to the polefigures obtained at lower deformations.The basal pole of one fraction of the crystallites is in WD,the basal pole of the other fraction of crystallites is perpendicular to it(TD).The crystallographic orientation with basal poles in TD does not enable basal slip, thus favoring twinning and non-basal slip and,therefore,hard-ening becomes stronger.Due to tensile twinning the symmetry axis of the crystal lattice rotates180◦about the twin plane normal[15,44,48,49]resulting in a86.6◦reorientation of the basal pole from perpendicular to nearly parallel to the stress axis(Fig.12b).D4:By further increasing total strain the hardening again decreases and the polefigures obtained in the weld of the sample deformed to point D4show an almost complete reori-entation of the crystallites with their basal poles into WD. The deformation mechanisms presumably are a combination of basal slip in favorably oriented grains whereas twinning and non-basal slip occur in those crystallites with their basal poles near TD(which then results in a reorientation of the basal poles in WD).At larger strains hardening decreases even stronger,thus,indicating basal slip in most crystallites.The。
- 1、下载文档前请自行甄别文档内容的完整性,平台不提供额外的编辑、内容补充、找答案等附加服务。
- 2、"仅部分预览"的文档,不可在线预览部分如存在完整性等问题,可反馈申请退款(可完整预览的文档不适用该条件!)。
- 3、如文档侵犯您的权益,请联系客服反馈,我们会尽快为您处理(人工客服工作时间:9:00-18:30)。
Microstructure and mechanical properties of wroughtMg-4.1Li-2.5Al-1.7Zn-1Sn alloyRuizhi Wu1,2, a, Dayong Li1,b, Xuhe Liu2,c, and Milin Zhang2,d1College of Materials Science & Engineering, Harbin University of Science & Technology, Harbin,P.R. China 1500802Key Laboratory of Superlight Materials & Surface Technology (Harbin Engineering University),Ministry of Education, Harbin, P.R. China 150001a ruizhiwu2006@,b dyli@,c liuxuhe@,d zhangmilin@Keywords: Mg-Li alloy, deformation, microstructure, mechanical properties.Abstract.An Mg-Li-Al-Zn-Sn alloy was prepared by vacuum melting. The actual content of the elements in the alloy was determined using inductively coupled plasma-atomic emission mass spectrometry (ICP-AEMS). The density of the alloy was detected using Archimedes’ method. Extrusion and rolling deformation were carried out on this alloy. Its microstructures and mechanical properties were then studied with an optical microscope (OM), scanning electronic microscope (SEM), X-ray diffractometer (XRD), energy dispersive spectrometer (EDS), and tensile tester. The extruded alloy was composed of α-Mg and Mg2Sn phases and had good strength and elongation properties as well as a good comprehensive performance. After further rolling deformation, an Al-Li phase appeared due to atomic diffusion during the hot rolling process. Strain-hardening and the strengthening effect of the Al-Li phase further improved the strength of the alloy but decreased its elongation capacity.IntroductionSince the Mg-Li alloy was discovered in 1910, it has attracted a lot of attention from researchers because of its low density, high specific strength, stiffness, good processing performance, and dimensional stability. With these properties, it has shown great potential for use in applications in the aerospace, automotive, electronics, and defense industries [1-3].The Mg-Li alloy is the lightest metal material. Its binary phase diagram shows that, when the lithium content is less than 5.7%, the alloy displays an α single-phase that resembles a close-packed hexagonal structure. When the lithium content is more than 10.3%, the alloy shows a β single-phase, which is a body-centered cubic structure. At lithium contents between 5.7-10.3%, the alloy shows a two-phase organization [4]. Studies have shown that the addition of lithium causes the length of the c-axis in the hexagonal close-packed (HCP) structure to decrease, thus bringing about a decrease in the axial ratio c/a and rendering the alloy more able to undergo dislocation slip. This factor improves the deformability of the alloy [5].Al and Zn are two other elements that are commonly used in alloys. Appropriate amounts of Al added to alloys not only increases their strength and hardness but also improves their ductility and corrosion resistance. The addition of Zn can improve the deformation capacity of alloys [6, 7].Xiang Qi et.al[8] studied the influence of Sn on the microstructure and mechanical properties of a Mg-Li-Al-Zn alloy. Their results indicated that the addition of Sn refined the alloy, thereby improving its strength due to the formation of an Mg2Sn strengthening phase. When the Sn content was 1%, the grain size of the alloy was at the minimum size.Extrusion and rolling are the main deformation methods used for Mg-Li alloys. Deformation not only eliminates some casting defects but also causes dynamic recrystallization under certainconditions [9, 10]. This allows for the formation of refined alloys with improved comprehensiveIn this paper, a Mg-Li-Al-Zn-Sn alloy was prepared. After being subjected to two deformation modes, the microstructure and mechanical properties of the alloy obtained were determined.1. Materials and MethodsPure Mg, Li, Al, Zn, and Sn were used as raw materials. The alloy was created by vacuum induction melting using Ar gas as the protection gas in low-carbon steel molds. Homogenization treatments were performed at 300 o C for 24 h. The alloy ingot was extruded from Φ56 mm to 14 mm at 350 o C and denoted as an as-extruded alloy. As a last step, the extruded alloy was reheated and rolled at 260 o C to a final thickness of 3 mm.The chemical composition of the alloy was tested by inductively coupled plasma-atomic emission mass spectrometry (ICP-AEMS). The density of the alloy was determined by Archimedes’ method. The specimens for microscopic examinations were prepared using standard metallographic sample preparation methods. In brief, the specimens were etched with 1 vol% of nitric acid alcohol for 5-10 s.A LEICA DMIRM and JSM-6480 scanning electron microscopes (SEM) were used to observe the surface and fracture morphology of the alloy. A TTR III X-ray diffractometer (XRD) was utilized to identify the different phases in the alloy. An Energy Dispersive Spectrdmeter (EDS) was used to analysis micro-area composition.The tensile specimens were prepared according to the ASTM E8M-04 standard procedure. Tensile tests were carried out on an Instron4505 electronic universal testing machine with a speed of 1.5 mm/min. Five samples for each test were subjected to analysis along the extrusion and rolling directions.2. Results and Discussion2.1 The composition and density of the alloyThe analysis determined that the alloy composition was made of Mg-4.1Li-2.5Al-1.7Zn-1Sn. The density of the alloy was found to be 1.57 g/cm 32.2 The microstructure of the alloyThe microstructure of the extruded Mg-Li-Al-Zn-Sn alloy is shown in Figures 1a and 1b. The alloy was composed of a single α-phase, although some black matter appeared to be distributed in the matrix material. The grain size was small and its shape was equiaxial. These observations are typical of a material that has undergone dynamic recrystallization. Thus, it can be said that dynamic recrystallization occurred during the extrusion process.The microstructure of the alloy after rolling is shown in Figures 1c and 1d. Except for the black material, there also existed some eutectic compounds in the crystals, which may impact the performance of the alloy. The grain size for as-rolled samples was bigger than that for extrusion alloys.Figure 1. The microstructure of the alloy: (a) As-extruded alloy, (b) Magnified as-extruded alloy, (c) As-rolled alloy, and (d) Magnified as-rolled alloy.3.3 Phase analysisbelonged to Mg 22Sn in the 2Sn exists as a phase in the alloy.There were also sections of the rolled alloy that2θ/(°)I nte nsi t y /a .u .Figure 2. The XRD patterns of the alloy.30µmElements Wt./% At./%Mg 33.68 68.77Al 1.07 2.43Zn 1.47 1.36Sn 63.78 27.47A3.4 Mechanical properties of the alloyThe stress-strain curves of the extruded and rolled alloy are shown in Figure 4. Furthermore, Table 1 lists the mechanical properties of the two deformation state of the alloy. It also lists the corresponding performance parameters of commercially available LA141 Mg-Li alloy.Compared with the LA141 alloy, the as-extruded Mg-4.1Li-2.5Al-1.7Zn-1Sn had a higher tensile and yield strength with a considerable elongation capacity (>20%). Its specific strength and modulus are significantly higher than those of the LA141 alloy. These differences may be due to the α-phase (i.e., the α-phase alloy has higher strength than the β-phase alloy). It is also possible that Mg 2Sn, which was extensively distributed throughout the matrix, hinders dislocation slips when the alloy is deformed, thus playing a role in second phase strengthening.After rolling, the strength of the alloy was further increased, and its tensile strength reached 290.26 MPa. The elongation capacity of the alloy decreased but was still above 10%. The increase in strength may be explained in part by several factors, including work-hardening, additional deformation processes, and an increase in internal dislocation density. The latter causes flow stress to increase and improves the strength of alloys. The existence of an Al-Li phase after rolling could also be another reason for the increase in alloy strength. These two strengthening mechanisms, however, contribute to a decline in alloy plasticity. The alloy grain size increased, leading to a decline in its plasticity too.0510152025050100150200250300A s-extruded A s-rolledT e nsi le stre s s/MP a Strain/%Figure 4. Stress-strain curves of the alloy.Table 1. Mechanical properties of the alloyCondition As-extruded As-rolled LA141Tensile strength, MPa 267.51 290.26 144.69Specific tensile strength, cm ×105 170.39 184.87 105.03Yield strength, MPa 161.27 192.19 124.14Specific Yield strength, cm ×105 102.72 122.41 90.12Elastic modulus, GPa — 57.3 42.1Specific Elastic modulus,×106 — 36.49 31.12Elongation, % 21 11 24Density, g/cm 3 1.57 1.57 1.353.5 Fracture microstructure of the alloyThe fracture microstructure of the alloy is shown in Figure 5. The fracture microstructure of the as-extruded alloy was composed of a large number of small dimples. In some individual dimples,mechanism of the as-extruded alloy was ductile in nature. The fracture microstructure of the as-rolled alloy consisted of cleavage planes and a small number of dimples, which indicate that the fracture mechanism of the as rolled alloy can be ascribed to quasi-cleavage fractures.Figure 5. Fracture microstructure of the alloy. (A) As-extruded alloy and (B) As-rolled alloy.Summary1) An ultra-light Mg-Li-Al-Zn-Sn alloy was prepared by vacuum melting, then it was extruded and rolled. The density of the resulting alloy is 1.57 g/cm 3.2) The Mg(4.1)-Li(2.5)-Al(1.7)-Zn-Sn alloy ingot was subjected to two kinds of deformation processes: extrusion and rolling. The as-extruded alloy was found to be composed of the α-Mg and Mg 2Sn phases. After further rolling deformation, however, the alloy was found to consist of the α-Mg, Mg 2Sn, and Al-Li phases.3) Rolling deformations could further improve the strength of the alloy, but this resulted in a decrease of the elongation capacity.AcknowledgmentsThis work was supported by the National Natural Science Foundation of China (No. 51001034), China Postdoctoral Science Foundation(No. 20100481016) and Heilongjiang Postdoctoral Science Foundation.References[1]. R.Z. Wu, M.L. Zhang: Rev. Adv. Mater. Sci. Vol. 24 (2010), p.14[2]. H.Y Wu, Z.W. Gao and J.Y. Lin: J. Alloys Compd. Vol. 474 (2009), p.158[3]. Z.K. Qu, X.H. Liu, R.Z. Wu and M.L. Zhang: Mater. Sci. Eng. A Vol. 527 (2010), p.3284.[4]. L.Y.Wei, G.L.Dunlop and H.Westengen: Mater. Sci. Technol. Vol. 12 (1996), p.741[5]. C.H.Chiu, H.Y.Wu and J.Y.Wang: J. Alloys Compd. Vol. 460 (2008), p.246[6]. R.Z Wu, M.L Zhang: Mater. Sci. Eng. A Vol. 520 (2009), p.36[7]. T.C.Chang, J.Y.Wang and C.L.Chu: Mater. Lett. Vol. 60 (2006), p.3272[8]. Q. Xiang, R.Z.Wu and M.L. Zhang: J. Alloys Compd. Vol. 477 (2009), p.832[9]. T.C. Chang, J.Y. Wang and C.L. Chu: Mater. Lett. Vol. 60 (2006), p.3272[10]. R. Ninomiya and K. Niyake: J. Jpn. Inst. Met. Vol. 10 (2001), p.509[11]. R.Z Wu, Y.S Deng and M.L Zhang: J. Mater. Sci. Vol. 44 (2009), p.4132[12]. D.K. Xu, L. Liu and Y.B. Xu: Scripta Mater. Vol. 57 (2007), p.285(a)Material and Manufacturing Technology IIdoi:10.4028//AMR.341-342Microstructure and Mechanical Properties of Wrought Mg-4.1Li-2.5Al-1.7Zn-1Sn Alloydoi:10.4028//AMR.341-342.31。