Structural Aspects of Magnetic Coupling in CaV4O9
基于LCC-C的心脏起搏器无线充电线圈设计

2021年第40卷第3期传感器与微系统(Transducer and MicrosystemTechnologies)69D O I:10. 13873/J.1000-9787(2021)03-0069-04基于L C C-C的心脏起搏器无线充电线圈设计吕宣松,潘庭龙(江南大学物联网学院,江苏无锡214122)摘要:针对可植人心脏起搏器建立了一种无线电能传输系统的结构模型。
模型采用磁耦合谐振技术与L C C-C型拓扑结构,利用电路互感理论计算得出电路等效模型的输出功率和传输效率表达式。
在M A T-L A B计算下获得较优的线圈设计参数,通过 HFSS建立传输模型,嵌人 LCC-C拓扑同时加人模拟人体组织和起搏器外壳的结构,仿真过程中对线圈进行Optmietnc优化。
结果表明:采用L C C-C的模型传输效率在线圈相距8 m m处可达91 %,与传统S-S拓扑相比拥有更加良好的传输性能。
关键词:L C C-C拓扑;心脏起搏器;无线电能传输;磁耦合谐振中图分类号:T M724; T P212 文献标识码:A文章编号:1000-9787(2021)03-0069-04D e s i g n o f w i r e l e s s c h a r g i n g c o i l f o r c a r d i a c p a c e m a k e rb a s e d o n L C C-C **L U X u a n s o n g,P A N Tinglong(School of Internet of Things,Jiangnan University,W u x i214122,China)Abstract:A structural model for wireless power transmission system i s established for implantable cardiacpacemakers.The model uses magnetic coupling resonance technolog and LCC-C topolog struct power and transmission efficiency expressions of the circuit equivalent model are mutual inductance theory-The optimal coil design parameters are obtained under M A T L A B calculation.Thetransmission model i s established by H F S S.The LCC-C topolog i s embedded and the structure of the simulatedhuman tissue and t he pacemaker casing i s added.The coil i s further optimized by using Optimetrics method duringthe simulation.The results show that the transmission efficiency of the model using LCC-C i s91 %8 m m from the coil,which has b etter transmission performance than the traditional S-S topology.Keywords:LCC-C topology;cardiac pacemaker;wireless power transmission;magnetic coupling resonance〇引言由于医疗技术的进步以及人口的老龄化,植人心脏起 搏器的患者逐年增加,然而,植人式心脏起搏器采用一次性 电池,寿命一般为1 ~12年[1],这取决于所使用的系统类 型和频率。
螺线管结构参数对脉冲磁场的影响
第17卷 第5期 太赫兹科学与电子信息学报Vo1.17,No.52019年10月 Journal of Terahertz Science and Electronic Information Technology Oct.,2019文章编号:2095-4980(2019)05-0840-05螺线管结构参数对脉冲磁场的影响张广帅,宋志敏,孙 钧,吴 平,滕 雁,曹亦兵,范志强(西北核技术研究所高功率微波技术重点实验室,陕西西安 710024)摘 要:研究了线圈间距、匝数、个数以及不锈钢套筒对脉冲磁体产生磁场的影响规律。
在储能电容和电压不变的前提下,研究结果表明:增加线圈间距会导致磁感应强度降低,磁力线包络增大,但总电流达到峰值时刻减小;增加线圈匝数,峰值电流明显减小,会降低磁感应强度,但有利于抑制磁力线包络;增加并联线圈个数,有利于产生较长的均匀区,但是在供能一定的条件下,磁场强度有所降低,同时总电流达到峰值时刻减小。
总体来看,在一定均匀区长度的设计要求下,减少单个线圈匝数,增加并联线圈个数,能够得到磁感应强度更大、均匀性更好的磁场,但要考虑线圈承载电流的能力。
另外,不对称的阴阳极金属结构会导致磁场不对称分布,且磁感应强度达到峰值时刻要晚于总电流达到峰值的时刻。
关键词:高功率微波;螺线管脉冲磁体;均匀磁场中图分类号:O532 文献标志码:A doi:10.11805/TKYDA201905.0840Effect of solenoid pulsed magnet parameters on magnetic field ZHANG Guangshuai,SONG Zhimin,SUN Jun,WU ping,TENG Yan,CAO Yibing,FAN Zhiqiang. All Rights Reserved.(Science and Technology on High Power Microwave Laboratory,Northwest Institute of Nuclear Technology,Xi’an Shaanxi 710024,China) Abstract:The effect of structural parameters of solenoid pulsed magnet on magnetic field is studied, including the number of turns, the number of coils, the distance between multi-coils and stainless steelcylinder. Under the condition that the capacitor storing energy and the voltage which supplies power areboth constant, the amplitude of magnetic flux density is reduced and the fluctuation of magnetic field linesis increased contrarily when increasing the distance between multi-coils, but the total current reaches itspeak earlier. Increasing the number of turns in each coil can obviously reduce the peak of total current andthus the amplitude of magnetic flux density. However, it is beneficial for reducing the fluctuation ofmagnetic field lines. With the increasing of coils number, the length of uniform magnetic field regionbecomes longer, the amplitude of magnetic flux density is reduced with constant supplied energy, and thetotal current reaches its peak earlier. On the whole, when the length of uniform magnetic field region isconstant, decreasing the number of turns and increasing the number of coils are both effective ways to obtaina stronger magnetic flux density and better uniformity. But it is limited by the capacity of the coils to carrycurrent. In addition, the stainless steel cylinder causes the distribution of magnetic field to beasymmetrical, and the amplitude of magnetic flux density reaches its peak later than the total current does.Keywords:High Power Microwave(HPM);solenoid pulse magnet;uniform magnetic field高功率微波(HPM)源通常需要外加引导磁场来约束产生HPM的强流相对论电子束[1–5]。
二维核磁共振谱在多糖结构研究中的应用_李波
二维核磁共振谱在多糖结构研究中的应用李 波1,2*,陈海华2,许时婴2(1.河南科技学院食品学院,新乡453003;2.江南大学食品学院,无锡214036)摘 要:二维核磁共振谱(2D NMR )是获取多糖结构信息,尤其是在多糖序列分析方面的有力工具。
本文重点介绍了在多糖结构解析中常用的几种2D NMR 谱以及2D NM R 解析多糖结构的方法。
关键词:核磁共振;二维核磁共振;多糖;结构中图分类号:O65 Application of Two Dimension Nuclear Magnetic Resonance in the StructuralDetermination of PolysaccharideLI Bo 1,2*,C HE N Hai -hua 2,XU Shi -ying 2(1.Food School ,Henan Institute of Science and Technology ,Xinxian g 453003,China ;2.School of Food Science and Technology ,Southern Yangt ze Univers ity ,Wuxi 214036,China )A bstract :Two dimension nuclear magnetic resonance (2D NMR )is a powerful tool acq uiring structural information of pol ysac -charide ,especiall y in the sequence analysis of polysaccharide .Several 2D NM R spectra often used in polysaccharide structural analysis and the method for studying polysaccharide structure usin g 2D NMR are introduced in this paper .Key words :nuclear magnetic resonance ;2D NMR ;polysaccharide ;structure 天然产物研究与开发 2005 Vol .17 No .4NA TUR AL PROD UCT RESEARCH AND DEVELOP M ENT 收稿日期:2004-04-06 接受日期:2004-05-12 *通讯作者Tel :86-373-3040977;E -mail :libowuxi @yahoo .co m .cn 近年来,多糖类化合物由于具有多方面的功能性质,因而成为研究领域的一个热点,多糖的结构及其构效关系也越来越引起人们的重视。
Magnetic thin film structures fabricated with edge

专利名称:Magnetic thin film structures fabricated with edge closure layers发明人:Bernell E. Argyle,Thomas C.Arnoldussen,Thomas J. Beaulieu,Dean A.Herman, Jr.,Sol Krongelb,Hin P. E. Lee,DanielA. Nepela,Bojan Petek,Lubomyr T.Romankiw,John C. Slonczewski申请号:US07/432649申请日:19891107公开号:US05032945A公开日:19910716专利内容由知识产权出版社提供摘要:Magnetic thin film structures are disclosed including a laminate of a layer of nonmagnetic material sandwiched between first and second layers of magnetic material and at least one edge closure layer of magnetic material disposed on a side edge of the laminate with the edge closure layer being in magnetic contact with the first and second layers of magnetic material. The edge closure layer eliminates magnetic edge closure domains and magnetic edge-curling walls in the yoke and poletip regions, or in a fluxguide of a magnetic recording head to substantially eliminate Barkhausen noise and wall network instabilities. Multiple layer laminates are also disclosed having a plurality of nonmagnetic layers each of which are sandwiched between layers of magnetic material and wherein the laminate includes edge closure layers that contact all the magnetic layers. Several methods are disclosed for fabricating the laminate. In one class of technique, the side edges are deposited together with a top layer in a single platingoperation. In an another embodiment, the side edge closure layers are separately plated. Another embodiment provides for a layer of antiferromagnetic material deposited between the nonmagnetic layer and one of the magnetic layers to provide additional anisotropy.申请人:INTERNATIONAL BUSINESS MACHINES CORP.代理机构:Scully, Scott, Murphy & Presser更多信息请下载全文后查看。
大展弦比柔性机翼气动特性分析_马铁林

2007年7月第33卷第7期北京航空航天大学学报Journa l o f Be iji ng U nivers it y of A eronauti cs and A stronauti cs July 2007V o.l 33 N o 17收稿日期:2006-06-28作者简介:马铁林(1978-),男,黑龙江齐齐哈尔人,博士生,mati eli n@yahoo .co .大展弦比柔性机翼气动特性分析马铁林 马东立 张 华(北京航空航天大学航空科学与工程学院,北京100083)摘 要:长航时无人机在飞行过程中受气动载荷影响,其大展弦比机翼产生弯曲和扭转变形,这种弹性变形严重影响飞机的飞行性能和飞行安全,不能将此种飞机机翼当作传统的刚性机翼进行气动分析.针对一真实复合材料大展弦比前掠机翼,采用气动/结构一体化的分析方法,利用计算流体动力学(CFD )软件FLUENT 和计算结构动力学(CSD)软件NASTRAN 联合求解,研究了在不同载荷情况下大展弦比柔性机翼静气动弹性变形对机翼气动特性的影响.结果表明,大展弦比无人机机翼受载变形后升阻比降低,滚转力矩和偏航力矩显著增大,对飞机的纵向和横侧向气动性能产生不利影响,同时也证明此CFD /CSD 耦合计算方法可以应用到柔性机翼的气动/结构一体化设计中.关 键 词:CFD /CSD;大展弦比柔性机翼;静气动弹性;气动特性;一体化设计中图分类号:V 221;V 211.41文献标识码:A 文章编号:1001-5965(2007)07-0781-04Aerodyna m i c charact eristi c ana l y sis of hi g h -aspect rati o el a sti c w i n gM a T ielin M a Dong li Zhang H ua(S chool of Aeronau tic S ci en ce and E ngi neeri ng ,B eiji ng Un i vers i ty ofA eronau tics and A stron auti cs ,Beiji ng 100083,Ch i na)Abstr act :The aerodyna m ic perfor m ance and flying safety of l o ng -endurance unm anned aer i a l veh icle (UAV )are largely affected by the aer oe lastic d istortion of its high-aspect ratio w ing .H i g h -aspect rati o w i n g o fUAV is bended and t w isted by the air l o ad duri n g flight and couldn p t be treated as a traditi o na l rig i d w ing .The effect of static aeroe lastic distorti o n to t h e aerodyna m ic characteristic for a rea l h i g h -aspect ratio sweepfor w ar d w ing o f co m posite m ateria lunder d ifferen t load statusesw as analyzed .The i n tegrated design m ethod co m bined aerodyna m ic w ith str ucturalw as adopted in this ana l y sis using assoc i a ted co m puta ti o na l fl u i d dyna m ics (CFD )progra m FLUE NT and co m puta ti o na l str uctua l dyna m ics (CSD)progra m NASTRAN.The resu lt show s a lif-t drag ratio drop and a re m arkable i n crease on r o lli n g and ya w ing m o m ents wh ich a ffect the portra it and latera l aerodyna m ic perfor m ance ofUAV negatively .The result a lso show s that the CFD /CSD coupli n g co m putati o na l m ethodo logy is re liable to be used aerodyna m ic -str uctural i n tegrated desi g n of elastic w i n g .Key wor ds :CFD /CSD;h i g h -aspect rati o e lastic w i n g ;static aeroe l a stics ;aerodyna m ic characteristic ;i n tegrated desi g n现代长航时无人机为提高飞行性能减小起飞重量,飞机结构大量采用碳纤维复合材料,尤其是在机翼和尾翼等部件.在布局上普遍选用大展弦比机翼来提高飞机的升阻比,而这种复合材料大展弦比机翼在受到气动载荷时,产生很大的上翘和扭转变形[1],此问题属于气动弹性静力问题.柔性机翼的这种静气弹变形严重影响着飞机的气动性能,尤其是横侧向气动特性,使飞机偏离原设计点,影响无人机的飞行安全.国外研究机构对此问题进行了很多相关研究,提出了各种解决途径.20世纪80年代俄罗斯中央流体动力研究院开发了多学科飞机设计的综合设计软件ARGON,90年代后期,美国M SC 公司推出了能够进行气动力-结构一体化耦合计算只是采用了平板气动力计算方法,都没有将飞机的非线性气动力和结构变形同时考虑到飞机的飞行载荷计算中[2].21世纪初,国外学者又提出了H I SSS/NASTRAN方法[3]、CFL3D/GFEC方法[4]、ZAERO/NASTRAN方法[5]等气动/结构一体化的设计手段,这些方法都将结构的弹性变形考虑到了飞机设计中,同时为研究柔性机翼的静气动弹性问题提出了很好的解决途径.国内学者针对柔性机翼的静气弹问题也开展了相应的研究[6-7],提出了可行的研究手段,但所选择的计算模型较简单,尤其是结构模型不能反映实际飞机结构的特点.本文针对长航时无人机的特点,机身和尾翼的弹性变形相对机翼来说对飞行性能影响较小,利用结构/气动一体化设计的方法,将CFD软件FL UENT和CSD软件NAS-TRAN结合起来,对某无人机大展弦比前掠翼机翼进行了静气弹计算,并详细分析了结构弹性对机翼气动特性的影响.1前掠翼机翼模型选择某长航时无人机方案的大展弦比前掠机翼作为研究对象,模型的俯视图和正视图见图1.图1前掠翼模型全机的滚转力矩主要由机翼产生,机翼上反角和后掠角是影响全机滚转力矩最大的几何参数[8],机翼的滚转力矩导数可由公式(1)近似表示,可以看出机翼前掠降低了机翼的滚转稳定性,为了弥补这个缺陷,适当增加机翼上反角来提高全机的滚转稳定性.所以此方案所选择的机翼为带有一定上反角的大展弦比前掠机翼,同时为了增加机翼根部的容积,方便结构布置,翼根处加大了弦长,并前缘后掠.C l B=-C A L#¸y p/2-si n+1/2C L¸y p/2(1)式中,C l B为机翼的滚转力矩导数;C A L为机翼的升力线斜率;C L为机翼的升力系数;#为机翼上反角;+1/2为机翼1/2弦线后掠角,后掠为正,前掠为负.2气动/结构一体化计算方法为研究机翼静气弹变形对气动性能的影响,荷分布,然后计算在这种载荷状态下机翼的变形情况,有了变形数据,再重新进行气动计算,这样迭代下去就可以得到最终的结果.求解弹性机翼气动力的基本思想有弱耦合法和强耦合法.弱耦合法将气动分析模式和结构分析模式结合起来,首先完成气动分析,将收敛的气动力分布转移到结构模型中,用结构有限元方法计算出结构变形,针对变形的机翼重新生成气动计算网格,再进行气动分析,重复上述过程,直至气动或结构满足收敛条件,通常经过4~7次迭代即可收敛[7].而在强耦合法中,气动方程和结构方程是同时求解的,即在气动方程求解迭代期间,间断地按照还未收敛的气动力来计算结构变形,再把变形量计入气动力计算的迭代过程中去,直到变形和气动力都收敛[7].强耦合法更接近于实际情况,但实现起来比较复杂,尤其针对实际复杂机翼结构.本文采用弱耦合的方法,利用FL UENT和NASTRAN进行联合计算,得到了可信的结果,计算流程如图2所示.图2计算流程计算步骤为:①利用FLUE NT计算选定飞行状态的机翼气动性能(第一次迭代时,选择刚性机翼气动模型);②将气动计算得到的机翼物面压力分布,通过插值加到结构模型的机翼物面节点上;③利用Nastran计算机翼在此载荷状态下的弯曲和扭转静气弹变形;④根据结构弹性变形,重新进行建立气动模型.重复①~④步直到满足预选的收敛标准.气动模型和结构模型分别建模,气动模型物面网格点密,机翼前缘和后缘进行加密处理.结构模型物面网格点较稀,气动计算得到的压力分布要通过插值的方法加到结构模型的网格节点上.本文所选用的结构模型为一满足强度要求的实际多墙式结构,迭代过程中结构模型不变,每一次迭代气动模型要根据上一轮结构模型变形结果进行调整.机翼是对整个飞机性能影响最大的部件,研究单独机翼的气动特性的变化可以反映出这种弹性变形对全机气动性能的影响.针对高空长航时无人机飞行过程中无机动,过载小的特点,选择0b~6b小迎角、0b~4b小侧滑角范围进行研究,同时选择1g,3g两种载荷状态进行对比分析.782北京航空3柔性机翼静气弹计算与结果分析经过3轮迭代以后1g过载下翼尖挠度由最初的516mm变化到517.3mm,气动计算发现结构变形的这种微小增量对气动性能的影响很小,可以认为计算已经稳定,这也说明气动的收敛早于结构收敛.图3表示了刚性机翼以及弹性机翼在1g和3g过载下的变形情况.1g过载和3g过载下弹性机翼延展向的弯曲变形情况如图4所示,扭转变形如图5所示.在1g过载情况下,机翼翼尖挠度为517mm,扭角为0.36b;3g过载情况下,翼尖挠度为1072mm,扭角为0.85b.图3机翼变形图图4弯曲变形图图5扭转变形图图6为3种状态下的机翼升力延展向的分布情况,可以看出3g过载下机翼的升力环量分布相比其他2种状态明显提高,但在展向2m处升力分布有一/凹陷0,这是因为3g过载下机翼载荷加大,展向流动也随之增强,前掠翼外翼展向流动向翼根方向堆积,由于机翼内翼后掠,所以内翼展向流动又向翼尖方向堆积,这就造成中外翼对接处气流提前分离,升力降低.机翼弹性变形对各气动参数的影响如图7~图6升力沿展向的分布图7升力曲线图8阻力曲线图9升阻比曲线图7升力曲线中3g过载情况,升力也明显增大,这是因为大展弦比机翼受载后弯曲和扭转变形都很严重,机翼正扭转角加大相当于加大了机翼的零升迎角,这主要影响纵向气动性能,使相同迎角下机翼的升力增大,但升力曲线线性段斜率基本不变;随着过载的增大,机翼阻力随之增大,升阻比减小,见图8、图9,CD为机翼阻力系数,K为机翼升阻比;机翼扭转对升力线性段的纵向力矩导数影响不大,但相同迎角下纵向力矩随着过第7期马铁林等:大展弦比柔性机翼气动特性分析图10纵向力矩曲线图11滚转力矩曲线图12 偏航力矩曲线载的增大而增大,如图10,C m 为纵向力矩系数.机翼弯曲变形使机翼上翘相当于加大机翼上反角,这严重影响着机翼的横侧向力矩特性,如图11、图12所示,C l 为滚转力矩系数;C n 为偏航力矩系数.各计算状态在A =0b 时的滚转力矩导数C l B 和偏航力矩导数C n B 见表1.表1 横侧向气动特性对比项目C l B C n B 刚性机翼-0.00090.000021g 过载弹性机翼-0.0022-0.00013g 过载弹性机翼-0.0035-0.0003机翼在1g 过载下,滚转力矩导数绝对值为刚性机翼的2.44倍,3g 过载下为刚性机翼的3.89倍.同时可以看出,机翼受载同时产生了稳定的偏航力矩,一般来说,飞机的偏航力矩都是由垂尾产生的,而大展弦比机翼弹性变形使滚转力矩与偏航力矩都有很大的提高.实际飞行过程中机翼严重的弹性变形,使得在初始设计阶段按刚性机翼设计横侧向气动性能匹配的飞机偏离原设计点,4 结 论本文采用气动/结构一体化的设计方法,对大展弦比柔性机翼的气动特性进行了深入研究,得出以下结论:①机翼受载后的弹性变形对纵向和横侧向气动性能都有影响,弹性变形使升阻比降低,滚转力矩和偏航力矩显著增大.②弹性变形使飞机纵向气动性能降低,但不影响飞行安全;横航向气动参数的改变,对飞机横航向的稳定性产生了严重的影响,滚转力矩导数C l B 过大,飞机易产生荷兰滚或飘摆不稳定.③对于大展弦比无人机,气动计算时应考虑到弹性对气动特能的影响,调整参数时不能为增大滚转稳定性一味的增大机翼上反角.④FLUE NT /NASTRAN 结合的CFD /CSD 耦合计算方法可以应用到柔性机翼的气动/结构一体化设计中.参考文献(References )[1]Pal aci os R ,C esn i k C.S tatic non li near aeroel astici ty of flexi b leslenderw i ngs i n co m pressi b le flo w [R].A I AA-2005-1945,2005[2]邓立东,李天.柔性飞机的非线性飞行载荷计算研究[J].飞行力学,2004,22(4):85-88Deng L i dong ,L iT ian .Researc h of non li near fli ght load s cal cu -lati on on a fl ex i b l e aircraft[J].F li gh t Dyna m ics ,2004,22(4):85-88(i n Ch i n ese)[3]Pes on en U,Agar w al R .A rtifici al n et w or k pred icti on of ai rcraftaeroelas tic b ehavior[R].A I AA-2002-0947,2002[4]Gum bert C ,Ne wm an P ,H ou G.E ffect of rando m geom etric un -certai n t y on the co m putational des i gn of a 3-D flexi b lew i ng[R ].A I AA-2002-2806,2002[5]Panza J ,M ak S .Aeroservoelasti c anal ys i s of a NASA -ALTA I Rai r veh icle[R ].AI AA -2003-6500,2003[6]徐敏,安效民,陈士橹.一种CFD /CSD 耦合计算方法[J ].航空学报,2006,27(1):33-37Xu M i n,An X i ao m i n,Chen Sh il u .CFD /C SD coupi ng nu m er-i cal co m pu tati on alm et hodol ogy[J].Act a Aeronauti ca et A stro -nau ti ca S i n ica ,2006,27(1):33-37(i n Ch i n ese)[7]刘金辉.考虑弹性变形的机翼气动-结构多学科优化设计[D ].西安:西北工业大学,翼型、叶栅空气动力学国防科技重点实验室,2005L i u Ji nhu.i M u lti d i sci p li nary aerodyna m i c -stru cture op ti m i zati on d es i gn of the el asti c w i ng[D].X i p an :N ati on alK ey Laboratory of A erodyna m ic Des i gn and Res earch ,N ort hw ester n Po l ytechn i cal Un ivers it y ,2005(i n Ch i nese)[8] B.埃特肯著.大气飞行动力学[M ].北京:科学出版社,1979E t k i n B .Dyna m i cs of at m ospheri c fli ght [M ].Beiji ng :S ci en ce Press ,1979(i n Ch i nese)(责任编辑:张 嵘)784北京航空。
铝硅镁合金三元相图
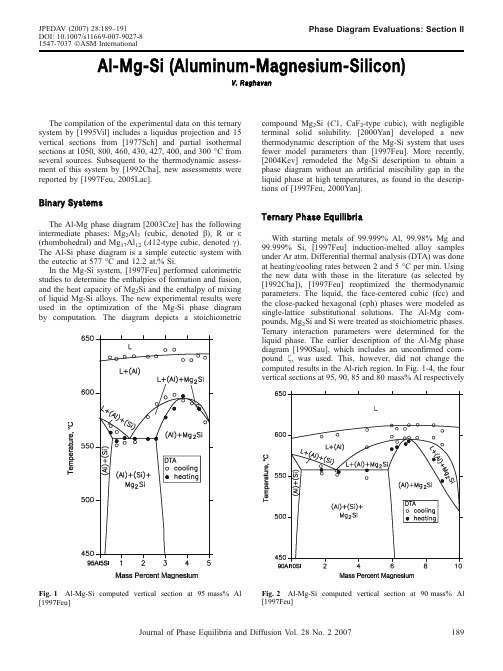
Al-Mg-Si (Aluminum-Magnesium-Silicon)V.RaghavanThe compilation of the experimental data on this ternary system by [1995Vil]includes a liquidus projection and 15vertical sections from [1977Sch]and partial isothermal sections at 1050,800,460,430,427,400,and 300°C from several sources.Subsequent to the thermodynamic assess-ment of this system by [1992Cha],new assessments were reported by [1997Feu,2005Lac].Binary SystemsThe Al-Mg phase diagram [2003Cze]has the following intermediate phases:Mg 2Al 3(cubic,denoted b ),R or e (rhombohedral)and Mg 17Al 12(A 12-type cubic,denoted c ).The Al-Si phase diagram is a simple eutectic system with the eutectic at 577°C and 12.2at.%Si.In the Mg-Si system,[1997Feu]performed calorimetric studies to determine the enthalpies of formation and fusion,and the heat capacity of Mg 2Si and the enthalpy of mixing of liquid Mg-Si alloys.The new experimental results were used in the optimization of the Mg-Si phase diagram by computation.The diagram depicts a stoichiometriccompound Mg 2Si (C 1,CaF 2-type cubic),with negligible terminal solid solubility.[2000Yan]developed a new thermodynamic description of the Mg-Si system that uses fewer model parameters than [1997Feu].More recently,[2004Kev]remodeled the Mg-Si description to obtain a phase diagram without an artificial miscibility gap in the liquid phase at high temperatures,as found in the descrip-tions of [1997Feu,2000Yan].Ternary Phase EquilibriaWith starting metals of 99.999%Al,99.98%Mg and 99.999%Si,[1997Feu]induction-melted alloy samples under Ar atm.Differential thermal analysis (DTA)was done at heating/cooling rates between 2and 5°C per ing the new data with those in the literature (as selected by [1992Cha]),[1997Feu]reoptimized the thermodynamic parameters.The liquid,the face-centered cubic (fcc)and the close-packed hexagonal (cph)phases were modeled as single-lattice substitutional solutions.The Al-Mg com-pounds,Mg 2Si and Si were treated as stoichiometric phases.Ternary interaction parameters were determined for the liquid phase.The earlier description of the Al-Mg phase diagram [1990Sau],which includes an unconfirmed com-pound f ,was used.This,however,did not change the computed results in the Al-rich region.In Fig.1-4,the four vertical sections at 95,90,85and 80mass%AlrespectivelyFig.1Al-Mg-Si computed vertical section at 95mass%Al[1997Feu]Fig.2Al-Mg-Si computed vertical section at 90mass%Al [1997Feu]JPEDAV (2007)28:189–191DOI:10.1007/s11669-007-9027-81547-7037ÓASM InternationalPhase Diagram Evaluations:Section IIJournal of Phase Equilibria and Diffusion V ol.28No.22007189computed by [1997Feu]are compared with their own DTA data on solidification temperatures.The agreement with the experimental data is good.[2005Lac]carried out a new thermodynamic assessment of this system,which uses the revised Al-Mg description with only the three intermediate phases,Mg 2Al 3(b ),e and c .They used a larger set of data for the liquid-solid equilibria from the experimental results of [1977Sch,1997Feu].Temperature-independent ternary interaction parameters were obtained for the liquid phase.A partial liquidus projection and three vertical sections at 5and 85mass%Al and 2mass%Si respectively were computed by [2005Lac].The vertical section at 2mass%Si is redrawn in Fig.5.The agreement with the experimental results of [1977Sch,1931Los]is satisfactory.The eutectic maximum (e 3)of the reaction L $ðAl ÞþMg 2Si does not lie on the Al-Mg 2Si join but on the Mg-rich side of this line [1992Cha,1997Feu,2001Bar,2005Lac].The partial liquidus projection in Fig.6depicts the above univariant line determined by [2001Bar].Other recent references on the phase equilibria of this system include [1999Esk,2002Fro,2003Erm,2003Roo,2004Liu,2005Don].References1931Los:L.Losana,The Aluminum-Magnesium-Silicon Ternary System,Metall.Italiana ,1931,23,p 367-382,in Italian1977Sch:E.Schurmann and A.Fischer,Melting Equilibria in the Ternary System Al-Mg-Si,Giessereiforschung ,1977,29(4),p 161-165,inGermanFig.3Al-Mg-Si computed vertical section at 85mass%Al[1997Feu]Fig.4Al-Mg-Si computed vertical section at 80mass%Al[1997Feu]Fig.5Al-Mg-Si computed vertical section at 2mass%Si[2005Lac]Fig.6Al-Mg-Si partial liquidus projection depicting the uni-variant line of L $ðAl ÞþMg 2Si [2001Bar]Section II:Phase Diagram Evaluations190Journal of Phase Equilibria and Diffusion V ol.28No.220071990Sau:N.Saunders,A Review and Thermodynamic assess-ment of the Al-Mg and Mg-Si Systems,CALPHAD,1990, 14(1),p61-701992Cha:N.Chakraborti and H.L.Lukas,Thermodynamic Optimization of the Mg-Al-Si Phase Diagram,CALPHAD, 1992,16(1),p79-861995Vil:P.Villars, A.Prince and H.Okamoto,Al-Mg-Si, Handbook of Ternary Alloy Phase Diagrams,vol4,ASM International,Materials Park,OH,19951997Feu:H.Feufel,T.Godecke,H.L.Lukas,and F.Sommer, Investigation of the Al-Mg-Si System by Experiments and Thermodynamic Calculations,J.Alloys Compd.,1997,247, p31-421999Esk:D.G.Eskin, A.Massardier,and P.Merle,A Study of High Temperature Precipitation of Al-Mg-Si Alloys with an Excess of Silicon,J.Mater.Sci.,1999,34(4), p811-8202000Yan:X.Y.Yan,F.Zhang,and Y.A.Chang,A Thermody-namic Analysis of the Mg-Si System,J,Phase Equilibria,2000, 21(4),p379-3842001Bar:O.M.Barabash,O.V.Sulgenko,T.N.Legkaya,and N.P. Korzhova,Experimental Analysis and Thermodynamic Calcu-lation of the Structural Regularities in the Fusion Diagram of the System of Alloys Al-Mg-Si,J.Phase Equilibria,2001, 22(1),p5-112002Fro:A.G.Froseth,S.J.Andersen, C.D.Marioara,P.M. Derlet,and R.Hoier,Solving the Structure of Phases in theAl-Mg-Si Alloy System with the Help of ab initio Modeling, Mater.Res.Soc.Symp.Proc.,2002,755,p19-242003Cze:T.Czeppe,W.Zakulski,and E.Bielanska,Study of the Thermal Stability of Phases in the Mg-Al System,J.Phase Equilibria,2003,24(3),p249-2542003Erm:S.V.Ermakova,K.D.Savelev,and V.M.Golod, Thermodynamic Study of Equilibrium Solidification and Ther-mophysical Properties of Al-Si-Mg System Alloys,Liteinoe Proizvodstvo,2003,9(Suppl.),p9-12,in Russian2003Roo:A.Roosz,J.Farkas,and G.Kaptay,Thermodynamics Based Semi-empirical Description of the Liquidus Surface and Partition Coefficients in Ternary Al-Mg-Si Alloy,Mater.Sci. Forum,2003,414-415,p323-3282004Kev:D.Kevorkov,R.Schmid-Fetzer,and F.Zhang,Phase Equilibria and Thermodynamics of the Mg-Si-Li System and Remodeling of the Mg-Si System,J.Phase Equilib.Diffus., 2004,25(2),p140-1512004Liu:Y.Q.Liu,A.Das,and Z.Fan,Thermodynamic Predic-tions of Mg-Al-M(M=Zn,Mn,Si)Alloy Compositions Amenable to Semisolid Metal Processing,Mater.Sci.Technol., 2004,20(1),p35-412005Don:H.B.Dong and R.Brooks,Determination of Liquidus Temperature in Al-Si and Al-Si-Mg Alloys Using a Single-Pan Scanning Calorimeter,Mater.Sci.Eng.A,2005,A413-A414, p480-4842005Lac:caze and R.Valdes,CALPHAD-type Assessment of the Al-Mg-Si System,Monatsh Chem.,2005,136(11),p1899-1907 Phase Diagram Evaluations:Section IIJournal of Phase Equilibria and Diffusion V ol.28No.22007191。
Magnetic Devices For a Beam Energy Recovery THz Free Electron Laser

Magnetic D evices for a Beam Energy RecoveryTHz Free Electron LaserR. R. S. Caetano¹, G. Cernicchiaro², R. M. O. Galvão³1 2Universidade Federal do Rio de Janeiro,Macaé, R J, Bra z il, rcaetano@macae.ufrj.brCoordenação de Física Aplicada, Centro Brasileiro de Pesquisas Físicas, Rio de Janeiro, RJ, Bra z il, geraldo@cbpf.br3Instituto de Física USP, São Paulo, SP, Bra z il.Abstract:This paper presents a numerical analysis of magnetic devices, dipole, quadrupole and undulator and a THz Free Electron Laser (FEL) electron-beam recovery system. Free Electron Laser are an important source of coherent radiation being used in the study of chemical properties of substances, thus being an important tool for various fields of science such as condensed matter physics, chemistry, biology and medicine. The magnetic device of this simulation is to contribute to the proposed deployment of a national laboratory for multiuser application and development of a recovery system FEL to operate in the far infrared range between 0.3 to 1.2 THz.Keywords: Free Electron Laser THz, magnetic device, simulation in COMSOL.1.IntroductionFree electron laser can be used are in spectroscopy thus have applications in scientific fields such as medicine, chemistry, condensed matter and biology [1]. Thus the Brazilian Center for Physics Research (CBPF) proposed a construction project of a Free Electron Laser (FEL) using the components of a Free Electron Laser of the College of Optics & Photonis (CREOL). The free-electron laser operating in the far infrared range working with wavelengths in the range of 200-600 micrometers. The equipment consists of a linear accelerator that generates electrostatic energy up to 1.7 MeV, a magnetic undulator, which is designed with permanent magnets made from neodymium iron boron (NdFeB) with 185 periods with a wavelength of 8 mm length of 1486 mm and a distance between the undulator cassette (gap) of 6 mm. Has magnetic dipoles and quadrupoles working in optics from the electron beam. The vacuum system is formed by mechanical, ionic pumps and turbomolecular [2], control is being developed for the LabView platform.This paper focuses on the numerical analysis using the COMSOL software of magnetic elements that are the dipole, quadrupole and undulator. These components work changing the trajectory and the size of the electron beam.2.Theory2.1 DipoleT he magnetic dipole is an element that has the function deflect the electron beam [3]. The dipole magnetic field is generated by the electric current passing through the coils. This current in solenoid generates a magnetic flux in the iron core creating a unidirectional magnetic field in between irons given by the right hand rule. The magnitude of the magnetic field can be extracted by Ampere's law gives us the relationship between the electric current and the magnetic field.Figure 1: Magnetic dipole.The dipole magnetic field is given by equation 1 where n is the number of turns, the electrical current I, is the distance between the irons and is the permeability of air.( 1)2.2 QuadrupoleT his component consists of four poles formed by rectangular hyperbolas with alternating magnetic fields, your objective is to change the diameter of the electron beam. The geometry of the quadrupole makes the magnetic field in the core is zero and the magnetic field is generated by modulo magnitude of the field in the x-axis and y-axis [3].Figure 2: Magnetic quadrupole.The quadrupole magnetic field can be calculated from the integration by Ampere's law.( 2)The magnetic field consists of two quadrupole components in the x and y axis, there is a resulting gradient g [T/ m]. Thus, the magnetic field in the x and y axes can be given by the equations , where , and the equation of the resulting magnetic field is equal to:( 3)2.3 UndulatorThe undulator is a mechanical structure consisting of periodic magnets with alternating poles, separated by a distance called (gap). These magnets are made of magnetic material pure permanent magnetic (PPM). This structure causes synchronous radiation be concentrated in a beam, thus reducing the radiation loss.Figure 3: Description of the undulator magnetic.The magnetic undulator field is perpendicular to the x axis, and the direction of the z-axis. Because the poles are alternating magnetic field in the undulator has a sinusoidal behavior as can be seen in equation 4. [4]. Where is the wavelength of the undulator and is the initial magnetic field. In equation 5 we have the initial magnetic field which is a ratio between the gap and the wavelength.(4)(5) e of COMSOL MultiphysicsThe numerical analysis of the dipole, quadrupole and undulator were built using the module AC/DC COMSOL multiphysics. To calculate the magnetic field in the dipole and quadrupole magnetic field the tool was used with the equation 6. In the undulator, the calculation of the initial magnetic field was carried out with the magnetic field in the current tool with the equation 7.(6)(7)3.1 DipoleThe geometry of the dipole was constructed in 3D and has two types of materials are iron, which comprises all the dipole and charge air by the cylindrical shell. Infinite element domain was used for the cylindrical shell for emulating an infinite open space causing all numerical analysis considers the limited space as being infinite.Figure 4. 3D geometry of the magnetic dipole.The interface was used for the dipole Magnetic Field <Ampere Law for the iron structure and for calculating coil was used in Magnetic Field <muti-turn coil <Coil Current Calculation which calculate the magnetic field in the coil according to the current electrical and number of turns. The dipole has 877 turns and the maximum current is 2.5 A.Figure 5. Coil Current Calculation in dipole magnetic.Dipole in the fine mesh, which corresponds to 61114 domain element, boundary element 9728, 1039 edge element was used. The study used for the calculation of the dipole was the Stationary Parametric Sweep and the electric current was applied in order to have values of -2.5 A to +2.5 A.Figure 6: mesh magnetic Dipole.3.2 QuadrupoleThe quadrupole was developed in 3D for its construction it was done primarily in 2D and using the Work Plane tool, after it was extruded to 3D format.Figure7. Quadrupole magnetic geometric in 2D.Figure 8. 3D geometry of the magnetic quadrupole.The materials used in the quadrupole are air and iron and infinite element domain was appliedto the cylindrical shell. To calculate the magneticfield of the quadrupole physical Magnetic Field <Ampere Law, which calculates the magnetic field from the magnetization and uses equation was used , where N is the number of turns, I is the electric current, A is the area and V is the volume of the coil. In the case of quadrupole have 344 turns and the electrical current worth 2.5 A. The magnetization in the quadrupole is oriented in the x and z axes have that each pole has a different orientation.Quadrupole in the mesh extremely fine,which corresponds to 749885 domain element, boundary element 58352, 2772 edge element was used. The study used for the calculation of the quadrupole was the Stationary Parametric Sweep and the electric current was applied in order to have values of -2.5 A to +2.5 A.Figure 9: mesh magnetic quadrupole.3.3 UndulatorFor this work was a session of 3D undulator built with 400 mm in length and can change the wavelength and the distance of the gap. Undulator possessed these variations to resemble the original equipment. The initial magnetic field generated in the undulator does not depend on the distance of the gap but wavelength (equation 5)and thus it is possible to make a comparison between the simulation and the experiment.The materials used were a NdFeB magnetic material is (33SH) and those manufactured with the air gaps 1010 steel, their averages are: x = 10.5 mm, y = 1.3 mm and z = 25 mm and x = 30mm, y = 2 7 mm and z = 13 mm, respectively [5]. On the external surface that is a spherical vacuum volume 220 mm radius of 5mm layer was used.Figure 10. 3D geometry of the magnetic Undulator.T he magnetic field of the undulator was obtained using the Magnetic Field, No current Physical<Magnetic Flux. When applying a magnetic field in a material, the resulting field B is the sum of the applied field H and the field of the magnetized material, as in Equation 8.( 8)Magnetic materials have hysteresis magnetization curves called reduce to zero the magnetic field applied, as can be seen in equation 9 [6].( 9)The magnetization is added in Magnetic flux Conservation, as the magnetization of the magnets are oriented alternately is necessary to indicate the direction of magnetization in this case, the direction is along the x axis. The mesh used was extra fine, possessing 5842814 domain boundary elements 681 250 and 80 793 edge andthe study used was stationary.Figure 11. Mesh Undulator magnetic.6.0 Results 6.1 DipoleThe simulation dipole was constructed to compare the value of the modulus of the magnetic field with the experimental value in Figures 12 and 13 have the simulation results.Figure 12. Magnetic Flux density in an dipolemagnetic device.Figure 13. Graph magnetic field x current electric indipole.Table 1: Comparison of the magnetic field obtained from the simulation and experimental analysis in the dipole magnetic device.The magnetic field values are obtained for the maximum value of electric current of 2.5 A. Thus the table 1 it can be seen that the threevaluesarecloseto a percentage error of 3% between experiment and COMSOL. 6.2 QuadrupoleThe simulation quadrupole was constructed to compare the value of the modulus of the magnetic field with the experimental value in Figures 14 and 15 have the simulation results.Figure 14. Magnetic Flux density in an quadrupolemagnetic device.Figure 15. Graph magnetic field x current electric inquadrupole.Table 2: Comparison of the magnetic field obtained from the simulation and experimental analysis in the quadrupole magnetic device.The magnetic field values are obtained for the maximum value of electric current of 2.5 A. Thus the table 2 it can be seen that the three values are close to a percentage error of 1,9 % between CREOL and experiment.6.3 UndulatorThe simulation study of the undulator was developed for the x axis and y axis. In Figures 16, 17, 18 and 19 have a magnetic field initial described in the two axes respectively.Figure 16. Magnetic Flux density in an undulator magnetic device (front view). Figure17. Magnetic field of the undulator gap measured in the z axis direction with respect to distance in the y direction.Figure 18. Magnetic Flux density in an undulator magnetic device (side view).In Figure 19 we have the magnetic field in the undulator which is a sine function according to equation 10, so this simulation is in agreement with theory. In Table 3it canbe observedthat the values stipulated by the project, experiment and COMSOL, so it is possible that there is an error 1% compared to COMSOL and experiment.Figura 19.Undulator magnetic field measured at the gap in the z direction as a function of distance in the x direction.Table 3: Comparison of the magnetic field obtained from the simulation and experimental analysis in the undulator magnetic device.7.0 ConclusionIn this paper we present 3D simulations of the dipole, quadrupole and undulator magnetic elements that are owned by a Thz Free Electron Laser. The results have to numerical simulation results are in agreement with experiment validating the paper. To the next module using the practical tracing in COMSOL, an electron beam will be added with the aim of studying the behavior of the electron beam in magnetic elements.8 Reference[1] S rinivas Krishnagopal*, Vinit Kumar†,Sudipta Maiti, S. S. Prabhu and S. K. Sarkar, "Free-electron lasers.," CURRENT SCIENCE, VOL. 87,, pp. NO. 8, 25, OCTOBER 2004.[2] M. Tecimer, Time –Domanin analysis andtechnology of THz Free Electron Lasers, Tel –Aviv University. : Faculty of Engineering.Departamento f Electical Engineering –Physical Electronics. , 2005.[3] J. Tanabe, Iron Dominated ElectromagnetsDesign, Fabrication, Assembly and Measurements, 2006.[4] M. D. J. R. Peter Schmüser, Ultraviolet andSoft X-Ray Free-Electron Lasers - Introduction to Physical Principles, Experimental Results, Technological Challenges, Springer, 2009.[5] J. G. L. R. E. Paul P. Tesch, "Finalconstruction of the CREOL 8 mm period hybrid undulator," Nuclear Instruments and Methods in Physics Research A375, pp. 504-507, 1996. [6] R. N. Faria, L.F.C.P. Lima, Introdução aomagnetismo dos materiais, São Paulo: Livraria da Fisica, 2005.。
liquid–liquid phase separation
Biophysical Chemistry 109(2004)105–1120301-4622/04/$-see front matter ᮊ2003Elsevier B.V .All rights reserved.doi:10.1016/j.bpc.2003.10.021Cloud-point temperature and liquid–liquid phase separation ofsupersaturated lysozyme solutionJie Lu *,Keith Carpenter ,Rui-Jiang Li ,Xiu-Juan Wang ,Chi-Bun Ching a ,a a b bInstitute of Chemical and Engineering Sciences,Ayer Rajah Crescent 28,࠻02-08,Singapore 139959,Singapore aChemical and Process Engineering Center,National University of Singapore,Singapore 117576,SingaporebReceived 31July 2003;received in revised form 8October 2003;accepted 16October 2003AbstractThe detailed understanding of the structure of biological macromolecules reveals their functions,and is thus important in the design of new medicines and for engineering molecules with improved properties for industrial applications.Although techniques used for protein crystallization have been progressing greatly,protein crystallization may still be considered an art rather than a science,and successful crystallization remains largely empirical and operator-dependent.In this work,a microcalorimetric technique has been utilized to investigate liquid–liquid phase separation through measuring cloud-point temperature T for supersaturated lysozyme solution.The effects of cloud ionic strength and glycerol on the cloud-point temperature are studied in detail.Over the entire range of salt concentrations studied,the cloud-point temperature increases monotonically with the concentration of sodium chloride.When glycerol is added as additive,the solubility of lysozyme is increased,whereas the cloud-point temperature is decreased.ᮊ2003Elsevier B.V .All rights reserved.Keywords:Biocrystallization;Microcalorimetry;Cloud-point temperature;Liquid–liquid phase separation1.IntroductionKnowledge of detailed protein structure is essen-tial for protein engineering and the design of pharmaceuticals.Production of high-quality pro-tein crystals is required for molecular structure determination by X-ray crystallography.Although considerable effort has been made in recent years,obtaining such crystals is still difficult in general,and predicting the solution conditions where pro-*Corresponding author.Tel.:q 65-6874-4218;fax:q 65-6873-4805.E-mail address:lujie@.sg (J.Lu ).teins successfully crystallize remains a significant obstacle in the advancement of structural molecu-lar biology w 1x .The parameters affecting protein crystallization are typically reagent concentration,pH,tempera-ture,additive,etc.A phase diagram can provide the method for quantifying the influence of solu-tion parameters on the production of crystals w 2,3x .To characterize protein crystallization,it is neces-sary to first obtain detailed information on protein solution phase behavior and phase diagram.Recently physics shows that there is a direct relationship between colloidal interaction energy106J.Lu et al./Biophysical Chemistry109(2004)105–112and phase diagram.Gast and Lekkerkerker w4,5x have indicated that the range of attraction between colloid particles has a significant effect on the qualitative features of phase diagram.A similar relationship should hold for biomacromolecules, i.e.the corresponding interaction potentials govern the macromolecular distribution in solution,the shape of the phase diagram and the crystallization process w6x.Many macromolecular crystallizations appear to be driven by the strength of the attractive interactions,and occur in,or close to,attractive regimes w7,8x.Recent intensive investigation has revealed that protein or colloidal solution possesses a peculiar phase diagram,i.e.liquid–liquid phase separation and sol–gel transition exists in general in addition to crystallization w9,10x.The potential responsible for the liquid–liquid phase separation is a rather short range,possibly van der Waals,attractive potential w11,12x.The measurement of cloud-point temperature T can provide useful informationcloudon the net attractive interaction between protein molecules,namely,the higher the cloud-point tem-perature,the greater the net attractive interaction. Herein Taratuta et al.w13x studied the effects of salts and pH on the cloud-point temperature of lysozyme.Broide et al.w14x subsequently meas-ured the cloud-point temperature and crystalliza-tion temperature for lysozyme as a function of salt type and concentration.From these works the cloud-point temperature was found to be typically 15–458C below the crystallization temperature. Furthermore,Muschol and Rosenberger w15x deter-mined the metastable coexistence curves for lyso-zyme through cloud-point measurements,and suggested a systematic approach to promote pro-tein crystallization.In general,an effective way to determine the strength of protein interactions is to study temperature-induced phase transitions that occur in concentrated protein solutions.Liquid–liquid phase separation can be divided into two stages w11x:(1)the local separation stage at which the separation proceeds in small regions and local equilibrium is achieved rapidly;and(2) the coarsening stage at which condensation of these small domains proceeds slowly to reduce the loss of interface free energy w16x.The coexisting liquid phases both remain supersaturated but differ widely in protein concentration.The effect of a metastable liquid–liquid phase separation on crystallization remains ambiguous w17x.Molecular dynamics simulations and analyt-ical theory predict that the phase separation will affect the kinetics and the mechanisms of protein crystal nucleation w18x.tenWolde and Frenkel w19x have demonstrated that the free energy barrier for crystal nucleation is remarkably reduced at the critical point of liquid–liquid phase separation, thus in general,after liquid–liquid phase separa-tion,crystallization occurs much more rapidly than in the initial solution,which is typically too rapid for the growth of single crystal with low defect densities w15x.The determination of the location of liquid–liquid phase separation curve is thus crucial for efficiently identifying the optimum solution conditions for growing protein crystals. Microcalorimetry has the potential to be a useful tool for determining:(1)the metastable-labile zone boundary;(2)the temperature-dependence of pro-tein solubility in a given solvent;and(3)the crystal-growth rates as a function of supersatura-tion w20x.Microcalorimeters can detect a power signal as low as a few microwatts whereas standard calorimeters detect signals in the milliwatt range. Because of this greater sensitivity,samples with small heat effects can be analyzed.In addition, microcalorimetry has the advantage of being fast, non-destructive to the protein and requiring a relatively small amount of material.The present work is concerned with the analysis of the transient heat signal from microcalorimeter to yield liquid–liquid phase separation information for lysozyme solutions at pH4.8.To further examine the role of salt and additive on interprotein interactions, cloud-point temperature T has been determinedcloudexperimentally as a function of the concentrations of salt,protein and glycerol.2.Materials and methods2.1.MaterialsSix times crystallized lysozyme was purchased from Seikagaku Kogyo,and used without further107J.Lu et al./Biophysical Chemistry 109(2004)105–112purification.All other chemicals used were of reagent grade,from Sigma Chemical Co.2.2.Preparation of solutionsSodium acetate buffer (0.1M )at pH 4.8was prepared with ultrafiltered,deionized water.Sodi-um azide,at a concentration of 0.05%(w y v ),was added to the buffer solution as an antimicrobial agent.Protein stock solution was prepared by dissolving protein powder into buffer.To remove undissolved particles,the solution was centrifuged in a Sigma centrifuge at 12000rev.y min for 5–10min,then filtered through 0.22-m m filters (Mil-lex-VV )into a clean sample vial and stored at 48C for further experiments.The concentration of protein solution was determined by measuring the absorbance at 280nm of UV spectroscopy (Shi-madzu UV-2550),with an extinction coefficient of 2.64ml y (mg cm )w 21x .Precipitant stock solution was prepared by dissolving the required amount of sodium chloride together with additive glycerol into buffer.The pH of solutions was measured by a digital pH meter (Mettler Toledo 320)and adjusted by the addition of small volumes of NaOH or HAc solution.2.3.Measurement of solubilitySolubility of lysozyme at various temperatures and precipitant y additive concentrations was meas-ured at pH 4.8in 0.1M acetate buffer.Solid–liquid equilibrium was approached through both crystallization and dissolution.Dissolving lasted 3days,while the period of crystallization was over 2weeks.The supernatant in equilibrium with a macroscopically observable solid was then filtered through 0.1-m m filters (Millex-VV ).The concen-tration of diluted supernatant was determined spec-troscopically and verified by refractive meter(Kruss)until refractive index remained unchanged ¨at equilibrium state.Solubility of each sample was measured in duplicate.2.4.Differential scanning microcalorimetry Calorimetric experiments were performed with a micro-differential scanning calorimeter with anultra sensitivity,micro-DSC III,from Setaram SA,France.The micro-DSC recorded heat flow in microwatts vs.temperature,thus can detect the heat associated with phase transition during a temperature scan.The sample made up of equal volumes of protein solution and precipitant solu-tion was filtered through 0.1-m m filters to remove dust particles further.To remove the dissolved air,the sample was placed under vacuum for 3min while stirring at 500rev.y min by a magnetic stirrer.The degassed sample was placed into the sample cell of 1.0ml,and a same concentration NaCl solution was placed into the reference cell.The solutions in the micro-DSC were then cooled at the rate of 0.28C y min.After every run,the cells were cleaned by sonicating for 10–15min in several solutions in the following order:deionized water,methanol,ethanol,acetone,1M KOH and finally copious amounts of deionized water.This protocol ensured that lysozyme was completely removed from the cells.The cells were then placed in a drying oven for several hours.The rubber gaskets were cleaned in a similar manner except acetone and 1M KOH were omitted and they were allowed to dry at low temperature.3.Results and discussionA typical micro-DSC scanning experiment is shown in Fig.1.The onset of the clouding phe-nomenon is very dramatic and easily detected.The sharp increase in the heat flow is indicative of a liquid–liquid phase separation process producing a latent heat.This is much consistent with many recent investigations of the liquid–liquid phase separation of lysozyme from solution w 22,23x .In fact,such a liquid–liquid phase separation is a phase transition with an associated latent heat of demixing.In this work,the cloud-point tempera-tures at a variety of lysozyme,NaCl and glycerol concentrations are determined by the micro-DSC at the scan rate of 128C y h.3.1.Effect of protein concentrationIn semilogarithmic Fig.2we plot the solid–liquid and liquid–liquid phase boundaries for lyso-108J.Lu et al./Biophysical Chemistry 109(2004)105–112Fig.1.Heat flow of a typical micro-DSC scan of lysozyme solution,50mg y ml,0.1M acetate buffer,pH 4.8,3%NaCl.The scan rate 128C y h is chosen referenced to the experimental results of Darcy and Wiencek w 23x .Note the large deflection in the curve at approximately 4.38C indicating a latent heat resulting from demixing (i.e.liquid–liquid phase separation )process.Fig.2.Cloud-point temperature and solubility determination for lysozyme in 0.1M acetate buffer,pH 4.8:solubility (5%NaCl )(s );T (5%NaCl,this work )(d );T (5%cloud cloud NaCl,the work of Darcy and Wiencek w 23x )(*);solubility (3%NaCl )(h );T (3%NaCl )(j ).cloud Fig.3.Cloud-point temperature determination for lysozyme as a function of the concentration of sodium chloride,50mg y ml,0.1M acetate buffer,pH 4.8.zyme in 0.1M acetate buffer,pH 4.8,for a range of protein concentrations.It is worth noting that,at 5%NaCl,our experimental data of T from cloud micro-DSC are quite consistent with those from laser light scattering and DSC by Darcy and Wiencek w 23x ,with difference averaging at approx-imately 0.88C.This figure demonstrates that liquid–liquid phase boundary is far below solid–liquid phase boundary,which implies that the liquid–liquid phase separation normally takes place in a highly metastable solution.In addition,cloud-point temperature T increases with the cloud concentration of protein.3.2.Effect of salt concentrationFig.3shows how cloud-point temperature changes as the concentration of NaCl is varied from 2.5to 7%(w y v ).The buffer is 0.1M acetate (pH 4.8);the protein concentration is fixed at 50mg y ml.Over the entire range of salt concentrations studied,the cloud-point temperature strongly depends on the ionic strength and increases monotonically with the concentration of NaCl.Crystallization is driven by the difference in chemical potential of the solute in solution and in the crystal.The driving force can be simplified as w 24xf sy Dm s kT ln C y C (1)Ž.eq109J.Lu et al./Biophysical Chemistry 109(2004)105–112Fig.4.The driving force required by liquid–liquid phase sep-aration as a function of the concentration of sodium chloride,50mg y ml lysozyme solution,0.1M acetate buffer,pH 4.8.In the same way,we plot the driving force,f ,required by liquid–liquid phase separation as a function of the concentration of sodium chloride in Fig.4.At the moderate concentration of sodium chloride,the driving force required by liquid–liquid phase separation is higher than that at low or high salt concentration.As shown in Fig.3,with NaCl concentration increasing,the cloud-point temperature increases,which is in accord with the results of Broide et al.w 14x and Grigsby et al.w 25x .It is known that protein interaction is the sum of different potentials like electrostatic,van der Waals,hydrophobic,hydration,etc.The liquid–liquid phase separation is driven by a net attraction between protein molecules,and the stronger the attraction,the higher the cloud-point temperature.Ionic strength is found to have an effect on the intermolecular forces:attractions increase with ionic strength,solubility decreases with ionic strength,resulting in the cloud-point temperature increases with ionic strength.It is worth noting that,the effect of ionic strength on cloud-point temperature depends strongly on the specific nature of the ions w 13x .Kosmotropic ions bind adjacent water molecules more strongly than water binds itself.When akosmotropic ion is introduced into water,the entro-py of the system decreases due to increased water structuring around the ion.In contrast,chaotropes bind adjacent water molecules less strongly than water binds itself.When a chaotrope is introduced into water,the entropy of the system increases because the water structuring around the ion is less than that in salt-free water.This classification is related to the size and charge of the ion.At high salt concentration ()0.3M ),the specific nature of the ions is much more important w 25x .The charges on a protein are due to discrete positively and negatively charged surface groups.In lysozyme,the average distance between thesecharges is approximately 10Aw 26x .As to the salt ˚NaCl used as precipitant,Na is weakly kosmo-q tropic and Cl is weakly chaotropic w 27x .At low y NaCl concentrations,as the concentration of NaCl increases,the repulsive electrostatic charge–charge interactions between protein molecules decrease because of screening,resulting in the increase of cloud-point temperature.While at high NaCl con-centrations,protein molecules experience an attrac-tion,in which differences can be attributed to repulsive hydration forces w 14,25x .That is,as the ionic strength increases,repulsive electrostatic or hydration forces decrease,protein molecules appear more and more attractive,leading to higher cloud-point temperature.At various salt concentra-tions,the predominant potentials reflecting the driving force for liquid–liquid phase separation are different.Fig.4shows that the driving force,f ,is parabolic with ionic strength,while Grigsby et al.w 25x have reported that f y kT is linear with ionic strength for monovalent salts.The possible reasons for that difference include,their model is based on a fixed protein concentration of 87mg y ml,which is higher than that used in our study,yet f y kT is probably dependent on protein concentration,besides the solutions at high protein and salt concentrations are far from ideal solutions.3.3.Effect of glycerolFig.5compares cloud-point temperature data for 50mg y ml lysozyme solutions in absence of glycerol and in presence of 5%glycerol,respec-110J.Lu et al./Biophysical Chemistry109(2004)105–112parison of cloud-point temperatures for lysozyme at different glycerol concentrations as a function of the con-centration of sodium chloride,50mg y ml,0.1M acetate buffer, pH4.8:0%glycerol(s);5%glycerol(j).Fig.6.Cloud-point temperatures for lysozyme at different glycerol concentrations,50mg y ml lysozyme,5%NaCl,0.1M acetate buffer,pH4.8.Fig.7.Cloud-point temperature and solubility determination for lysozyme at different concentrations of glycerol in0.1M acetate buffer,5%NaCl,pH4.8:solubility(0%glycerol)(s); T(0%glycerol)(d);solubility(5%glycerol)(h);cloudT(5%glycerol)(j).cloudtively.Fig.6shows the cloud-point temperature as a function of the concentration of glycerol.The cloud-point temperature is decreased as the addi-tion of glycerol.In semilogarithmic Fig.7we plot the solid–liquid and liquid–liquid phase boundaries at dif-ferent glycerol concentrations for lysozyme in0.1 M acetate buffer,5%NaCl,pH4.8,for a range of protein concentration.This figure demonstrates that liquid–liquid and solid–liquid phase bounda-ries in the presence of glycerol are below those in absence of glycerol,and the region for growing crystals is narrowed when glycerol is added. Glycerol has the property of stabilizing protein structure.As a result,if crystallization occurs over a long period of time,glycerol is a useful candidate to be part of the crystallization solvent and is often included for this purpose w28x.In addition,glycerol is found to have an effect on the intermolecular forces:repulsions increase with glycerol concentra-tion w29x.Our experiment results of solubility and cloud-point temperature can also confirm the finding.The increased repulsions induced by glycerol can be explained by a number of possible mecha-nisms,all of which require small changes in the protein or the solvent in its immediate vicinity.The addition of glycerol decreases the volume of protein core w30x,increases hydration and the size of hydration layer at the particle surface w31,32x. In this work,we confirm that glycerol shifts the solid–liquid and liquid–liquid phase boundaries. The effect of glycerol on the phase diagram strong-111 J.Lu et al./Biophysical Chemistry109(2004)105–112ly depends on its concentration and this canprovide opportunities for further tuning of nuclea-tion rates.4.ConclusionsGrowing evidence suggests protein crystalliza-tion can be understood in terms of an order ydisorder phase transition between weakly attractiveparticles.Control of these attractions is thus keyto growing crystals.The study of phase transitionsin concentrated protein solutions provides one witha simple means of assessing the effect of solutionconditions on the strength of protein interactions.The cloud-point temperature and solubility datapresented in this paper demonstrate that salt andglycerol have remarkable effects on phase transi-tions.The solid–liquid and liquid–liquid bounda-ries can be shifted to higher or lower temperaturesby varying ionic strength or adding additives.Ourinvestigation provides further information upon therole of glycerol used in protein crystallization.Glycerol can increase the solubility,and decreasethe cloud-point temperature,which is of benefit totuning nucleation and crystal growth.In continuingstudies,we will explore the effects of other kindsof additives like nonionic polymers on phasetransitions and nucleation rates.Much more theo-retical work will be done to fully interpret ourexperimental results.AcknowledgmentsThis work is supported by the grant from theNational Natural Science Foundation of China(No.20106010).The authors also thank Professor J.M.Wiencek(The University of Iowa)for kinddiscussion with us about the thermal phenomenaof liquid–liquid phase separation.Referencesw1x A.McPherson,Current approaches to macromolecular crystallization,Eur.J.Biochem.189(1990)1–23.w2x A.M.Kulkarni, C.F.Zukoski,Nanoparticle crystal nucleation:influence of solution conditions,Langmuir18(2002)3090–3099.w3x E.E.G.Saridakis,P.D.S.Stewart,L.F.Lloyd,et al., Phase diagram and dilution experiments in the crystal-lization of carboxypeptidase G2,Acta Cryst.D50(1994)293–297.w4x A.P.Gast, C.K.Hall,W.B.Russel,Polymer-induced phase separations in non-aqueous colloidal suspensions,J.Colloid Interf.Sci.96(1983)251–267.w5x H.N.W.Lekkerkerker,W.C.K.Poon,P.N.Pusey,et al., Phase-behavior of colloid plus polymer mixtures,Euro-phys.Lett.20(1992)559–564.w6x A.Tardieu,S.Finet,F.Bonnete,Structure of the´macromolecular solutions that generate crystals,J.Cryst.Growth232(2001)1–9.w7x D.Rosenbaum,C.F.Zukoski,Protein interactions and crystallization,J.Cryst.Growth169(1996)752–758.w8x A.George,W.W.Wilson,Predicting protein crystalli-zation from a dilute solution property,Acta Cryst.D50(1994)361–365.w9x D.Rosenbaum,P.C.Zamora, C.F.Zukoski,Phase-behavior of small attractive colloidal particles,Phys.Rev.Lett.76(1996)150–153.w10x V.J.Anderson,H.N.W.Lekkerkerker,Insights into phase transition kinetics from colloid science,Nature416(2002)811–815.w11x S.Tanaka,K.Ito,R.Hayakawa,Size and number density of precrystalline aggregates in lysozyme crys-tallization process,J.Chem.Phys.111(1999)10330–10337.w12x D.W.Liu,A.Lomakin,G.M.Thurston,et al.,Phase-separation in multicomponent aqueous-protein solutions,J.Phys.Chem.99(1995)454–461.w13x V.G.Taratuta,A.Holschbach,G.M.Thurston,et al., Liquid–liquid phase separation of aqueous lysozymesolutions:effects of pH and salt identity,J.Phys.Chem.94(1990)2140–2144.w14x M.L.Broide,T.M.Tominc,M.D.Saxowsky,Using phase transitions to investigate the effect of salts onprotein interactions,Phys.Rev.E53(1996)6325–6335. w15x M.Muschol,F.Rosenberger,Liquid–liquid phase sep-aration in supersaturated lysozyme solutions and asso-ciated precipitate formation y crystallization,J.Chem.Phys.107(1997)1953–1962.w16x C.Domb,J.H.Lebowitz,Phase Separation and Critical Phenomena,Academic,London,1983.w17x D.F.Rosenbaum,A.Kulkarni,S.Ramakrishnan,C.F.Zukoski,Protein interactions and phase behavior:sen-sitivity to the form of the pair potential,J.Chem.Phys.111(1999)9882–9890.w18x O.Galkin,P.G.Vekilov,Nucleation of protein crystals: critical nuclei,phase behavior and control pathways,J.Cryst.Growth232(2001)63–76.w19x P.R.tenWolde, D.Frenkel,Enhancement of protein crystal nucleation by critical density fluctuations,Sci-ence277(1997)1975–1978.w20x P.A.Darcy,J.M.Wiencek,Estimating lysozyme crystal-lization growth rates and solubility from isothermalmicrocalorimetry,Acta Cryst.D54(1998)1387–1394.112J.Lu et al./Biophysical Chemistry109(2004)105–112w21x A.J.Sophianopoulos,C.K.Rhodes,D.N.Holcomb,K.E.vanHolde,Physical studies of lysozyme.I.Characteri-zation,J.Biol.Chem.237(1962)1107–1112.w22x Y.Georgalis,P.Umbach, A.Zielenkiewicz,et al., Microcalorimetric and small-angle light scattering stud-ies on nucleating lysozyme solutions,J.Am.Chem.Soc.119(1997)11959–11965.w23x P.A.Darcy,J.M.Wiencek,Identifying nucleation tem-peratures for lysozyme via differential scanning calorim-etry,J.Cryst.Growth196(1999)243–249.w24x M.L.Grant,Effects of thermodynamics nonideality in protein crystal growth,J.Cryst.Growth209(2000)130–137.w25x J.J.Grigsby,H.W.Blanch,J.M.Prausnitz,Cloud-point temperatures for lysozyme in electrolyte solutions:effectof salt type,salt concentration and pH,Biophys.Chem.91(2001)231–243.w26x D.Voet,J.Voet,Biochemistry,Wiley,New Y ork,1990. w27x K.D.Collins,Charge density-dependent strength of hydration and biological structure,Biophys.J.72(1997)65–76.w28x R.Sousa,Use of glycerol and other protein structure stabilizing agents in protein crystallization,Acta Cryst.D51(1995)271–277.w29x M.Farnum, C.F.Zukoski,Effect of glycerol on the interactions and solubility of bovine pancreatic trypsininhibitor,Biophys.J.76(1999)2716–2726.w30x A.Priev,A.Almagor,S.Yedgar,B.Gavish,Glycerol decreases the volume and compressibility of proteininterior,Biochemistry35(1996)2061–2066.w31x S.N.Timasheff,T.Arakawa,Mechanism of protein precipitation and stabilization by co-solvents,J.Cryst.Growth90(1988)39–46.w32x C.S.Miner,N.N.Dalton,Glycerol,Reinhold Publishing, New Y ork,1953.。
- 1、下载文档前请自行甄别文档内容的完整性,平台不提供额外的编辑、内容补充、找答案等附加服务。
- 2、"仅部分预览"的文档,不可在线预览部分如存在完整性等问题,可反馈申请退款(可完整预览的文档不适用该条件!)。
- 3、如文档侵犯您的权益,请联系客服反馈,我们会尽快为您处理(人工客服工作时间:9:00-18:30)。
a r X i v :c o n d -m a t /9704203v 1 [c o n d -m a t .s t r -e l ] 24 A p r 1997Structural Aspects of Magnetic Coupling in CaV 4O 9W.E.PickettComplex Systems Theory Branch,Naval Research Laboratory,Washington DC 20375(February 1,2008)The strong corrugation of the V 4O 9layer in the spin gap system CaV 4O 9is examined for its impact on the exchange coupling constants between the spin 12metaplaquette systems.From its vanishing susceptibility χ(T →0)[1]and re-lated NMR properties [2]CaV 4O 9is known to enter a quantum disordered phase with a spin gap.This be-havior has stimulated theoretical investigation of the ex-change couplings between the S=15-depletedlattice [10](described below)has been viewed as an array of square “plaquettes”of V ions tending toward singlet formation.[3].Isolated plaquettes have a singlet ground state;structural chemistry however suggests intra-and inter-plaquette V-V coupling (J and J ′)should be very similar,so the limit of isolated plaquettes is not realistic.Depletion alone does not destroy N´e el order,[5]and although competing interactions lead to χ(T)→0,they do not account quantitatively for the χ(T)data.[6,9]Yet the “plaquette phase”of incipient singlets provides an attractive framework for accounting for the lack of magnetic ordering and the spin gap behavior.In this pa-per we take into account all complications of the crystal structure,and find that the orbital character of the oc-cupied V d spin orbital is different than previously antic-ipated.[3,4,8,11]For this spin orbital,nnn exchange cou-pling exceeds nn coupling.The resulting coupling leads to a picture of two coupled metaplaquette systems that may preserve the tendency toward local singlet formation while enhancing frustration of ordering.The crystal structure of CaV 4O 9[10]has been ideal-ized in most previous theoretical treatments to the con-sideration of VO layers with periodic V vacancies.The actual structure is much more interesting.The space group is simple tetragonal P4/n (#85in the International Tables),with a =8.333˚A ,c =5.008˚A ,and two formula units per cell.The low crystal symmetry is reflected in the fact that ten of the 15internal structural parameters (for five sites)are not fixed by symmetry.Conceptually,one may start from a VO square lattice with cations and anions arranged as on a checkerboard.Each V ion along a V-O axis has an apical oxygen above (say)the layer,with V ions along neighboring V-O lines having their apical oxygen below the plane.V ions are removed in a pattern corresponding to a left-moving (or right-moving,giving the chiral partner)knight on a chessboard that lies at a 45◦angle derived only from the V ions:from one Vvacancy,go two V ions along a line of V ions,and one to the left to locate a neighboring vacancy.The resulting pattern,shown in Fig.1,is a √5enlargement with respect to the V sublattice,which is itself √2larger than the VO square lattice.Ca ions arrange themselves either above or below the V vacancies.49atoms not displayed.A plaquette of V ions is labelled by ‘V’.Two metaplaquettes,formed by the V ions above the layer,are shown by the solid lines.Superimposed on this superstructure is a severe cor-rugation of the plane,with V ions displaced alternately ±0.625˚A perpendicular to the plane in the direction of their apical O ion.The entire structure is shown in Fig.2.V ions,as well as apical ions (O2),remain equivalent by symmetry,but there are two other O sites.O1sites are near (±0.12˚A )the plane and are coordinated with three V ions,two on one plaquette and the third on a neighboring plaquette,all at 1.95-1.96˚A .O3sites remain in the plane at positions at the plaquette center,and are four-fold coordinated with V ions at 2.04˚A .The com-pound can be written descriptively as [CaV 4O14O24O3]2.The V,O1,and O2sites have no symmetry.The V ion lies within a tilted square pyramid of O ions (‘square’of O13O3,with O2apex),not far from the center of massof thefive O ions(Fig.3).Each V4plaquette is boat-shaped,with two corner V ions up and the other two down.Due to the corrugation,the V-V-V angle that would be180◦for a plane is reduced to130◦.FIG.2.Structure of CaV4O9,from Bouloux and Galy,il-lustrating the severe corrugation of the V-O layer.Unit cells in two successive layers are shown.FIG.3.5V ion ac-tually lies above the center of mass of thefive O ions.V-O bond lengths(˚A)are shown.The three V-O1lengths are inequivalent but nearly equal.We have applied the full potential linearized aug-mented plane wave(FLAPW)method[12,13]used in previous studies of magnetic transition metal oxide com-pounds.The sphere radii used infixing the FLAPW basis were chosen to be2.0,2.0,1.60,1.45,and1.60a.u. for Ca,V,O1,O2,and O3,respectively.Local orbitals were added to the basis set for extraflexibility and to al-low semicore states to be treated within the same energy window as the band states.For the V atoms,s,p,and d local orbitals were used,while for Ca and the O atoms s and p local orbitals were added.The plane wave cutoffcorresponded to an energy of19Ry.The total basis set size is3350LAPWs and local orbitals.An initial calculation without spin polarization found the O2p states to be centered6-7eV below the center ofthe V3d bands,and separated from them by a gap of2 eV.The lowest Ca-derived band bands arise from the3dstates,but lie above the V d bands and are inactive.The Fermi level E F lies low in V d bands,corresponding to ad1configuration.Thus the conventional ionic picture is well respected in this compound.To interrogate magnetic interactions,ferromagnetic (FM)and antiferromagnetic(AFM)alignments of the Vmoments were studied.The energy gain from polariza-tion is0.12eV/V ion.For FM ordering,an insulatingstate is obtained,as shown in Fig.4,so the moment ob-tained is precisely1µB per V.An insulating result wasnot anticipated from the non-polarized calculation:there was no gap in the d bands,so a rigid Stoner splitting ofmajority and minority bands would leave a metallic re-sult.The lowest lying V d orbital in the majority bands,which we show below to be the d x2−y2orbital,upon po-larization becomes separated from the remaining4d or-bitals,due to an exchange splitting∆ex that is stronglyorbital dependent.∆ex(d x2−y2)≈1.3eV is an unusually large value(LSDA exchange forces usually are less than1eV/µB),reflecting a weakly hybridized(and therefore more confined)d x2−y2orbital.∆ex is only about0.6eV in the center of the d bands and decreases to0.4eV at the top.The calculated gap in the majority bands is0.7 eV,and the gap between occupied majority and unoccu-pied minority bands is of the order of0.1eV.Correlations effects can only increase these gap values,perhaps sub-stantially.up downFIG.4.Majority(left)and minority(right)bands along high symmetry directions for FM aligned CaV4O9.The ma-jority d x2−y2is disconnected from other d states,leading to an insulating result.The spin density for this FM state,shown in Fig.5,is clearly that due to occupation of a single spin-orbital of V d x2−y2character,whereˆx andˆy refer to the lines of V ions.Due to the low V ion site symmetry the lobes do not point precisely in the direction of neighboring V ions nor lie exactly in the crystallographicˆx−ˆy plane,but these‘misalignments’are only a few degrees.These spin-orbitals are non-bonding with respect to the neighboring O ions,a point we return to below.This occupied orbitalis notof the type (d xy ,d yz ,d xz )anticipated in previous work,[4,8]or used by Marini and Khomskii for orbital ordering (d xz or d yz ).[11]Note that this orientation is determined by the crystal field,and is unrelated (at least for this narrow band system)to the FM order.The chosen AFM order was of the N´e el type:each V spin is antiparallel to its two neighbors on a plaquette and to the neighbor on the next plaquette.This type of order breaks inversion symmetry,and all V ions on one side of the (idealized V-O)plane have the same spin direction.This ordered state is essentially degenerate with the FM alignment.[14]The resulting state is also insulating,and as expected the occupied bandwidth is smaller (20%)than for FM alignment.FIG.5.Top view of an isocontour of the spin density ofFM aligned CaV 4O 9(truncated at the cell boundaries),il-lustrating the occupied d x 2−y 2V 4+spin orbital.The white spheres indicate oxygen sites,small dark spheres indicate Ca ions.The effective V d x 2−y 2−d x 2−y 2transfer integrals t ij are thought to be mediated via virtual hopping processes through the intervening O ions,with amplitudes t dpσand t dpπ.In the idealized VO parent layer the O ions lie at 45◦angles to the V-V nn direction.In terms of hop-ping processes,the nnn V ion is no more distant that the nn V ion and therefore should have comparable hopping amplitude,hence exchange coupling J .According to the Goodenough-Kanamori (GK)rules,[15]the hopping am-plitudes depend strongly both on the symmetry of the d and p orbitals involved and on the V-O-V angles.The first point to note is that this spin orbital is orthogonal (except for the φ≈5◦rotation)to the O p σorbital;hence the coupling must proceed through the p πorbital.This coupling involves only the t dpπ,which may be a few timessmaller than t dpσ.The p πorbital couples to the d x 2−y 2orbital on the nnn V (again via t dpπ).The p πorbital however is orthogonal to the d x 2−y 2orbital on the nn V (with respect to which it is a p σorbital).Thus the usual second order nn V superexchange coupling vanishes for the idealized layer.Due to the symmetry lowering distortions,this van-ishing is incomplete,and the surviving coupling may be larger than third order effects involving polarization of the O ion.[15]pdσhopping is allowed as t dpσsinφand pdπhopping is reduced to t dpπcosφ.The couplings be-comeJ nn ∝2t dpπcosφt dpσsinφ/(εd −εp ),(1)J nnn ∝t 2dpπcos 2φ/(εd −εp ),(2)where the factor of two arises from the two paths,and εd −εp ≈4-5eV is the energy separation between V d and O p states.Since sin φ≈0.1,an rough estimationgives J nnn /J nn ≈12·13.00)=25◦on both atomsbefore the overlap can be expressed in terms of the usual t ddσ,t ddπ,t ddδhopping amplitudes.Neglecting the lat-ter two,which at this distance should be much smaller than t ddσ,the effective hopping between the non-aligned d x 2−y 2spin-orbitals will go as t ddσcos 2θ,a reduction by cos 2θ≈0.8.It is not a straightforward matter to determine the relative importance of direct V-V hopping and V-O-V mixing that gives the dispersion pictured in Fig.4.The effect on the d bandwidth of the V-O-V coupling was probed by moving the O2ions from z c =0.75.This distortion brings the O2ion nearer one V but much farther from the other (2.6˚A ),essentially eliminated V-O1-V coupling of neighboring plaquettes.The resulting occupied d bandwidth of W d=0.4eV,compared to1.3 eV for the real structure,can be ascribed to direct V-V coupling.This result suggests that coupling through the O1ions is responsible for roughly23;i.e.direct V-V coupling is not negligible.This complex-ity arises specifically from the fact that the spin-orbitalis d x2−y2character,which greatly hinders coupling to Oions and maximizes V-V ing a coordina-tion number z c=3,the V-V bandwidth translates to ahopping amplitude t ddσ=W d/(2z c cos2θ)=80meV.The hybridization leading to magnetic coupling is re-flected in the spin density distribution on O ions neigh-boring V.The primary feature,in both FM and AFMalignments studied,is an antiparallel polarization of theapical O2by perhaps as much as0.2µB(the spin densityattributable to a given ion is not precisely defined).TheO2ion,however,is not involved in exchange coupling.The O1ions have moments about1[1]S.Taniguchi et al.,J.Phys.Soc.Japan64,2758(1995).[2]T.Ohama et al.,J.Phys.Soc.Japan66,23(1997).[3]K.Ueda et al.,Phys.Rev.Lett.76,1932(1996).[4]K.Sano and K.Takano,J.Phys.Soc.Jpn.65,46(1996).[5]M.Troyer et al.,Phys.Rev.Lett.76,3822(1996).[6]O.A.Staryk et al.,Phys.Rev.Lett.77,2558(1996).[7]M.Albrecht et al.,Phys.Rev.B54,15856(1996).[8]N.Katoh and M.Imada,J.Phys.Soc.Jpn.64,4105(1995).[9]M.P.Gelfand et al.,Phys.Rev.Lett.77,2794(1996).[10]J.-C.Bouloux and J.Galy,Acta Cryst.B29,1335(1973).[11]S.Marini and D.I.Khomskii,cond-mat/9703130.[12]S.H.Wei and H.Krakauer,Phys.Rev.Lett.55,1200(1985);D.J.Singh,Phys.Rev.B43,6388(1991).[13]D.J.Singh,Planewaves,Pseudopotentials,and theLAPW Method(Kluwer Academic,Boston,1994).[14]The AFM alignment had1.5meV/V ion higher energythan the FM alignment,probably within the convergenceof the calculation.[15]J.B.Goodenough,Magnetism and the Chemical Bond(Wiley,New York,1963),Chap.IIIC.。