Aberdeen Global - Asia Pacific Equity Fund 安本环球 -亚太股票基金
安本环球基金

安本環球基金公開說明書二O一O年四月* 本公開說明書中譯本僅供參考。
本公開說明書中譯本之內容與英文公開說明書若有歧異,以英文公開說明書之內容為準。
* 本公開說明書應與管理機構西元2009年1月7日及西元2009年4月2日出具之切結書併同閱讀。
目錄重要聲明 (3)詞彙表 (4)摘要 (6)安本的組織 (6)安本環球基金董事會 (7)ABERDEEN GLOBAL SERVICES S.A. 董事會 (8)行政與管理 (8)安本環球基金的主要特性 (10)主要合約 (12)基金資訊 (14)一般風險因素 (23)安本環球基金的股份交易 (26)收費及費用 (31)股息政策 (33)投資收益淨值的計算 (34)支付股息 (35)稅項 (35)股價之公告 (36)會議及報告 (37)備查文件 (37)附錄 A −投資限制 (38)附錄 B −資產淨值的計算 (44)附錄 C −一般資料 (47)附錄D−股份類別及股息 (53)附錄 E −首次申購費及管理費 (54)附錄F −透過模里西斯附屬公司投資 (55)附錄G −有關投資者之額外訊息 (58)本公開說明書應於申請股份前完整地閱讀。
如果您對本公開說明書的內容有任何疑問,應諮詢您的股票經紀人、銀行經理、律師、會計師或其他經授權的專業財務顧問。
董事們盡其所知及所信(各董事亦盡一切努力確保的確如此),本公開説明書所載資訊均以事實為依據且無忽略任何重大影響此等資訊重要性之內容。
據此,安本環球基金之董事就本公開説明書所載資訊負責。
本公開說明書所作的陳述是根據盧森堡大公國現行有效的法律和實務,並依其法律和實務變更。
安本環球基金獲授權為2002年法律第 I 部分項下可轉讓證券集體投資事業,並為合格之UCITS。
股份的發行僅根據目前公開說明書所載資訊及最新年度報告和帳目或中期報告和帳目(若比年度報告和帳目為新)所載之經審核之財務報表,以及安本環球基金後續未經審核之中期報告(之後若有發表),此等文件可於安本環球基金於盧森堡之註冊辦事處、全球及英國經銷商索得。
申万巴黎竞争优势股票型证券投资基金2010年第3季度报告

申万巴黎竞争优势股票型证1.5467
注:1)本期已实现收益指基金本期利息收入、投资收益、其他收入(不含公允
价值变动收益)扣除相关费用后的余额,本期利润为本期已实现收益加上本期公
允价值变动收益。
2)上述基金业绩指标已扣除了基金的管理费、托管费和各项交易费用,但不包
展望下季度,市场机会明显大于风险。一方面,临近年末,宏观调控将以稳 定为主,再出台超预期大力度紧缩政策的可能性较小;另一方面,10 月份召开 的十七届五中全会将为市场指引政策新方向。例如,促进经济结构调整政策的力 度、人民币升值幅度、对通胀的容忍度等。十二五规划的制定、实施,代表着中 国经济进入了新的阶段,市场将面临新的投资机遇。
§1 重要提示 基金管理人的董事会及董事保证本报告所载资料不存在虚假记载、误导性陈 述或重大遗漏,并对其内容的真实性、准确性和完整性承担个别及连带责任。 基金托管人中国农业银行股份有限公司根据本基金合同规定,于 2010 年 10 月 19 日复核了本报告中的财务指标、净值表现和投资组合报告等内容,保证复 核内容不存在虚假记载、误导性陈述或者重大遗漏。 基金管理人承诺以诚实信用、勤勉尽责的原则管理和运用基金资产,但不保 证基金一定盈利。 基金的过往业绩并不代表其未来表现。投资有风险,投资者在作出投资决策 前应仔细阅读本基金的招募说明书。 本报告中财务资料未经审计。 本报告期自 2010 年 7 月 1 日起至 9 月 30 日止。
AssicurazioniGeneraliS.p.A.InternationalFund...

Assicurazioni Generali S.p.A. International Fund Performance November 2015International Fund PerformanceAs our client, you have the opportunity to access an extensive range of top quality funds, hand-picked to maximise your investment opportunities. Most offer exciting potential for tax-efficient growth from a stable international location and each is managed by world-class professional asset managers. These funds range from the secure to those offering capital protection through to those aimed at the more adventurous client. In addition, each has been risk-rated to help you select the funds that most closely match your investment aims. A summary of each risk category is shown here. These funds are related to our full fund range of investment-linked assurance schemes and further details are available in our International Fund Selection Brochure.Past performance is not indicative of future performance. Investors and/or their investment advisers are responsible for their investment decisions and any choice of funds is entirely at their own risk. Please note that investment performance (as well as the income accruing to an investment) may go down as well as up. The performance figures are net of all fund charges but do not take account of any initial charge.These performance figures should be read in conjunction with the relevant principal brochure, as fees and charges will impact negatively on individual investment returns.Synthetic Risk and Reward ProfileIndustry StandardTo help you select the funds that best fit with your approach to risk, Assicurazioni Generali S.p.A. use the Synthetic Risk and Reward Indicator (SRRI)^.The indicator is calculated based on the volatility of the fund for the past five years and the values obtained are translated into one of the seven risk categories available based on pre-defined volatility intervals.^The ‘Synthetic Risk and Reward Indicator (SRRI) was defined in 2009 by the Committee of European Securities Regulators (CESR) with the aim of providing investors with a method of assessing an underlying fund’s risk. This SRRI calculation has been provided by Morningstar based on guidelines provided by the European Securities and Markets Authority (ESMA) and Morningstar’s interpretation, methodology and implementation of said guidelines.Risk ClassesLow number = Low volatility, High number = High volatilityNot all funds on the Assicurazioni Generali S.p.A. unit-linked fund range can be assigned a synthetic risk and reward indicator. This may occur where not all of the relevant calculation information is available. For example, if the fund is less than 5 years old, the annualised volatility over 5 years cannot be calculated. These funds are indicated with a ‘U’ symbol.Each fund on the unit-linked fund range has been assigned a risk category where possible. For example, funds with very low volatility will have a 1 or 2 rating on the risk scale. These funds generally have a more cautious approach with little or no exposure to equity markets and usually invest in cash or money market securities. You should be aware that for funds considered lower risk, the potential for reward will be lower as these funds are expected to yield lower returns than funds with a high equity exposure.*Funds marked with the symbol ‘U’ indicate that there is currently insufficient dataavailable to calculate an SRRI.Funds with high volatility will have a 6 or 7 rating on the risk scale. These funds tend to have a high exposure to less developed, emerging equity markets or use high risk alternative assets within their investment strategy. Over the long term, exposure to equity markets could provide the opportunity for higher investment returns however it also brings a higher degree of investment risk. Although investment gains could be made when markets are buoyant, losses can quickly occur when markets take a downturn. You must therefore be prepared not only for the potential for higher returns but also the potential for higher losses when investing in these types of funds.Risk ScaleYou should note that investment involves risk. Past performance is not indicative of future performance. Investors and/or their investment advisers are responsible for their investment decisions and any choice of investment options is entirely at their own risk. Please note that investment performance (as well as the income accruing to the investment) may go down as well as up.123456Lower riskHigher riskPotentially lower reward Potentially higherrewardSRRI7UPerformance US Dollar Converted %Euro Converted %Sterling Converted %Name ISIN Launch Date Bid CAG3M1Y3Y5Y CAG3M1Y3Y5Y CAG3M1Y3Y5Y Return Date Fidelity Global Dividend A ACC GB00B7FQHJ9730/01/2012158.30GBX12.880.23 4.5640.60-18.160.2518.5964.93-13.34 1.288.3146.67-31/10/2015 Fidelity Global Dividend A-Acc-USD LU0772********/05/201214.57USD11.38-1.02 3.1937.19-17.00-1.0017.0360.93-12.840.01 6.8943.12-31/10/2015 Jupiter JGF Global Equities L GBP A Inc LU042509434815/01/201013.75GBP 5.45-4.38-1.5119.6334.3810.35-4.3611.7140.3469.08 6.38-3.38 2.0324.8039.1231/10/2015 Jupiter Merlin Intl Equities L EUR Acc LU036274271905/09/200817.64EUR 4.46-3.47 1.7215.5921.708.26-3.4515.3735.5953.12 6.44-2.46 5.3720.5825.9931/10/2015 Jupiter Merlin Intl Equities L GBP A Inc LU036274298215/10/200818.97GBP7.63-2.72 1.6215.6821.9210.83-2.7115.2635.7053.409.52-1.71 5.2720.6726.2131/10/2015 Jupiter Merlin Intl Equities L USD Acc LU036274280014/04/200917.95USD9.35-3.130.9614.9221.6912.44-3.1114.5034.8053.128.75-2.12 4.5819.8825.9831/10/2015 Lloyds Multi Strategy US$ Gr Strategy GB00B0LG5T0014/10/2005 1.42USD 4.07-2.54 2.2334.7945.19 5.00-2.5215.9558.1182.68 5.47-1.52 5.9040.6050.3031/10/2015 M&G Offshore Global Basics X GB000370640413/11/20002,256.67GBX--4.55-6.99-7.70-7.27--4.53 5.498.2816.68--3.55-3.66-3.71-4.0031/10/2015 Parvest Equity World Utilities C C LU082342478217/05/2013150.26EUR 1.63-1.49-6.3321.8113.19 2.58-1.47 6.2442.8942.41 1.52-0.46-2.9727.0717.1731/10/2015 Threadneedle Global Eq Inc Retl USD Acc GB00B1Z2NC0727/06/2007 2.49USD 3.06-0.61 1.7226.3243.29 5.50-0.6015.3748.1780.29 6.280.42 5.3731.7748.3431/10/2015Equity RegionalAberdeen Global Asian Smaller Cos A2LU023*********/03/200639.10USD12.64-7.76-17.24-5.2710.7013.47-7.74-6.1311.1239.2913.82-6.80-14.27-1.1814.6031/10/2015 Aberdeen Global Asian Smaller Cos D2LU023*********/03/200625.43GBP13.05-7.38-16.70-4.6710.9013.94-7.37-5.5311.8339.5414.29-6.42-13.71-0.5514.8131/10/2015 Fidelity America Fund A LU004857356101/10/19909.04USD9.30-2.62 5.4763.2794.019.88-2.6019.6391.52144.1110.18-1.609.2670.32100.8431/10/2015 First State Asian Growth I Acc IE000836841105/08/199939.76USD8.87-2.620.2014.3232.628.72-2.6013.6534.1066.879.19-1.61 3.8019.2537.2931/10/2015 JPM America Equity A (dist) USD LU005366607816/11/1988146.39USD10.51-0.46 6.1556.4086.2210.62-0.4420.3983.46134.3011.190.589.9663.1592.7831/10/2015 Legg Mason Martin Currie GF North Am USD LU017448269409/06/200812.21USD 2.74-3.63 3.6545.0157.757.77-3.6117.5670.1098.49 6.23-2.637.3751.2763.3131/10/2015 Value Partners High-Dividend Stocks KYG93173105602/09/200274.02USD16.52-5.22 1.4922.1927.9115.50-5.2115.1143.3360.9316.55-4.24 5.1427.4632.4131/10/2015 Equity Single CountryBGF United Kingdom A2LU001184709131/12/198584.57GBP9.00-2.307.7925.3033.597.82-2.2922.2546.9968.098.76-1.2811.6630.7138.3031/10/2015 Fidelity Australia Fund A LU004857453606/12/199151.91AUD8.27-8.19-18.29-7.35 3.448.81-8.18-7.338.6830.158.99-7.23-15.36-3.357.0831/10/2015 Franklin Mutual Beacon A Acc $LU007030266507/07/199769.27USD 6.00-5.07-0.9235.5854.17 6.08-5.0512.3859.0593.98 6.50-4.08 2.6441.4459.6031/10/2015 Franklin Mutual Beacon A Acc €LU014036270731/12/200163.08EUR 4.84-5.17-0.3836.2855.17 3.22-5.1612.9959.8695.23 4.40-4.19 3.1942.1660.6331/10/2015 PropertyFidelity Global Property A LU023*********/12/200513.35USD 3.83-0.91 1.5524.9939.46 4.49-0.9015.1846.6275.46 5.070.12 5.2030.3944.3731/10/2015Alternative/HedgeMan AHL Diversified Futures Tranche A BMG5777T109912/05/199840.17USD8.28-3.04 6.3520.70-1.068.27-3.0220.6341.5924.498.64-2.0310.1725.91 2.4331/10/2015Specialist/ThematicFirst State Glbl Listed Infra I IE00B29SXL0227/06/200810.85USD 4.23-1.17-1.6328.5745.789.39-1.1511.5750.8183.427.90-0.14 1.9034.1150.9231/10/2015 Invesco Global Health Care C IE000382430103/03/1994144.07USD11.22-11.62 1.6966.48102.7411.37-11.6115.3495.29155.1011.08-10.70 5.3473.66109.8931/10/2015 Jupiter JGF Global Fincls L EUR Acc LU026230748002/11/200613.73EUR 1.93-6.68 4.7239.3425.72 3.59-6.6618.7763.4558.18 4.35-5.718.4845.3530.1531/10/2015 Jupiter JGF Global Fincls L GBP A Inc LU026230845402/11/200612.75GBP 1.40-5.88 4.8139.4619.68 3.05-5.8618.8863.6050.59 3.81-4.898.5845.4823.9031/10/2015Performance US Dollar Converted %Euro Converted %Sterling Converted %Name ISIN Launch Date Bid CAG3M1Y3Y5Y CAG3M1Y3Y5Y CAG3M1Y3Y5Y Return Date Pictet-Premium Brands P USD LU028*********/01/2007159.04USD 4.80-3.800.0221.1234.35 6.80-3.7813.4442.0869.047.86-2.80 3.6126.3539.0831/10/2015 Polar Capital Global Tech R EUR IE00B446852604/09/200920.52EUR14.32-0.16 6.9357.0358.1819.12-0.1521.2884.2099.0315.370.8810.7763.8163.7631/10/2015 Polar Capital Global Tech R GBP IE00B42N8Z5404/09/200914.67GBP14.20-0.22 6.8856.9558.1619.00-0.2021.2284.1199.0015.250.8210.7263.7363.7331/10/2015 Polar Capital Global Tech R USD IE00B433M74304/09/200922.66USD14.16-0.18 6.8956.9358.1318.97-0.1621.2384.0898.9615.220.8610.7263.7063.7031/10/2015 Templeton Emerging Markets A Acc $LU012852274414/05/200128.59USD 6.45-7.66-20.05-18.69-24.96 4.74-7.64-9.32-4.62-5.58 5.82-6.69-17.18-15.18-22.3231/10/2015 Templeton Global A YDis $LU002986442728/02/199133.64USD 5.90-5.85-2.4036.3239.71 6.54-5.8310.7059.9175.79 6.82-4.87 1.1142.2044.6331/10/2015 Templeton Global Euro A YDis €LU002987341026/04/199118.86EUR 6.20-6.00-2.2535.2042.15 6.24-5.9810.8758.6078.85 6.58-5.02 1.2641.0447.1631/10/2015Equity RegionalAberdeen Glb Latin America Eq A2LU0396********/07/20102,511.31USD-8.00-11.21-33.00-43.03-43.77-5.20-11.19-24.00-33.17-29.25-7.96-10.28-30.59-40.57-41.7931/10/2015 Allianz BRIC Equity AT EUR LU029*********/06/200779.58EUR 1.57-9.89-11.44-11.98-30.96 3.51-9.880.44 3.26-13.13 4.09-8.95-8.26-8.18-28.5331/10/2015 Allianz BRIC Equity AT USD LU029*********/02/2008 5.08USD-8.44-9.29-11.96-12.56-30.79-4.86-9.27-0.14 2.57-12.92-5.51-8.34-8.80-8.79-28.3531/10/2015 Alquity SICAV Alquity Africa M USD Acc LU072748999821/06/201282.63USD-5.52-10.46-29.27-24.30--1.73-10.44-19.78-11.21--5.13-9.52-26.73-21.04-31/10/2015 Baring ASEAN Frontiers A EUR Inc IE000486882801/08/2008147.76EUR 5.13-5.81-13.60-5.48-0.7610.22-5.80-2.0010.8724.878.75-4.83-10.49-1.41 2.7431/10/2015 Baring ASEAN Frontiers A GBP Inc IE00B3BC5T9005/08/2008106.08GBP 5.71-5.08-13.63-5.46-0.5710.77-5.06-2.0410.9025.119.21-4.09-10.53-1.38 2.9331/10/2015 Baring ASEAN Frontiers A USD Inc IE000083023601/08/2008162.80USD 5.05-5.46-14.19-6.08-0.7510.13-5.44-2.6710.1724.888.66-4.47-11.11-2.02 2.7431/10/2015 Baring Eastern Europe A EUR Inc IE000485210318/01/199957.21EUR8.55-2.39-22.06-31.81-43.098.86-2.37-11.60-20.01-28.398.98-1.37-19.27-28.87-41.0831/10/2015 Baring Hong Kong China A USD Inc IE000082923803/12/1982888.25USD15.31-5.28-0.2016.06-4.0014.20-5.2613.1936.1420.7915.53-4.29 3.3821.07-0.6231/10/2015 Baring Latin America A EUR Inc IE000485102230/04/199924.66EUR 6.42-11.15-32.46-38.27-48.07 6.14-11.14-23.40-27.59-34.66 6.69-10.22-30.04-35.61-46.2431/10/2015 Baring Latin America A USD Inc IE000082893305/04/199327.29USD 5.21-11.19-32.23-38.21-47.82 5.70-11.18-23.14-27.52-34.34 5.14-10.27-29.80-35.54-45.9831/10/2015 Deutsche Invest I Africa LC LU032975976410/07/200891.00EUR-6.00-8.54-25.92-39.81-42.34-1.28-8.52-15.97-29.40-27.45-2.76-7.59-23.26-37.21-40.3131/10/2015 Deutsche Invest I Africa USD LC LU032976107510/07/200867.08USD-5.32-8.92-26.33-38.37-40.22-0.57-8.90-16.45-27.71-24.78-2.06-7.97-23.69-35.71-38.1131/10/2015 Fidelity ASEAN A-Acc-USD LU026194555325/09/200618.83USD7.20-8.28-18.94-12.05-1.368.90-8.26-8.06 3.1724.119.67-7.32-16.03-8.25 2.1131/10/2015 Fidelity EMEA A Acc LU030382315611/06/200713.75USD 3.87-1.22-8.15 3.23 1.10 6.24-1.20 4.1821.0927.21 6.91-0.19-4.857.68 4.6631/10/2015 Fidelity Euro Blue Chip A Acc LU025*********/07/200615.12EUR 2.89-4.02 5.8931.1930.28 4.53-4.0020.1053.8963.92 4.87-3.029.6936.8534.8731/10/2015 Fidelity European Growth A LU004857879201/10/199014.18EUR9.54-6.20 1.3426.4121.9910.12-6.1814.9448.2853.4910.42-5.22 4.9831.8726.2931/10/2015 Fidelity Greater China A LU004858085501/10/1990167.70USD12.80-5.96-0.3428.3421.2513.39-5.9513.0450.5452.5613.71-4.98 3.2433.8825.5231/10/2015 Fidelity Pacific Fund A LU004911245010/01/199428.35USD 4.94-3.24-1.2239.1935.66 5.05-3.2312.0463.2770.69 4.79-2.23 2.3345.2040.4431/10/2015 First State China Growth I Acc IE000836874217/08/1999118.46USD16.48-4.97-5.6819.1812.6616.12-4.95 6.9739.8041.7516.73-3.98-2.3024.3216.6331/10/2015 GAM Singapore/Malaysia Equity VGG3716W101426/07/19852,190.28USD11.36-5.94-12.44-16.22-19.169.61-5.93-0.69-1.72 1.7211.02-4.96-9.30-12.60-16.3131/10/2015 Henderson Asia Pac Cap Growth A GB000768018328/09/1990693.70GBX9.75-3.59-10.70 5.12-1.0410.29-3.57 1.2923.3124.5210.60-2.58-7.499.66 2.4531/10/2015 HSBC GIF European Equity PD LU004747372221/08/200041.23EUR9.53-4.77 5.5927.6423.398.53-4.7519.7649.7355.259.36-3.789.3833.1527.7331/10/2015 Invesco Cont European Equity C IE003038224003/08/20019.47EUR9.39-5.88 3.5455.0541.518.56-5.8617.4381.8878.059.10-4.907.2661.7446.5031/10/2015 Invesco Cont European Sm Cp Eq C IE000370822313/01/1993220.90USD10.57-3.198.9258.9763.1710.86-3.1723.5486.48105.3010.56-2.1812.8365.8468.9131/10/2015 Invesco Pacific Equity C IE000360050302/09/199252.77USD10.01-3.09-4.3935.5428.1410.68-3.078.4459.0061.2310.73-2.08-0.9641.3932.6631/10/2015 JPM Emerging Europe Equity A (dist) EUR LU005175909904/07/199432.28EUR 6.70-3.73-21.05-32.26-44.457.22-3.71-10.46-20.54-30.11 6.69-2.72-18.22-29.33-42.5031/10/2015Performance US Dollar Converted %Euro Converted %Sterling Converted %Name ISIN Launch Date Bid CAG3M1Y3Y5Y CAG3M1Y3Y5Y CAG3M1Y3Y5Y Return Date JPM Europe Equity A (acc) USD LU011907822713/10/200017.64USD 3.88-4.44 1.7334.4534.14 2.16-4.4315.3857.7268.78 3.50-3.45 5.3840.2538.8731/10/2015 JPM Europe Small Cap A (dist) EUR LU005368707418/04/199465.83EUR10.18-1.4015.2761.2558.9310.33-1.3930.7489.1699.979.93-0.3819.4168.2164.5331/10/2015 JPM Europe Small Cap A (dist) GBP LU011909353113/10/200023.28GBP7.04-1.0715.7261.6559.33 5.26-1.0531.2589.62100.47 6.64-0.0419.8868.6364.9431/10/2015 JPMorgan ASEAN (acc) - USD HK000005555507/07/1983102.20USD8.49-6.85-15.33-6.15 3.677.24-6.84-3.9610.0930.448.48-5.88-12.29-2.107.3231/10/2015 JPMorgan Eastern (acc) - USD HK000005563901/02/1971261.28USD12.98-4.30-8.49 4.24-2.49--4.28 3.7922.2822.69--3.30-5.208.740.9531/10/2015 JPMorgan Greater China A (dist) USD LU011784178218/05/200131.12USD10.86-5.11-1.4524.1717.519.10-5.0911.7845.6547.8510.27-4.12 2.0929.5221.6531/10/2015 JPMorgan Pacific Securities (acc) - USD HK000005574626/05/1978261.52USD13.62-3.050.0720.6616.9313.07-3.0413.4941.5447.1214.11-2.04 3.6625.8721.0531/10/2015 Jupiter JGF European Gr L EUR Acc LU026008549217/08/200129.42EUR9.32-0.9617.8544.1461.487.89-0.9433.6769.08103.188.800.0722.0850.3667.1731/10/2015 Jupiter JGF European Gr L GBP A Inc LU032919049929/07/200822.31GBP7.93-0.3217.6242.8756.7313.18-0.3033.4167.5997.2111.700.7221.8549.0362.2531/10/2015 Jupiter JGF India Select L EUR Acc LU032907091524/05/201115.67EUR 4.72-6.967.0241.36-10.65-6.9521.3865.82- 5.83-5.9910.8647.46-31/10/2015 Jupiter JGF India Select L GBP A Inc LU032907105319/01/201013.39GBP 4.12-6.217.0041.688.248.86-6.2021.3666.1936.19 5.18-5.2410.8447.7912.0531/10/2015 Jupiter JGF India Select L USD A Inc LU036508990202/05/2008165.97USD14.84-6.71 6.1340.437.2216.74-6.6920.3864.7334.9016.24-5.749.9446.4910.9931/10/2015 Templeton Asian Growth A Acc $LU012852215714/05/200127.20USD10.59-10.23-24.70-19.17-21.148.82-10.22-14.59-5.18-0.779.94-9.30-21.99-15.68-18.3631/10/2015 Templeton Asian Growth A Acc €LU022*********/10/200524.70EUR 6.99-10.30-24.28-18.73-20.627.97-10.28-14.12-4.67-0.128.55-9.36-21.56-15.23-17.8231/10/2015 Templeton Asian Growth A YDis £LU022*********/10/200516.22GBP 6.96-10.02-24.54-18.88-20.827.93-10.00-14.42-4.84-0.378.52-9.08-21.83-15.38-18.0331/10/2015 Templeton BRIC A Acc $LU022*********/10/200511.95USD 1.79-6.79-18.76-18.76-37.95 2.72-6.77-7.86-4.71-21.93 3.28-5.81-15.85-15.26-35.7731/10/2015 Value Partners Classic C USD HK000026488415/10/200915.17USD7.14-6.07 5.7134.2514.7512.63-6.0519.9057.4844.388.06-5.099.5140.0418.7931/10/2015Equity Single CountryFidelity China Consumer A-Acc-EUR LU0594********/02/201116.99EUR 6.85-6.15-2.1632.88-11.98-6.1310.9755.87-8.00-5.17 1.3638.61-31/10/2015 Fidelity China Consumer A-Acc-USD LU0594********/02/201113.68USD 6.92-6.17-2.3632.43-12.05-6.1610.7555.35-8.07-5.19 1.1538.15-31/10/2015 Fidelity China Consumer A-GBP LU0594********/02/201114.31GBP 6.80-6.09-2.4432.41-11.93-6.0710.6555.33-7.95-5.11 1.0638.13-31/10/2015 Fidelity Germany Fund A LU004858000401/10/199047.76EUR7.99-1.0514.0244.5648.508.56-1.0429.3369.5886.848.86-0.0218.1250.8053.7331/10/2015 Fidelity Japan Fund A LU004858514401/10/1990190.60JPY 1.97-4.82 5.9627.1917.14 2.51-4.8120.1849.1947.39 2.80-3.839.7732.6721.2631/10/2015 Fidelity Japan Smaller Companies A LU004858760306/12/19911,909.00JPY 3.06-5.047.2947.1649.09 3.57-5.0221.6872.6387.58 3.74-4.0511.1453.5254.3431/10/2015 Fidelity Taiwan A LU007545860324/03/19979.83USD0.30-1.07-5.6828.3113.900.56-1.05 6.9850.5143.320.54-0.04-2.2933.8517.9231/10/2015 Fidelity UK Fund A LU004862171701/10/1990 2.63GBP 6.52-5.58 4.7338.8843.067.08-5.5618.7862.9180.007.38-4.598.4944.8748.1031/10/2015 Franklin US Opportunities A Acc $LU010*********/04/200012.34USD 1.36-5.087.0363.4480.410.43-5.0621.3991.73126.99 1.57-4.0910.8770.5086.7631/10/2015 Franklin US Opportunities A Acc €LU026086973901/09/200611.24EUR8.66-5.167.6064.3681.5710.43-5.1522.0492.80128.4611.17-4.1811.4671.4587.9731/10/2015 Franklin US Opportunities A YDis £LU022*********/10/20058.00GBP8.52-4.847.2664.2281.409.52-4.8221.6592.64128.2510.11-3.8511.1171.3187.7931/10/2015 HSBC GIF Chinese Equity AD LU003921743425/06/199281.52USD9.97-4.35 4.4120.52 5.8110.62-4.3318.4241.3833.1310.93-3.358.1625.729.5331/10/2015 HSBC GIF Hong Kong Equity PD LU001181785416/01/1987110.88USD10.54-5.73 1.0515.94 6.3110.39-5.7214.6236.0033.7610.47-4.75 4.6820.9510.0531/10/2015 Invesco Japanese Equity Core C IE003038268703/08/2001 1.99USD 3.07-2.939.8663.9933.53 2.12-2.9124.6092.3768.01 2.73-1.9113.8071.0738.2331/10/2015 JPMorgan India (acc) - USD MU0129U0000523/11/1989243.33USD13.10-4.67 2.3928.21 3.5112.98-4.6516.1450.4030.2413.15-3.68 6.0733.747.1631/10/2015 JPMorgan Indonesia (acc) - USD HK000005566201/11/200622.29USD9.32-7.74-22.20-24.95-16.8011.10-7.72-11.76-11.96 4.6911.91-6.78-19.41-21.71-13.8731/10/2015 JPMorgan Korea (acc) - USD HK000005571211/12/199145.37USD 6.61 3.37-3.86-1.33-5.167.13 3.399.0515.7519.337.32 4.45-0.41 2.93-1.8231/10/2015Performance US Dollar Converted %Euro Converted %Sterling Converted %Name ISIN Launch Date Bid CAG3M1Y3Y5Y CAG3M1Y3Y5Y CAG3M1Y3Y5Y Return DateOtherEmirates Islamic Global Balanced G JE00B3RT851714/12/201010.82USD 1.62-2.74-4.41 5.55- 5.70-2.728.4223.81- 2.08-1.73-0.9810.11-31/10/2015* Fund changed domicile from Guernsey to Luxembourg on 1st July 20081. Original Launch Date: 06th Feb 19952. Original Launch Date: 25th Jan 19853. Original Launch Date: 06th Apr 19944. Original Launch Date: 25th Jan 1985Assicurazioni Generali S.p.A. United Arab EmiratesLevel 6, Rolex Tower, Sheikh Zayed Road, Dubai, UAE, P.O. Box Number 5910.Tel:+971(0)43842100Fax:+971(0)43842111Email:*********************Assicurazioni Generali S.p.A. United Arab Emirates Registered (Registration Number 59) underUAE Federal Law No. 6 of 2007 and regulated by the Insurance Authority. Date of Registration: 13 December 1984.Please note that investment involves risks.The value of your investment is not guaranteed and can go down as well as up.N O V E M B E R ‘15。
合格境外投资者名录
215 216 217 218 219 220 221 222 223 224 225 226 227 228 229 230 231 232 233 234 235 236 237 238 239 240 241 242 243 244 245 246 247 248 249 250 251 252 253 254 255 256 257
宏利资产管理(香港)有限公司 野村资产管理株式会社 东洋资产运用(株) 加拿大皇家银行 英杰华投资集团全球服务有限公司 常青藤资产管理公司 达以安资产管理公司 法国欧菲资产管理公司 安本亚洲资产管理公司 KB资产运用 富达基金(香港)有限公司 美盛投资(欧洲)有限公司 香港金融管理局 富邦证券投资信托股份有限公司 群益证券投资信托股份有限公司 蒙特利尔银行投资公司 瑞士宝盛银行 科提比资产运用株式会社 领先资产管理 元大证券投资信托股份有限公司 忠利保险有限公司 西班牙对外银行有限公司 国泰证券投资信托股份有限公司 复华证券投资信托股份有限公司 亢简资产管理公司 东方汇理资产管理香港有限公司 贝莱德机构信托公司 GMO有限责任公司 新加坡金融管理局 中国人寿保险股份有限公司(台湾) 新光人寿保险股份有限公司 普林斯顿大学 新光投信株式会社 加拿大年金计划投资委员会 泛达公司 瀚博环球投资公司 安耐德合伙人有限公司 泰国银行 科威特政府投资局 北美信托环球投资公司 台湾人寿保险股份有限公司 韩国银行 安大略省教师养老金计划委员会
得克萨斯大学体系董事会 南山人寿保险股份有限公司 SUVA瑞士国家工伤保险机构 不列颠哥伦比亚省投资管理公司 惠理基金管理香港有限公司 安大略退休金管理委员会 教会养老基金 麦格理银行有限公司 瑞典第二国家养老金 海通资产管理(香港)有限公司 IDG资本管理(香港)有限公司 杜克大学 卡塔尔控股有限责任公司 瑞士盈丰银行股份有限公司 海拓投资管理公司 奥博医疗顾问有限公司 新思路投资有限公司 贝莱德资产管理北亚有限公司 摩根证券投资信托股份有限公司 全球保险集团美国投资管理有限公司 鼎晖投资咨询新加坡有限公司 瑞典北欧斯安银行有限公司 嘉实国际资产管理有限公司 灰石投资管理有限公司 统一证券投资信托股份有限公司 大和住银投信投资顾问株式会社 毕盛资产管理有限公司 中信证券国际投资管理(香港)有限公司 太平洋投资策略有限公司 易方达资产管理(香港)有限公司 高瓴资本管理有限公司 永丰证券投资信托股份有限公司 华夏基金(香港)有限公司 宜思投资管理有限责任公司 第一金证券投资信托股份有限公司 太平洋投资管理公司亚洲私营有限公司 瑞银资产管理(香港)有限公司 南方东英资产管理有限公司 EJS投资管理有限公司 国泰君安资产管理(亚洲)有限公司 泰康资产管理(香港)有限公司 招商证券资产管理(香港)有限公司 现代证券株式会社
富达基金

The Best Overall Fund Management Firm (Asia Pacific ex-Japan) 2006, 2007, 2008 and 2009, Asia Pacific Survey 2006, 2007, 2008 and 2009 conducted by Thomson Extel Surveys. 2006、 2007、 2008及2009 Thomson Extel (亞太區)調查— 2006、 2007、 2008 及2009整體最傑出基金管理公司大獎—亞太區(日本除外)。 Fidelity, Fidelity International, and Fidelity International and Pyramid Logo are trademarks of FIL Limited. 「富達」及其標誌均為 FIL Limited的商標。
上海外资机构

澳大利亚新西兰银行(集团)有限公司上海分行银城东路101号森茂国际大厦39楼 68410111澳洲联邦银行上海代表处延安东路100号805室 63553939巴伐利亚洲银行上海分行张杨路838号华都大厦17楼 68766600巴黎银行上海代表处常熟路88号东艺大厦601室 62494303巴黎国民银行上海办事处茂名南路58号锦泰办公楼101-105室 64728762宝生银行上海分行北京东路668号宝生银行大厦 53088888比利时联合银行上海分行浦东大道1号中国船舶大厦15楼 58791599比利时通用银行上海代表处浦东银城东路101号29楼 68410404大华银行有限公司上海分行浦东南路528号上海证券大厦北塔2306室68810088道亨银行上海代表处河南南路16号6楼601室 63553197德国商业银行上海分行浦东南路855号世界广场二十五楼 58366666德国中央合作银行上海代表处中山东二路115号 63309842德累斯登银行上海分行世纪大道88号金茂大厦39楼 50495588德意志银行上海分行银城东路101号29楼 68410808东方汇理银行上海分行浦东大道1号船舶大厦1704-1707室 58795559东海银行上海分行浦东南路1111号 58306570东京三菱银行上海分行银城东路101号森茂国际大厦20楼 68411515东亚银行有限公司上海分行张杨路838号 58208583东亚银行有限公司上海分行浦西支行四川中路299号 63233626东洋信托银行上海代表处茂名南路205号1901室 64721394东洋信托银行株式会社上海驻在员事务所茂名南路205号19楼1901室64730850法国里昂信贷银行上海分行陆家嘴东路161号招商局大楼36楼 58870770 法国外贸银行上海分行陆家嘴路66号招商局大厦34楼 58875775法国兴业银行上海分行愚园路172号8楼 62497500福冈银行上海代表处延安西路2200号2010室 62194570富士银行上海分行银城东路101号7楼 68411000广岛银行上海代表处延安西路2200号 62752755国产业银行上海分行浦电路480号2801室(浦项大厦) 68751234韩国国民银行上海代表处娄山关路83号1003室 62701616韩汇银行上海分行浦电路480号(浦项广场27楼) 50810606韩亚银行上海代表处延安西路2067号仲盛金融中心1103室 62785108荷兰合作银行(中国)有限公司陆家嘴东路161号招商局大厦33楼 58889888 荷兰商业银行上海分行银城东路101号森茂国际大厦37楼 68413355荷兰万贝银行上海代表处银城东路101号森茂国际大厦29楼 68410421荷兰银行上海分行世纪大道88号金茂大厦28楼 50499303恒生银行有限公司上海分行浦东大道1号中国船舶大厦12楼 58821338横滨银行上海代表处茂名南路205号1411室 64725930花旗银行上海分行浦东大道1号中国船舶大厦20楼 58791200花旗银行上海分行浦西支行延安东路100号5楼 63289661华联银行有限公司上海分行世纪大道88号 50478200华侨银行上海分行东方路710号23楼 58200200华侨银行上海分行浦西支行九江路120号 63233888华一银行浦东南路360号新上海国际大厦底层 58881234加拿大国民银行上海代表处南京西路1376号上海商城东峰665A室 62798102 加州联合银行上海代表处福州路318号百腾大厦15层1506-1507室63912290捷克储蓄银行上海代表处淮海中路527号A楼901室 53060749静冈银行上海代表处延安西路2201号1813室 62098115罗马银行上海分行河南南路16号中汇大厦603室 63559010美国波士顿银行上海代表处南京西路1376号426室 62798090美国大通银行上海分行浦东银城东路101号森茂大厦31楼 68411828美国美洲银行上海分行浦东南路528号18楼 68818686美国运通银行上海代表处淮海中路222号力宝广场2313-2315室 53966090美联银行上海代表处浦东大道138号永华大厦18B 58795418名古屋银行上海代表处延安西路2201号1809室 62754207上海巴黎国际银行浦东南路528号证券大厦北塔13楼 58405500三菱信托银行上海代表处茂名南路205号瑞金大厦2404室 64726270三和银行上海分行浦西支行娄山关路85号东方国际大厦C座1408室62955858三和银行上海分行浦东大道1号中国船舶大厦16楼 58793818瑞士银行上海代表处延安西路2200号812室 62199208瑞士信贷第1波士顿银行上海分行浦东南路528号 68818418盘谷银行上海分行中山东一路7号 63233788纽约银行上海分行浦东大道138号永华大厦24楼C-D座 58796622纽约银行上海代表处乌鲁木齐北路457号朝代商务中心503室 62494110宁波国际银行上海分行浦东南路528号上海证券大厦北幢2203-2204室68818899。
汇丰代客境外理财计划–开放式海外基金型
汇丰代客境外理财计划–开放式海外基金型(仅适用于由“汇丰代客境外理财计划-贝莱德美林世界矿业基金挂钩”转入“汇丰代客境外理财计划–开放式海外基金型”的情形)海外基金基本信息 --贝莱德全球基金—世界矿业基金(适用于“汇丰代客境外理财计划-贝莱德美林世界矿业基金挂钩”的理财计划投参考编号: IPFD2004资货币为人民币的情况)(适用于“汇丰代客境外理财计划-贝莱德美林世界矿业基金挂钩”的理财计划投IPFD3004资货币为美元的情况)基本情况贝莱德全球基金—世界矿业基金A2类单位(彭博代码MIGWMFA LX)(“贝莱德基金”),为贝莱德全球基金的附属基金,以美元报价。
2008年4月28日,美林国际投资基金已更名为贝莱德全球基金。
贝莱德全球基金是一家注册在卢森堡的开放式伞型投资公司,具有“可转让证券集合投资事业(UCITS)”的资格。
贝莱德基金说明书本行不对贝莱德基金说明书以及贝莱德基金管理人以其他方式提供的有关贝莱德基金的内容和信息的真实、准确、完整性承担任何责任。
投资者获取本基本信息和/或贝莱德基金说明书应仅为获取本理财计划的参考信息的目的,本基本信息以及该说明书对投资者的提供并不代表投资者直接购买贝莱德基金的任何份额,也不代表本行或贝莱德基金管理人向投资者推销贝莱德基金的任何份额。
投资者可以购买的是以贝莱德基金表现为投资表现基础的本理财计划的单位份额。
贝莱德基金说明书可能被贝莱德基金管理人不时更新或修订。
本行及贝莱德基金管理人均不会也没有义务就任何该等更新或修订通知本理财计划的投资者。
投资目标寻求总投资回报的最大化。
其至少70%的净资产将投资于全球范围内主要经营活动是生产基本金属和工业矿产(比如铁矿和煤)的矿业和金属企业的权益证券,还可能投资于主要经营活动是与黄金或者其他贵重金属或者矿产有关的企业。
贝莱德基金不会直接持有黄金或者其它金属。
贝莱德基金管理人贝莱德(卢森堡)股份有限公司(BlackRock (Luxembourg) S.A.)是本理财计划投资的贝莱德基金的管理人,其通过授权BlackRock (Channel Islands) Limited为其投资管理人来为贝莱德基金提供投资管理服务,投资管理人会进一步指定投资顾问来进行基金的管理。
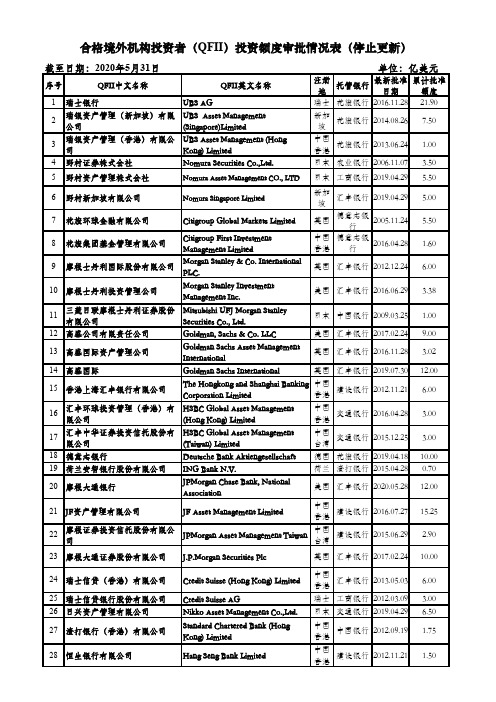
合格境外机构投资者(QFII)投资额度审批情况表(停止更新)
11 有限公司
Securities Co., Ltd.
日本 中国银行 2009.03.25
12 高盛公司有限责任公司
Goldman, Sachs & Co. LLC
美国 汇丰银行 2017.02.24
13 高盛国际资产管理公司
Goldman Sachs Asset Management International
Martin Currie Investment Management Ltd
中国 香港
建设银行 2012.01.20
英国 中国银行 2015.04.28
新加 坡
渣打银行 2014.03.28
英国 花旗银行 2016.08.30
46 淡马锡富敦投资有限公司
Temasek Fullerton Alpha Pte Ltd
3.38
1.00 9.00 3.02 12.00 6.00
3.00 3.00 10.00 0.70 12.00
15.25 2.90
23 摩根大通证券股份有限公司 J.P.Morgan Securities Plc
英国 汇丰银行 2017.02.24 10.00
24 瑞士信贷(香港)有限公司 25 瑞士信贷银行股份有限公司 26 日兴资产管理有限公司 27 渣打银行(香港)有限公司
3司
Kong) Limited
4 野村证券株式会社
Nomura Securities Co.,Ltd.
单位:亿美元
注册 地
托管银行
最新批准 日期
累计批准 额度
瑞士 花旗银行 2016.11.28 21.90
新加 坡
花旗银行 2014.08.26
7.50
- 1、下载文档前请自行甄别文档内容的完整性,平台不提供额外的编辑、内容补充、找答案等附加服务。
- 2、"仅部分预览"的文档,不可在线预览部分如存在完整性等问题,可反馈申请退款(可完整预览的文档不适用该条件!)。
- 3、如文档侵犯您的权益,请联系客服反馈,我们会尽快为您处理(人工客服工作时间:9:00-18:30)。
Calendar year performance (%)* 年度表現(%)*
Aberdeen Global - Asia Pacific Equity Fund 安本環球 - 亞太股票基金 MSCI AC Asia Pacific Ex Japan MSCI AC亞太 (日本除外) 本年至今/YTD 50.5 49.6 2008 -46.5 -51.6 2007 28.6 37.2 2006 27.4 33.2 2005 25.9 21.0 2004 17.0 23.0
AUGUST 2009 / 2009年8月
Aberdeen Global - Asia Pacific Equity Fund 安本環球 - 亞太股票基金
Important Information 重要資料 Investors are reminded that they are responsible for their investment decision and should not invest unless the intermediary who offers or sells it to you has advised you that it is suitable for you and has explained why, including how buying the fund would be consistent with your investment objective. l Investment in this fund may involve a high degree of risk and may not be suitable for all investors. Past performance is not indicative of future results. The value of the fund can be volatile and could go down substantially within a short period of time. It is possible that the entire value of your investment could be lost. l Please read the offering documents for further details and the risk factors, particularly the risk of investment in equities. l Investors should not make investment decision(s) based solely on this document. l 謹提醒投資者,其須對所作出的投資決定負責。同時,除非向 閣下推介或出售投資的中介人已向 閣下提出有關投資乃適合 閣下的意見,並已向 閣下闡明理由,包括買入有關基金將如何與 閣下的投資目標一致,否則 閣下不應作出投資。 l 投資於本基金可能涉及高風險,未必適合所有投資者。過往表現並非日後表現的指標。基金價值或有波動性及可在短時間內大幅下跌。 閣下有可能 失去全部投資價值。 l 請參閱銷售文件以了解詳情及風險因素,尤其是投資於股票的風險。 l 投資者不應單憑本文件作出投資決定。 Certain data in this document has been obtained from sources from third parties and is believed to be reliable but Aberdeen International Fund Managers Limited does not guarantee the accuracy of such data. This document has not been reviewed by the Securities and Futures Commission. 本文件所載若干資料乃取自認為可信的第三方資料,惟安本國際基金管理有限公司不就有關資料的準確性作出擔保。本文件並未經證券及期貨事務監察委員會審閱。
Performance (%) 基金表現 (%)
Source: Lipper 資料來源:理柏
Date of merger (24 Mar 2006) 基金合併日期-2006年3月24日
Sector breakdown 行業分佈
%
Financials 金融 Information Technology 資訊科技 Industrials 工業 Telecommunication Services 電訊服務 Materials 原材料 Consumer Staples 消費必需品 Energy 能源 Others 其他 Consumer Discretionary 可選消費品 Healthcare 健康護理 Utilities 公用事業 Cash 現金 Total 總 額 38.5 12.1 10.2 7.7 7.6 7.2 5.6 4.5 1.9 0.9 0.8 3.0 100.0
Further information 詳情請聯絡 General enquiry查詢: Fax 傳真: Dealing 交易部: Website 網址: +852 2103 4700 +852 2103 4788 +852 2103 4711
Awards 榮獲獎項
36 months of performance history as of the end 31 Dec 2005 for the Lipper Awards 2006. 截至2005年12月31日評估年度前36個月內基金表現。
*Where the fund invests in a Collective Investment Scheme managed by Aberdeen, we rebate the lower of the two levels of management fee. *倘本基金投資於安本管理的集體投資計劃,我們回扣的管理費以較低的 為準。
l
Investment objective 投資目標
The investment objective is “long-term total return to be achieved by investing at least two-thirds of the Fund’s assets in equities and equityrelated securities of companies with their registered office in Asia Pacific countries (excluding Japan); and/or, of companies which have the preponderance of their business activities in Asia Pacific countries (excluding Japan); and/or, of holding companies that have the preponderance of their assets in companies with their registered office in Asia Pacific countries (excluding Japan). The base currency of the Fund is US Dollars.” On 24 March 2006, the Aberdeen International Asia Pacific Fund has merged with Aberdeen Global-Asia Pacific Fund. On 1 October 2008, the fund name has been changed from Aberdeen Global - Asia Pacific Fund to Aberdeen Global - Asia Pacific Equity Fund and the fund investment objective has been changed and is as set out in this document. 投資目標是「通過將本基金至少三分之二的資產,投資於在亞太區國家(不包括日本)設有註冊辦事處的公司﹔及/或在亞太區國家(不 包括日本)進行大部份業務活動的公司﹔及/或其大部份資產來自在亞太區國家(不包括日本)設有註冊辦事處的公司的控股公司所發行 的股票及股票相關證券,以獲得長期總回報。本基金的基本貨幣是美元。」 日,安本國際亞太股票基金合併於安本環球 於2006年3月24 - 亞太股票基金。於2008年10月1日,本基金的英文名稱已更改,惟中文 名稱不變,投資目標亦已經修訂,並已載於本文件。
Top ten holdings 十大投資
Country 國家
Aberdeen Global-Indian Equity Fund* Rio Tinto Oversea-Chinese Banking Corp Swire Pacific ‘B’ Standard Chartered Samsung Electronics (Pref) Jardine Strategic Holdings Singapore Telecommunications City Developments United Overseas Bank Total 總 額 Total no. of holdings 總持股量 India Australia Singapore Hong Kong Hong Kong South Korea Hong Kong Singapore Singapore Singapore
2006 Lipper Fund Awards HK Equity Asia Pacific Ex Japan - Best Fund over past 3 years 2006年度香港理柏亞太股票基金 (日本除外) -最佳基金3年大獎