雅思写作Task1饼状图考官范文(4)
雅思小作文饼图范文

雅思小作文饼图范文在雅思小作文中,饼图是一种常见的数据呈现方式。
接下来我们将会给大家提供一篇关于饼图范文的示例,希望能够帮助大家更好地理解和掌握这种写作方式。
饼图范文示例:The pie chart illustrates the proportion of different types of energy production in a certain country in 2018. Overall, it can be seen that the majority of energy production comes from fossil fuels, while renewable energy sources contribute a relatively small portion.Fossil fuels, including coal, natural gas, and oil, accounted for the largest share of energy production at 65%. Among them, oil was the most dominant, making up 35% of the total energy production. Natural gas and coal followed, with 20% and 10% respectively. This indicates that traditional energy sources still play a crucial role in meeting the country's energy demands.In contrast, renewable energy sources only contributed to 20% of the total energy production. Among them, hydroelectric power was the primary source, accounting for 15%. Meanwhile, wind and solar energy made up 3% and 2% respectively. Despite the growing global emphasis on renewable energy, it is clear that in this particular country, the reliance on fossil fuels remains significantly higher.Nuclear energy, on the other hand, made up the remaining 15% of the energy production. This suggests that while it is not as dominant as fossil fuels, nuclear energy still plays a substantial role in the country's energy mix.In conclusion, the pie chart provides a clear overview of the energy production composition in the given country. It highlights the dominance of fossil fuels, the relatively small contribution of renewable energy sources, and the significant role of nuclear energy. This information is crucial for policymakers and stakeholders in making informed decisions about the country's energy future.。
雅思写作-小作文-饼图(精选五篇)
雅思写作-小作文-饼图(精选五篇)第一篇:雅思写作-小作文-饼图雅思考试优秀作文范文:是否禁烟?Version 122 Some people claim that using tobacco has brought severe social problems and smoking should be banned.T o what extent do you agree with theabove statement?Introduction(56 words)Since the discovery of tobacco related to a number of health problems, an increasing number of people have called for prohibiting smoking.It is undeniable that still a considerable amount of smokers exist in this world.I would like to examine the advantages and disadvantages of smoking cigarettes as following and then offer my own opinion.Body1(95words) There are some advantages to taking tobacco.(topic sentence)First, tobacco industry contributes a great proportion of revenue to the nation.Extremely high taxation imposed on tobacco yielding and cigarette manufacturing has released the financial burden for both the government and the individual taxpayergeneration by generation.Second, the soothing effects of smoking has been confirmed by ordinary smokers;particularly those who have hard-brain-working jobs are in favor of it;they claim that smoking cigarettes can make them calm and stimulate brain cells to work more efficiently.Finally, cigarettes play an important role in social activities.Body2(106words)On the other hand, smoking demonstrates numerous negative effects.(topic sentence)Initially, nicotine may bring takers a number of diseases.Second-hand smoking also doesharm to your health.Moreover, hatred from non-smokers always grow against smokers hence some conflicts arise frequently.We then look at the statistics showing that thousands of fire accidents worldwide occur each year due to the litter of non-extinguished cigarette ends, not to mention the related deaths and st but not least, expenses have to be taken into consideration.Fine cigarettes are not cheap.If you get addicted to them, your daily amount of cigarette consumption will increase inevitably, emptying your pocket money.Conclusion(88words) After all, so far no direct evidence has been provided that smoking can definitely result in takers' death of lung cancer, and those fire accidents are the result of carelessness or irresponsibility of the smokers, not tobacco to be laid blames.Also, spending pocket money can never be considered as a financial burden.In addition, I suggest more restricted smoking areas be planned so as not to violate non-smokers' rights.After weighing the pros and cons of using tobacco, I, for one, am against the act to ban smoking.声明:本范文为赖老师专供无忧雅思作品,转载请注明作者和出处!范文仅供参考,切不可背诵,否则可能得非常低的分数,甚至0分。
雅思写作小作文范文 雅思写作饼状图pie chart 电力来源.doc
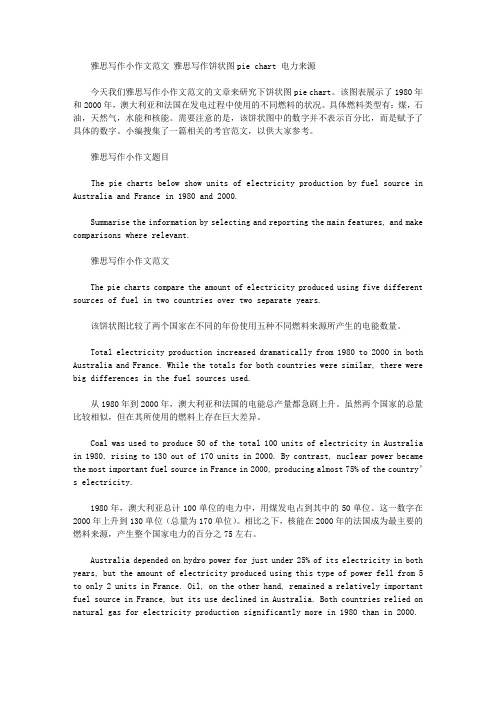
雅思写作小作文范文雅思写作饼状图pie chart 电力来源今天我们雅思写作小作文范文的文章来研究下饼状图pie chart。
该图表展示了1980年和2000年,澳大利亚和法国在发电过程中使用的不同燃料的状况。
具体燃料类型有:煤,石油,天然气,水能和核能。
需要注意的是,该饼状图中的数字并不表示百分比,而是赋予了具体的数字。
小编搜集了一篇相关的考官范文,以供大家参考。
雅思写作小作文题目The pie charts below show units of electricity production by fuel source in Australia and France in 1980 and 2000.Summarise the information by selecting and reporting the main features, and make comparisons where relevant.雅思写作小作文范文The pie charts compare the amount of electricity produced using five different sources of fuel in two countries over two separate years.该饼状图比较了两个国家在不同的年份使用五种不同燃料来源所产生的电能数量。
Total electricity production increased dramatically from 1980 to 2000 in both Australia and France. While the totals for both countries were similar, there were big differences in the fuel sources used.从1980年到2000年,澳大利亚和法国的电能总产量都急剧上升。
雅思小作文 饼状图

雅思小作文饼状图英文回答:The pie chart illustrates the percentage of various sources of energy consumed in a particular region during a specific year. The data is presented in a clear and concise manner, with each slice of the pie representing a different energy source.Upon examining the pie chart, it becomes evident that non-renewable energy sources dominate the region's energy consumption. Fossil fuels, including coal, natural gas, and oil, account for a substantial 80% of the total energy usage. This heavy reliance on non-renewable resources highlights the region's dependence on finite energy sources, which raises concerns about future energy security and environmental sustainability.In contrast, renewable energy sources play a relatively minor role in the region's energy mix. Solar and wind powercombined contribute a mere 10% to the total energy consumption. This low percentage suggests a lack of investment in renewable energy infrastructure and a reluctance to transition towards cleaner and more sustainable energy sources.Hydroelectricity stands out as the most significant renewable energy source, accounting for 5% of the region's energy consumption. However, this figure is stillrelatively low compared to the potential hydroelectric resources that the region may possess. The untapped potential of hydroelectricity presents an opportunity for the region to increase its reliance on renewable energy and reduce its dependence on fossil fuels.Overall, the pie chart provides valuable insights into the region's energy consumption patterns. The dominance of non-renewable energy sources raises concerns about the region's long-term energy security and environmental sustainability. The underutilization of renewable energy sources, particularly hydroelectricity, suggests a need for increased investment and a shift towards a more sustainableenergy future.中文回答:此饼状图展示了某个地区在某一年中各种能源消耗所占的百分比。
雅思写作Task1饼状图考官范文(4)

雅思写作Task1饼状图考官范文(4)The table below shows CO2 emissions for different forms of transport in the European Union. The Pie Chart shows the percentage of European Union funds being spent on different forms of transport.Write a report for a university lecturer describing the information in the graph below.Sample Answer:The given graphs provide information on the amount of Carbon dioxide emission per person from different vehicles in the European Union and also show the expenditures on different modes of transportations. As is observed from the given illustration, the highest amount of CO2 per person is emitted by the Air transports and European Union spends highest percentage of funds for the road transportation system.According to the bar graph, a single passenger of a personal cars emit around 130 gm of CO2 per kilometer while a passenger in a bus contribute to 65 gm of emission per kilometer. Coaches, maritime and rail passengers emit the lowest amount of CO2which is about 50 grams per passenger in a kilometer. Finally a single passenger of airplane contributes to 370 km of CO2 per kilo which is the highest amount of CO2 emission among the given transportations.Based on the pie chart, the European Union spent the highest amount (52%) on the road transportation system while spent only 1% or 2% on ports, waterway airport intermodal and other transport systems. They spent 31% on rail system and 10% on public transportation system. This indicates the European Union spent the majority of the budget on public transportations.In summary, Airplanes and personal car using passengers per person cause more CO2 emission than other mode of public transportation and European Union spend more on road and railways than other mode of transports.(Approximately 238 words)( This model answer can be followed as an example of a very good answer. However, please note that this is just one example out of many possible approaches.)。
饼图雅思英语作文
饼图雅思英语作文Pie charts are a common type of data visualization that represent the distribution of a categorical variable. They consist of a circle divided into sectors, with each sector representing a proportion of the whole. Pie charts are often used to show the relative sizes of different categories within a dataset.One advantage of pie charts is that they can easily convey the overall distribution of a categorical variable at a glance. The size of each sector is proportional to the percentage it represents, making it easy to compare the relative sizes of different categories. This can be especially useful when presenting data to a non-technical audience, as it allows for quick and intuitive understanding of the data.However, pie charts also have some limitations. For example, they can become difficult to read when there are too many categories, as the sectors become small and hardto distinguish. In addition, it can be challenging to accurately compare the sizes of different sectors, especially when they are similar in size. This can make it difficult to accurately interpret the data, especially when the differences between categories are small.In conclusion, pie charts are a useful tool forvisually representing the distribution of categorical data. They provide a quick and intuitive way to understand the relative sizes of different categories within a dataset. However, they also have limitations, such as difficulty in comparing small differences and becoming cluttered with too many categories. As with any data visualization, it's important to consider the specific characteristics of the data and the audience when deciding whether to use a pie chart.。
雅思剑桥部分Task1考官范文翻译
TEST2此图表显示在所列出的四个欧洲国家中,英国对图中所包含各种商品的花费最高。
对任一种商而言,英国人的相应花费都要比其它国人高出许多。
只在网球拍上,英国人和另一个国家意大利人消费相当。
相比之下,德国人消费额度最低。
在其对胶卷的消费上可见一斑,德国人远不如英国人对胶卷的花费。
德国只在两种商品上的消费高于法国,分别是网球拍和香水。
与此同时,法国和意大利两国居民大体上消费水平居中,平均额度也趋同。
具体来说,法国人对唱片和胶卷的消费要高于意大利人,然而对网球拍的消费不及意大利人。
意大利人对随身听的花费略高于法国,玩具消费则在两国人中等同。
数据清楚表明,欧洲国家之间的消费习惯存在巨大差异。
TEST3此数据表明了发展和发达国家对科教投入之间的差异。
就在校年数而言,我们可以看到在1980年,发达国家的人在校学习所用时间为8.5年,相比之下远远超过发展中国家的2.5年。
这一差距在1990年扩大,两个数据分别增至10.5年和3.5年。
在图表二中,趋势也是如此。
1980年至1990年,发达国家的科学家和技师的人数从每1000人中的55人升到85人,然而这一数据在发展中国家从12人升到20人。
最后,对研发项目的投资显示发达国家数据的不止翻了两番,从2000亿美元增长到4200亿美元,而发展中国家实际上有所削减,从750亿美元降至250亿美元。
总体上,我们可以看出两经济体之间不仅存在巨大差异,而且这一差异正在扩大。
IELTS4TEST1此表格对1999年澳大利亚不同类型的贫困家庭进行了分类。
平均来说,11%的家庭属于贫困家庭,其组成人数近200万。
然而,那些单亲或独身家庭几乎在此比例上翻了两番,分别为21%和19%。
夫妇家庭一般更为富有。
对丁克家庭而言,贫困比例(7%)较有孩子的家庭(12%)要低。
明显的是,那时对有孩子的家庭来说,其贫困比例要高于平均比例。
老年人的贫穷可能性较小,即使数据再一次倾向老年夫妇(仅4%),而不是单身老年家庭(6%)。
雅思写作小作文范文雅思写作饼状图piechart健康饮食.doc
雅思写作小作文范文雅思写作饼状图piechart健康饮食.doc雅思写作小作文范文雅思写作饼状图pie chart 健康饮食今天我们雅思写作小作文范文的文章来研究下饼状图pie chart。
该题目中共出现三张饼图,分别展示了碳水化合物、脂肪以及蛋白质在平均饮食、一般健康饮食、以及运动员健康饮食中所占的比例。
从中可以看出,碳水化合物占得比例越来越大,而蛋白质占得比例越来越小。
小编搜集了一篇相关的考官范文,以供大家参考。
雅思写作小作文题目雅思写作小作文范文The pie charts compare the proportion of carbohydrates, protein, and fat in three different diets, namely an average diet, a healthy diet, and a healthy diet for sport.饼状图比较了三种不同饮食中(平均饮食、健康饮食、以及专为运动员准备的健康饮食)碳水化合物、蛋白质和脂肪所占的比例。
It is noticeable that sports people require a diet comprising a significantly higher proportion of carbohydrates than an average diet or a healthy diet. The average diet contains the lowest percentage of carbohydrates but the highest proportion of protein.很明显,与平均饮食和一般的健康饮食相比,运动员需要的饮食中包含更多的碳水化合物。
平均饮食中的碳水化合物虽然较低,但蛋白质的比例最高。
Carbohydrates make up 60% of the healthy diet for sport. This is 10% higher than the proportion of carbohydrates in a normal healthy diet and 20% more than the proportion in an average diet. On the other hand, people who eat an average diet consume a greater amount of protein (40%) than those who eat a healthy diet (30%) and sportspeople (25%).碳水化合物构成运动员健康饮食的百分之60。
- 1、下载文档前请自行甄别文档内容的完整性,平台不提供额外的编辑、内容补充、找答案等附加服务。
- 2、"仅部分预览"的文档,不可在线预览部分如存在完整性等问题,可反馈申请退款(可完整预览的文档不适用该条件!)。
- 3、如文档侵犯您的权益,请联系客服反馈,我们会尽快为您处理(人工客服工作时间:9:00-18:30)。
雅思写作Task1饼状图考官范文(4)
本文为大家收集整理了雅思写作Task1饼状图考官范文(4)。
认真研读一定的雅思范文及作文模板可以帮助我们检验自己的写作水平,并能很好地吸收和应用优秀范文里的优秀内容。
The table below shows CO2 emissions for different forms of transport in the European Union. The Pie Chart shows the percentage of European Union funds being spent on different forms of transport.
Write a report for a university lecturer describing the information in the graph below.
Sample Answer:
The given graphs provide information on the amount of Carbon dioxide emission per person from different vehicles in the European Union and also show the expenditures on different modes of transportations. As is observed from the given illustration, the highest amount of CO2 per person is emitted by the Air transports and European Union spends highest percentage of funds for the road transportation system.
According to the bar graph, a single passenger of a personal cars emit around 130 gm of CO2 per kilometer while a passenger in a bus contribute to 65 gm of emission per kilometer. Coaches, maritime and rail passengers emit the lowest amount of CO2which is about 50 grams per passenger in a kilometer. Finally a single passenger of airplane contributes to 370 km of CO2 per kilo which is the highest amount of CO2 emission among the given transportations.
Based on the pie chart, the European Union spent the highest amount (52%) on the road transportation system while spent only 1% or 2% on ports, waterway airport
intermodal and other transport systems. They spent 31% on rail system and 10% on public transportation system. This indicates the European Union spent the majority of the budget on public transportations.
In summary, Airplanes and personal car using passengers per person cause more CO2 emission than other mode of public transportation and European Union spend more on road and railways than other mode of transports.
(Approximately 238 words)
( This model answer can be followed as an example of a very good answer. However, please note that this is just one example out of many possible approaches.)。