MapXtreme2005_67_ReleaseNotes
基于MapXtreme的河北煤炭资源储量管理信息系统
基于MapXtreme的河北煤炭资源/储量信息管理系统朱秀英,曹代勇中国矿业大学(北京)资源与安全工程学院,北京(100083)E-mail:xiuying77128@摘 要:在研究MapXtreme2004的特点和功能的基础上,利用.net编程环境和c#语言开发了河北煤炭资源储量管理系统。
主要实现了专题统计、缓冲区分析、属性查询等功能,为煤炭储量管理提供了科学的方法。
关键词:河北省,煤炭资源,信息管理系统,MapXtreme20041.引言河北省是我国大规模现代化开发煤炭资源最早的省份之一,开发河北煤炭资源/储量管理信息系统,利用现代信息技术加强煤炭资源/储量的科学管理,对于制定煤炭资源发展规划具有重要意义。
地理信息系统(GIS)的理论和技术近年来发展迅速、应用领域日趋广泛,GIS具有存储、分析、表达现实世界中各种对象的各种属性信息的功能,而且能够处理其空间定位特征,将其空间和属性信息有机结合起来,从空间和属性两方面对现实对象进行查询检索和分析,并将结果以各种直观的形式形象而准确地进行表达,并能进行多因素、多变量的综合分析[1]。
本文采用GIS技术建立河北省煤炭资源/储量信息系统,对收集的资料进行正规化、标准化整理,建立专业数据库;对各种有用信息进行采集、处理、存储、加工、传输、交换,再通过系统的分析、评价、预测,实现决策与管理的科学化与现代化,为煤炭资源/储量管理工作提供技术支撑。
2.数据库系统的设计和功能模块的开发2.1 开发平台河北省煤炭资源/储量信息系统选择MapXtreme 2004作为GIS平台。
MapXtreme 2004 是开发地图和可地图化应用程序的理想开发环境[2],其主要功能有:选择和搜索,主题地图,绘制标注,地理处理和分析,地理编码和路径规划等等。
2.2 数据库系统的设计GIS系统中涉及的数据包括图形矢量数据,空间属性数据和工程管理数据。
为了增强整个系统数据处理的灵活性,采用分开存储的方法。
荷马科技 Pentra DX Nexus 血液学分析仪说明书

Pentra DX NexusProcess efficiency in HematologyComfort•Large color touch scr een.•Intuitive interface with virtualkeyboard.Ergonomics•Smart access to all functionalities.•Enhanced visibility.•Compr ehensiveicons.External links•USB port for multi-data exchange and hardwareconnection.•120 samples per hour •28 parameters•Automatic r eflex testing •Automatic validation of results •Integrated cytology atlas •SPS evolutionPentra DX NexusBe productive and flexibleQuality•Complete traceability for each run including identification, lot number and expiration date on r eagents andcontrols.Compatibility•Compatible racks with most pr e-analytical systems and post analytical systems.•Two models ofracks.Environment•New laser source r equi re less space, r educing heat and noise.(1) Laser LED (2) Photomultiplier (3) Hyd r ofocalisation (4) Impedancemetry (5) Optical mesur ementHematopoiesisthroughPentra DX RangeSCIENTIFIC BOOKReference methods CBC DIFF RET NRBC Impedancemetry ••••Flow cytometry •••••y r t e m o r o u l F Cytochemistry ••••SS H D (1)(2)(3)(4)(5)LMNE matrixDHSS ConceptFull leukopoiesis analysis:Flow cytometry Injection of the sample prepared in a double hydrodynamic flowcytometer (HORIBA Medical patent),and determination of the cell complexity by measuring the absorbance of a polychromaticlight source, or the fluorescence by fluorocytometry (Diode type laser at 488 nm wavelength).CytochemistryIncubation of the sample at a regulated temperature andcells stained with Chlorazol Black.This reagent stains specifically leukocyte cytoplasm, granules,and nuclei.• Matu re populations 5 DIFF • Reduced slide r eview• Diagnostic and follow-up tool for rapid decision-makingErythroblastsFluorescence-based count:•Eryth r oblast analysis in r outine or r eflex mode based on:- inte r nal laboratory rules - detection alarms- patient demographics...•Use of Thiazole Orange fluo rochrome•Double Hyd r odynamic Sequential System (HORIBA Medical Patent)ReticulocytesDifferential diagnosis of anemia:• Classification and monitoring of anemia based on the Reticulocyte count and the CRC (Corrected Reticulocyte Count)• Follow-up of i r on-deficiency anemia based on the MR V (Mean Reticulocyte Volume)• Detection and monitoring of the eryth r opoietic r esponse accor ding to three stages of maturation: RET High, RET Medium, RET Low and maturation parameters (IR F , MFI, and MR V)Erythroblasts ReticulocytesRed blood cellsSPS EvolutionPerfect standardization of blood smears•Integrated slide-maker*120 slides per hourFully automated and secured process•Choice of staining protocolsMay-Grünwald Giemsa, W right, W right Giemsa,etc.•Sampling volume: 50 µl of whole blood (additional) On primary closed tube •Positive identificationBarcode r eadingPatient data printed automatically on slide •Smearing flexibilityUser-defined smearing pr ofiles based on the laboratory’s own rules*Optional moduleExpert validation station Results validation•Full management of samplesAlarms trigger ed accor ding to patient pr ofile Delta checkPr ogrammable r erun and r eflex test rules •Automatic validationStandardization of Lab rules (integrated catalog) Inte r national r ecommendation rules for Hematology r eview (ISLH,Laboratory Hematology11:83-90 © 2005 Car den Jennings Publishing Co.,Ltd.doi:10.1532/LH96.05019) integrate d in r outineAutomatic validation based on rules,flags,patient history,etc.•Integrated cytology atlas: HematovisionAid to accurate diagnosis supportExcellent education tool •Quality assuranceContr ol blood managementGraphical and table statisticsXB managementQCP Export (Quality Cont rol Program)Complete traceability (r eagents & cont rols) for eachrunPentra DX NexusT echnical SpecificationsPHYSICAL SPECIFICATIONSDimensions & WeightHeigh t W idth Depth W eightW ithout SPS73 cm120 cm55 cm110 kg28.7in47.2in21.6in242.5lbW ith SPS73 cm170 cm55 cm170 kg28.7in66.9in21.6in374 lb PrinterLaserThroughputUp to 120 samples/hour in CBC, DIFF,CBR, SPS modesUp to 60 samples/hour in DIR,ERB, CBE modesOperating temperature16- 34°C (61-93°F) room temperatureSpecimen volumeManual cycle 130 µLAutomatic cycle 200 µLPower requirementsPower supply from 100 V AC to 240 V AC (± 10%)50 Hz to 60HzPower consumption Pentra DX120 900 V AReagentsABX DiluentABX L ysebio(cyanide free)ABX FluocyteABX Leucodi ffABX BasolyseABX CleanerPARAMETERSCBCWBC RBC HGB HCT MCV MCH MCHC RDW PLT MPVDifferential LeukocytesNEU# & NEU% L YM# & L YM%MON# & MON% EOS# & EOS% BAS# & BAS% ReticulocytesRET%RET#RETH%RETM%RETL%IMM%CRC%IRF%MRV ErythroblastsERB%ERB#SOFTWARE SPECIFICATIONSData ProcessingColor LCD:12.1inCapacity:90,000 resultsOperating System: W indows XP Embedded™Pr ocessor:Genuine Intel1.60GHzRAM(Random Access Memory): 1 GBExter nal DVD/CD drive connected to instrument USB portRS232C, 5 X USB1User definedflagging limitsT ransmit patient & QC to LISMono & bi-di r ectional connectionsQuality Control Management48 selectable QC filesXB: 100 operator selectablefiles with statistics (20 samples per file) W ith-in runLevey-Jennings graphsLogsReagents,quality cont r ol,calibration,maintenance, user, settings,communication, err ors,blanksPERFORMANCE DATALinearityParameters Standa rd UnitWBC0.1- 15010/mmRBC0.01 - 810/mmHGB0.65 - 24 g/dLHCT 1 - 67%PLT 6 - 190010/mmPLT (platelet concentrated) 6 - 280010/mm Precision:Parameters Rang e Unit s% CV WBC 4.0-10.010/mm< 2 RBC 3.6-6.210/mm< 2 HGB12.0-18.0g/dL< 1 HCT36- 54% < 2 PLT150 - 50010/mm< 5 NEU%45 - 80%< 3L YM%25 - 50%< 5 MON% 2 - 10%< 10 EOS% 1 - 5%< 20 BAS%0.5-2.5%< 30CERTIFICATIONEN 61326: 2001IEC 61000-3-2: 2000IEC 61000-3-3: 2001IEC 61010-1: 2001IEC 61010-2-081: 2001IEC 61010-2-101: 2002CE 98/79/EC949 453 0500 • 888 903 5001/medical A D -0 4 0 9 1 3 -1 R e v . 1。
Mapxtremel

系统配置
监控中心工作站软件配置 序号 名称 1 Windows 95 或 98 中文版 Mapinfo Professional 4.5 中文版 2 以上 3 Mapinfo MapBasic
1. 维护工作站的数量由用户自定。 2. 假定工作站在局域网内
要求
工作站的硬件配置:PC 兼容机,PII266 以上,无特殊要求。
• 政府部门
– SAIC, Lockheed Martin, Booz Allen Hamilton
• Usage within organizations is growing
– Spatial is business-critical and useful to many
Web overcomes barriers to Spatial
MapXtreme NT
MapX Courier
Existing MapXServer Object or New MapXServer Object
HAHTsite or ASP MapXtreme Application
Request for an instance of MapX
MapXCourier creates an instance of MapX to be returned to the application
UI Persistence / State Mgmt
Server Side Application
Return HTML/
MapX
Map
Server
预制框架式解决方案
最大限度减少开发时间 客户可根据需要定制应用 通用的开发工具即可
MapObject IMS : 专门的开发工具
Xplore Integrated 图像和数据管理产品说明书
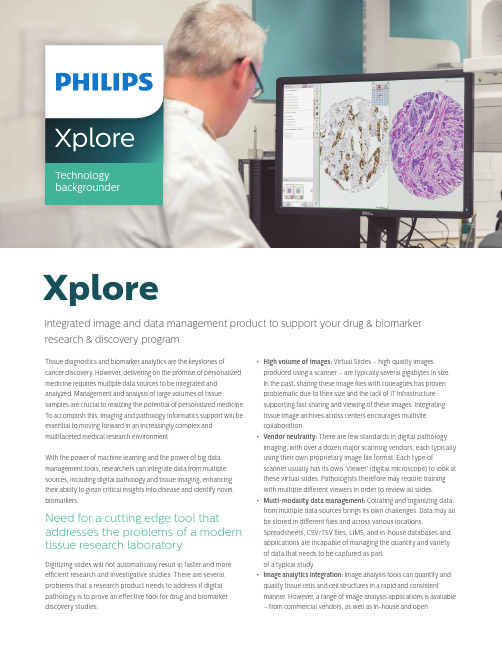
XploreIntegrated image and data management product to support your drug & biomarker r esearch & discovery programTissue diagnostics and biomarker analytics are the keystones of cancer discovery. However, delivering on the promise of personalized medicine requires multiple data sources to be integrated and analyzed. Management and analysis of large volumes of tissue samples are crucial to realizing the potential of personalized medicine. To accomplish this, imaging and pathology informatics support will be essential to moving forward in an increasingly complex and multifaceted medical research environment.With the power of machine learning and the power of big data management tools, researchers can integrate data from multiple sources, including digital pathology and tissue imaging, enhancing their ability to glean critical insights into disease and identify novel biomarkers.Need for a cutting edge tool that addresses the problems of a modern tissue research laboratoryDigitizing slides will not automatically result in faster and more efficient research and investigative studies. There are several problems that a research product needs to address if digital pathology is to prove an effective tool for drug and biomarker discovery studies.• High volume of images: Virtual Slides – high quality images produced using a scanner – are typically several gigabytes in size. In the past, sharing these image files with colleagues has proven problematic due to their size and the lack of IT infrastructure supporting fast sharing and viewing of these images. Integrating tissue image archives across centers encourages multisite collaboration.• Vendor neutrality: There are few standards in digital pathology imaging, with over a dozen major scanning vendors, each typically using their own proprietary image file format. Each type of scanner usually has its own ‘Viewer’ (digital microscope) to look at these virtual slides. Pathologists therefore may require training with multiple different viewers in order to review all slides.• Multi-modality data management: Collating and organizing data from multiple data sources brings its own challenges. Data may all be stored in different files and across various locations.Spreadsheets, CSV/TSV files, LIMS, and in-house databases and applications are incapable of managing the quantity and variety of data that needs to be captured as part of a typical study.• Image analytics integration: Image analysis tools can quantify and qualify tissue cells and cell structures in a rapid and consistent manner. However, a range of image analysis applications is available– from commercial vendors, as well as in-house and openXploreTechnology backgroundersolutions. Managing slides that are used in multiple applications and the data produced by their algorithms can be difficult, due to limited interoperability.• TMA management: Tissue microarrays (TMAs) provide the means for high-throughput analysis of multiple tissues and cells. The issues involved in collating, organizing and associating data with whole sections of tissue is multiplied with a TMA, as a single TMA slide may contain 200 cores, each potentially representing a different patient. A TMA study of a single 20x10 block, with five stains, three scoring criteria per stain and two reviewing pathologists will result in six thousand ‘scores’. Mapping these scores to different patients, comparing scores and results, and identifying trends across different cohorts will be time-consuming and prone to human error. Data mining tools, detailed in the next section, are required to solve the challenges of conducting large biomarker investigative studies.• Cross study data management: Given the range and volume of datamentioned in the points above, and the high quantity of slides thatmay be part of a typical study, the organizing slides in different ways,and maintaining a link with the aforementioned data, will provechallenging. Slides may need to be included as part of severalstudies. Studies may also be organized in many different ways.• Lab ecosystem: There are many different platforms and applicationsin a lab today and there is a need to ensure flexibility andinteroperability through and image management system that canprovide some context. Labs also have differing views on deploymentmethods for applications.Key design principles that allow a solution to these problemsTo address the problems listed above, Xplore was designed in conjunction with key opinion leaders from across the pathologyspectrum, to impact and accelerate tissue-centric discovery in drug and biomarker research. There are four key design principals that the solution adheres to.An Open solution, allowing institutions to use slides from multiple scanner vendors in a single Viewer, but also launch multiple image analysis vendors.A Flexible solution, providing institutions with tools to manage research the way you want, allowing you to design, organize, manage, search, and interrogate studies in a variety of ways.An Integrated solution, allowing institutions to store image, analytic data with slides both within and across studies, with search and datamining tools to help retrieve important data quickly.A Connected solution, bringing together researchers across an organization, across multiple sites and across geographies, amplifying the expertise of all those involved anywhere.Let us explore in detail how some of the issues highlighted earlier in the biomarker research process can be addressed through an effective tissue research product.View virtual slides in a single digital viewerOur Solution – the Xplore ViewerXplore supports all major scanning vendors in a single web-based viewer, thereby reducing training needs across multiple platforms. Both bright field and fluorescent slides are supported, in addition to z-stacking and multi-regions.Ve n dor Exte n sion Philips .isyntax / .tiffHamamatsu .ndpi / .ndpisLeica / Ariol .scnPerkin Elmer .qptiffAperio .svsVentana .bif / .tif / .svsZeiss .cziOlympus .vsiOmnyx .rtsSakura .svs3DHistec h .mrsxHuron .tif Mikroscan.svsTrestle .tifVendor Neutrality - Support for all major scanning vendorsXplore offers a range of tools that you would expect in a modern digital pathology viewer, including the following features,extremely important in a research setting, Annotation & Measuring tools, Split screen (Sync up to four whole slide images or TMA Cores), Fluorescent multi-channel image adjustments, Counting tools to assist validating image analysis algorithms, Screenshots and Z-Stack (switch between different planes).Manage and organize images and data in ascalable user centric mannerOur Solution – Flexible Folder, Study & Slide Management The Philips Xplore product can ingest thousands of images in seconds, provides a database for easily organizing Whole Slide Images (WSI’s), documents, image analysis and slide associated metadata within aflexible hierarchical structure. Users are assigned as owners of a particular study with permissions to share slides and data within and across teams of researchers.Xplore’s configurable study-based folder hierarchy makes a very flexible product for research. Xplore has no fixed study hierarchy,Xplore - Key design principlesallowing multi-disciplinary research.Slides can be included as part of multiple studies, without duplicating/multiplying the large file sizes on disk. Slides can also be added to a hierarchy of the researcher’s choosing, for example stain, body site, sample ID or case ID or principal investigator. Slides can therefore be better organized to meet the context/purpose of the study.Maintain metadata and third party dataOur Solution – Datasets, import, barcodes and documentsDatasets can be created with custom fields and metadata. Image analysis data can be uploaded into Xplore and easily searched or interrogated for biomarker evaluation, case selection and correlations.1D, 2D, Datamatrix support, allows metadata on the slide to be automatically added to the Xplore database on slide acquisition. Xplore also has an import facility, to associate additional information not included in the barcode with slides and studies using CSV or TSV files. Data can be uploaded against the slide name or by TMA core position/ID, or by information collected on the barcode, for example Sample ID.The document management system allows supporting research material, journals, publications and presentations to be stored alongside studies.Manage high volumes of slides, identify trends and outliers and create cohortsOur Solution – Precision SearchXplore’s Search engine allows user to identify cohorts, based on searching a range of data across folders and slides, or studies, slides, cores and scoring data in the case of TMA’s.Search across system generated fields, barcode metadata, clinical/image analysis data uploaded via CSV, and manual scoring data, to perform a deep and detailed analysis of any study managed in Xplore, and get a better understanding of how biomarkers are expressing themselves on different TMA cores, whole slides and therefore patients.Use the results of Search to create additional research studies; create charts from Search results to more easily spot trends and outliers; save for future use; or export data for use in other 3rd partyapplications.Conduct large biomarker investigative and evaluation studiesOur Solution – Comprehensive TMA moduleXplore’s TMA (Tissue Microarray) module is designed to speed up research studies that require manual scores of TMA cores, thereby helping evaluate new tissue biomarkers in TMAs quickly and ing scoring templates, map templates, and an automated TMA de-arrayer, TMA cores can be segmented, identified, and sent out for scoring. Patient information (managed through datasets), scoring criteria and the TMA Core tissue are available through a single interface. The TMA Core tissue is locked to the question(s) being asked upon it, so the user is unable to answer scoring questions on a TMA Core that is not visible on screen.Virtual TMAThe Virtual TMA module in Xplore allows selected cores from multiple recipient blocks to be combined in a single, score-able Virtual TMA Study.Given there are discrepancies or anomalies in the data that has been captured through image analysis or manual scoring,individual TMA Cores from one or more TMA Slides or TMA StudiesCross study data management - Example Folder & Study structures in XploreThe Xplore Search interface can build complex queries across multi-modality dataTMA Management - TMA Scoring interface in Xplorecan be segmented into a new, composite, ‘Virtual TMA’ study. This study can then be sent out again for scoring, but only providing the researcher with the TMA Cores that need to be scored, rather than the several hundred that may be on a single slide. This greatly increases the efficiency of getting selected TMA Cores re-scored.Easily identify trends and spot outliersOur solution – ChartsThe Charts tools in Xplore will help researchers and pathologists more easily quantify data, and help spot trends and outliers in Xplore. The results of a study or advanced search can be opened in a variety of charts. Tools for the researcher allow him or her to directly open the relevant data point to obtain a full breakdown of the data that has been captured against a whole slide or TMA core.By providing a charts and graphing facility within Xplore, the link with the virtual slide and therefore tissue is maintained. The process of matching a data point in a spreadsheet or other application with the original tissue can be extremely difficult, but Xplore allows the researcher to click a data point and open the tissue in the viewer within seconds.Integrate with multiple imageanalysis vendorsOur solution – Image Analysis agnosticXplore’s open product structure offers interoperability with offerings from third party image analysis vendors, such as Visiopharm OncoTopix. Xplore’s advanced search engine provides tools for cohort and training set selection, allowing researchers to launch slides and associated annotations in third party applications.Image analysis results can then be imported back into Xplore, providing a central repository for virtual slides, clinical, genomic and molecular data and image analysis results. As before, any data captured alongside the slide can be searched upon, allowing both image analysis and manual scoring data to be queried alongside patient information.Embed in the lab eco systemOur solution Flexible platform that integrates and brings together expertise Xplore embeds easily with a lab ecosystem through the use of current lab credential systems with a single sign on capability. Xplore supports both cloud and on premise deployments.Connect your team to a shared archiveOur solution – Web-based technology and advancedsystem architectureXplore enables knowledge sharing and expertise across multiple research studies and centres by providing tools for sharing studies with colleagues.Entire studies, or parts of a study, can be shared with one or more individuals. Different access levels can be provided, to allow for review of study results, or collaborative studies, in which multiple pathologists can score and annotate slides.What Next?Digitizing slides without providing tools to manage the images and associated data will not automatically lead to efficiencies in pathological research studies. Xplore sits at the center of a research pathology workflow. Xplore will continue to develop with the vision of becoming the centerpiece for pathology informatics and data integration across the spectrum of tissue-centricdiscovery.© 2020 Koninklijke Philips N.V.All rights are reserved. Reproduction or transmission in whole or in part, in any form or by any means, electronic, mechanical or otherwise, is prohibited without the prior written consent of the copyright owner.4522 207 41601 - January 2020Visit us on: /computationalpathology or /digitalpathologyScatter Chart in Xplore with clickable data-points linking to the Viewer to view the tissue in more detail。
Product Guide Table of Contents
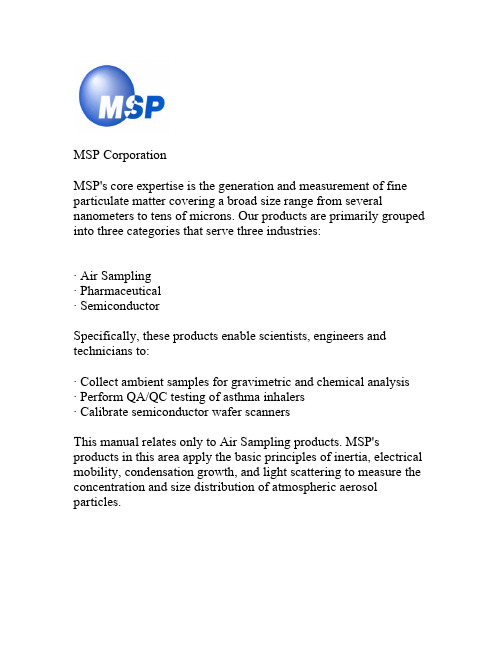
ACCURATE SIZE FRACTIONATION
Hale Waihona Puke MSP Corporation 5910 Rice Creek Parkway, Suite 300 Shoreview, Minnesota 55126 USA Tel: 651-287-8100 Fax: 651-287-8140 Email:Sales@
Model 110 Rotating MOUDITM
UNIFORM PARTICLE DEPOSITS
The MOUDITM is a 30 L/min, precision cascade impactor for collecting size-fractionated aerosol particle samples. Eight and 10 stage models allow the researcher to size-fractionate samples in the 0.18-18 µm and 0.056-18 µm ranges respectively. Using removable impaction substrates the user can collect multiple samples while working in the field. A rotating option for both models increases the uniformity of particle depositition for improved quantitative analysis. The advanced aerodynamic design of the MOUDI TM provides for sharp efficiency curves and low wall losses making data interpretation easy.
Xitanium FULL Prog LED Xtreme 驱动器数据手册说明书

Xitanium FULL Prog LED Xtreme driversXi FP 75W 0.3-1.0A SNLDAE 230V S240 sXt9290 021 28506Xitanium FULL Prog LED Xtreme driversPhilips Xitanium Full Programmable LED drivers are specifically designed to deliver the highest performance, protection and configurability.The portfolio offers both central and standalone dimming protocols further increasing the energy savings and CO 2 reductions achieved with LED lighting. The Xtreme technology ensures maximum robustness and protection combined with a very long lifetime.In this product family Philips introduces new drivers in a compact form factor with state-of-the-art features, which offer high value for both OEM customers and end-users. The products can replace the existing programmable outdoor LED drivers and will bring significant improvement in programming, assembly into a luminaire and electrical performance. Benefits•Ultimate robustness, offering peace of mind and lower maintenance costs•Fully programmable LED-drivers designed for the new digital and connected lighting world •Extended diagnostics via MultiOne•Easy to design-in, configure and install for Class I and Class II applications•Energy savings through high efficiency and via multiple dimming optionsFeatures•High surge protection (CM/DM)•Long lifetime and robust protection against moisture, vibration and temperature •Configurable operating windows (AOC)•Multiple control interfaces: DALI, AmpDim, 1-step and 3-step LineSwitch •Autonomous dimming via integrated DynaDimmer•Adjustable thermal protection for driver (DTL) and LED module (MTP)•Constant Light Output (CLO)•Adjustable Start-up Time (AST)•Adjustable Light Output (ALO)•End-Of-Life indicator (EOL)•Communication through mains via coded commands •Compliant per DALI Part 251/252/253 (select models)Application•Road and street lighting•Area lighting •Tunnel lighting•Industrial lighting April 2023Logistical dataSpecification item ValueProduct name Xi FP 75W 0.3-1.0A SNLDAE 230V S240 sXtEOC871869970573200Logistic code 12NC9290 021 28506EAN1 (GTIN)8718699705732EAN3 (box)8718699705749Pieces per box10Electrical input dataSpecification item Value Unit ConditionRated input voltage range202...254V ac Performance rangeRated input voltage230V acRated input frequency range47...63Hz Performance rangeRated input current0.36A@ rated output power @ rated input voltageMax. input current0.43A@ rated output power @ minimum performance input voltage Rated input power82W@ rated output power @ rated input voltageMinimum Power factor0.99@ rated output power @ rated input voltageTotal harmonic distortion7.5%@ rated output power @ rated input voltageEfficiency90%@ratedoutputpower@************************** Rated input voltage DC range186...250V dc Performance range, no external DC-rated fuse required Rated input current DC range0.3A dc Performance rangeInput voltage AC range80...264V ac Safety operational range, see MainsGuard graphInput frequency AC range45...66Hz Safety operational rangeInput voltage DC range168...275V dc Safety operational rangeStandby Power (no load)0.45WIsolation input to output DoubleElectrical output dataSpecification item Value Unit ConditionRegulation method Constant CurrentOutput voltage35...108V dcOutput voltage max.140V Maximum voltage at open loadOutput current0.07...1.05AOutput current min programmable300mAMin output current70mAOutput current tolerance ±3%@full loadOutput current ripple LF≤ 4%Ripple = peak / average @ < 3kHzOutput current ripple HF≤ 4%Output P st LM≤ 0.36In entire operating windowOutput SVM≤ 0.07In entire operating windowOutput power 2.5...75WElectrical data controls inputSpecification itemValueUnit ConditionControl methodAmpDim, Coded Mains, DALI,Dynadimmer, LineSwitch 3-step,LineSwitch single-stepOutput current amplitude dimming. Please refer to design-in guide at /oem for more controllability details.Dimming range 10...100%For latest DALI certification status please visit/products; LineSwitch: Vlow:< 160Vac Vhigh: 170 ... 264VacIsolation controls input to output Double acc. IEC61347-1Wiring and ConnectionsSpecification itemValueUnitTypeInput wire cross-section 0.2...1.5 / 24...16mm 2 / AWG solid / stranded wireInput wire strip length 8.5...9.5mm Output wire cross-section 0.2...1.5 / 24...16mm 2 / AWG solid / stranded wireOutput wire strip length 8.5...9.5mm Control wire cross-section 0.2...1.5 / 24...16mm 2 / AWG solid / stranded wireControl wire strip length 8.5...9.5mm Maximum cable length2.5m CISPR15: between driver and LED moduleMaximum NTC output cable length0.6mIsolationInsulation per IEC61347-1Mains + LineSwitchEQUILED + NTCDALIMains + LineSwitch -Double Double Basic EQUI Double -Basic Double LED + NTC Double Basic -Double DALIBasicDoubleDouble-Dimensions and weightSpecification item Value Unit Tolerance (mm)Length (A1)240.5mmMounting hole distance (A2)226.2mmWidth (B1)58.6mmWidth (B2)42.9mmHeight (C1)37.8mmMounting hole diameter (D1) 4.5mmWeight600gramOperational temperatures and humiditySpecification item Value Unit ConditionAmbient temperature-40...+55ºC Higher ambient temperature allowed as long as Tcase-max is notexceededTcase-max85ºC Maximum temperature measured at T case-pointTcase-life75ºC Measured at T case-pointMaximum housing temperature130ºC In case of a failure, inherent by designRelative humidity10...90%Non-condensingLifetimeSpecification item Value Unit ConditionDriver lifetime100,000hours Measured temperature at Tcase-point is Tcase-life. Maximumfailures = 10%Storage temperature and humiditySpecification item Value Unit ConditionAmbient temperature-40...+85ºCRelative humidity 5...95%Non-condensingProgrammable featuresSpecification item Available Default setting ConditionSet Adjustable Output Current (AOC)Programmable, SimpleSet700 mALED Module Temperature Protection (MTP)Yes OFFDriver Temperature Limit (DTL)Yes ONAdjustable Light Output (ALO)Yes OFFConstant Light Output (CLO)Yes OFFAdjustable Start-up Time (AST)Yes 1 sIntegrated Dynadimmer Yes OFF5-step, light turn-off possibleLineSwitch single-step Yes ONLineSwitch 3-step Yes OFFAmpDim Yes OFFMin Dim Level Yes10 %DC emergency (DCemDim)Yes ON Default: AOC = 15%. EOFx = 10 ... 60%. No external DC rated fuserequired. Internal fuse rating: T6.3A 250VAC/DC.End Of Life indicator (EOL)Yes OFFCoded Mains Yes OFFOEM Write Protection (OWP)Yes OFFDiagnostics Yes —FeaturesSpecification item Value ConditionOpen load protection Yes Automatic recoveringShort circuit protection Yes Automatic recoveringOver power protection Yes Automatic recoveringHot wiring NoSuitable for fixtures with protection class I and II per IEC60598Overtemperature protection Yes Automatic recoveringInrush currentSpecification item Value Unit ConditionInrush current55A Input voltage 230VInrush peak width200µs Input voltage 230 V, measured at 50% heightDrivers / MCB 16A type B≤ 11pcs Indicative value at 230VPlease refer to the driver design in guide if you use other MCB-types.If several mini circuit breakers are used directly side-by-side (without distance pieces)a correction factor of 80% has to be applied to the rated currentDriver touch current / protective conductor current / earth leakage currentSpecification item Value Unit ConditionTypical Touch Current (ins. Class II)0.3mA peak Acc. IEC61347-1. LED module contribution not includedTypical Protective Conductor Current (ins. Class I)0.18mA rms Acc. IEC60598-1. LED module contribution not includedSurge immunitySpecification item Value Unit ConditionMains surge immunity (diff. mode)6kV L-N, Ls-L, Ls-N, acc. IEC61000-4-5. 2 Ohm, 1.2/50us, 8/20us Mains surge immunity (comm. mode)10kV L/N/Ls - EQUI 10kV acc. EN61547; 8kV acc. IEC61000-4-5, 12 Ohm1.2/50us,8/20usControl surge immunity (diff. mode)0.9kV DALI - DALI, acc. IEC61000-4-5. 2 Ohm, 1.2/50us, 8/20us Control surge immunity (comm. mode)6kV DALI - EQUI acc. IEC61000-4-5. 12 Ohm, 1.2/50us, 8/20us Control surge immunity (comm. mode)8kV DALI - L/N/Ls acc. IEC61000-4-5. 12 Ohm, 1.2/50us, 8/20usApplication InfoSpecification item ValueApproval marks and Certifications CCC / CE / DALI 2 / Double-insulated Built-In / EAC / EL / ENEC / RCM / TISI / UA / UKCA / WEEEIngress Protection classification (IP)20Application OutdoorMounting Type Built-inGraphs Operating windowThermal GuardMains GuardPower factor versus output powerEfficiency versus output powerTHD versus output power©2023 Signify Holding, IBRS 10461, 5600 VB, NL. All rights reserved.UK importer address: Signify Commercial UK Limited, 3, Guildford Business Park, GU2 8XG.The information provided herein is subject to change without notice. Signify does not give any representation or warranty as to the accuracy or completeness of the information included herein and shall not be liable for any action in reliance thereon. The information presented in this document is not intended as any commercial offer and does not form part of any quotation or contract, unless otherwise agreed by Signify.Philips and the Philips Shield Emblem are registered trademarks of Koninklijke Philips N.V. All other trademarks are owned by Signify Holding or their respective owners.Date of release: April 13, 2023 v4/oem。
mapx学习笔记资料手册

MAPX学习使用笔记资料Mapxtreme 下面应该有三种图层一种是固定图层当你新建一个固定图层的时候会生成*.tab等文件一种是临时图层不生成*.tab文件一种是用户绘制图层用户自己使用CDC(Graphics)进行绘图如果你想对多边形进行编辑至少你要响应Mapxtreme的鼠标事件通过鼠标事件来确定当前用户在进行何种操作。
一般的过程是这样的:1.新建一个图层(建议临时图层或者用户绘制图层)2.根据多边形的点的位置绘制图元或者用CDC绘制过变形同时确定各个点在Mapxtreme地图窗口的位置建立各个点的鼠标响应区域3.通过鼠标落下的时候通过各个点的响应区域判断那个点被选中鼠标移动和抬起时要做响应的处理来改变多边形选中点的位置重重新给多边形的点赋值如果使用临时图层需要对临时图层里面的多边形图元的点参数进行更改如果是CDC绘图的话只要更改CDC绘图即可整个过程中需要考虑到地图坐标与Mapxtreme窗口坐标之间的转化。
{通过对象编辑工具,用户可以在地图图层中创建和修改图元。
有四种标准的对象创建工具:“添加点”、“添加线条”、“添加折线”和“添加区域”。
注:若要设置所使用的工具,请设置Map.CurrentTool 属性。
对象编辑工具将新图元添加到在Layers.InsertionLayer 属性中指定的任何图层中。
只能有一个插入图层,并且默认情况下是没有插入图层。
在没有任何插入图层时将当前工具设置为对象创建工具将导致错误。
MapX 还支持对现有地图图元的修改。
若要编辑图元,则对于您要更改的任何图层,必须将Layer.Editable 属性设置为真。
然后,可以使用内置的“箭头”工具,在当前选择中移动图元或调整图元的大小。
若要移动选定图元,只需单击并在选}lyrnew:CMapxLayer;ds: CMapxDataset;rvs: CMapxRowvalues;rv: CMapxRowvalue;ptNew: CMapXpoint;ftrNew: CmapXFeature;beginlyrNew := yers.item(1);ds := Map1.Datasets.Add(miDataSetLayer, lyrNew,emptyparam,emptyparam,emptyparam,emptypara m,emptyparam,emptyparam);//rvs := ds.Rowvalues[1].Clone ;rv:= CoRowvalue.Create;rvs:=CoRowvalues.Create;rv.Dataset:=ds;rv.Field:=ds.Fields.Item(1); //假设mi表有两个字段,填充之rv.value :='item1';rvs.Add(rv);rv.Field:=ds.Fields.Item(2);rv.value :='item2';rvs.Add(rv);ptNew:=CoPoint.Create;ptNew.Set_(map1.centerx, map1.centery);ftrNew := map1.FeatureFactory .CreateSymbol(ptNew,emptyparam);ftrNew := lyrNew.AddFeature(ftrNew, rvs); // 图元+属性,即feature+Rowvalues//ftrNew = lyrNew.AddFeature(ftrNew);//ftrNew.Update (True, rvs);end.作者/收集者:zlx开发环境:Delphi + MapX代码:MapX图元分三种类型:1、线(Line),即miFeatureTypeLine2、区域(Region),即miFeatureTypeRegion3、点符号(Symbol),即miFeatureTypeSymbol加入一个时钟控件,并在时钟控件中实现以下代码:procedure TMapFrm.tmFlashSelectTimer(Sender: TObject);varft: CMapXFindFeature;lyr: CMapXLayer;bExist: Boolean;i: Integer;str: String;ds: CMapXDataset;beginbExist := False;for i := 1 to yers.Count dobeginif yers.Item[i].Name = m_strSelLyr thenbeginbExist := True;break;end;end;if not bExist thenbegintmFlashSelect.Enabled := False;MsgFrm := TMsgFrm.Create(Self);MsgFrm.m_strMsg := Format('图层[%s]信息不存在!',[m_strSelLyr]);MsgFrm.ShowModal;MsgFrm.Free;Exit;end;lyr := yers._Item(m_strSelLyr);ds := mapCity.Datasets.Add(miDataSetLayer, lyr ,EmptyParam, EmptyParam, EmptyParam, EmptyPa ram,EmptyParam, EmptyParam);lyr.Find.FindDataset := ds;lyr.Find.FindField := ds.Fields.Item[1];str := Format('%d',[m_nSelID]);ft := lyr.Find.Search(str,EmptyParam);if ft.FindRC mod 10 <> 1 thenbegintmFlashSelect.Enabled := False;MsgFrm := TMsgFrm.Create(Self);MsgFrm.m_strMsg := Format('单位点[%s]信息不存在!',[m_strCorpName]);MsgFrm.ShowModal;MsgFrm.Free;Exit;end;case ft.type_ ofmiFeatureTypeLine:beginif ft.Style.LineColor = miColorWhite then ft.Style.LineColor := miColorRedelseft.Style.LineColor := miColorWhite;end;miFeatureTypeRegion:beginif ft.Style.RegionColor = miColorGreen then ft.Style.RegionColor := miColorRedelseft.Style.RegionColor := miColorGreen;end;miFeatureTypeSymbol:beginif not m_bFlashSel thenlyr.Selection.Replace(ft)elselyr.Selection.ClearSelection;m_bFlashSel := not m_bFlashSel;end;end;ft.Update(EmptyParam, EmptyParam);if not m_bCenter thenbeginm_bCenter := True;mapCity.CenterX := ft.CenterX;mapCity.CenterY := ft.CenterY;mapCity.Refresh;end;end;我这里是把选中的图元实现闪烁,并把图元居中实现图元闪烁的另一个方法:假设图元原大小是20,改变后大小是15if ft.Style.SymbolBitmapSize=20 thenft.Style.SymbolBitmapSize:=15elseft.Style.SymbolBitmapSize:=20;ft.Update(EmptyParam, EmptyParam);ft是symbol类型的代码名称:画多边形、直线1,画多边形,画线procedure TForm1.Map1PolyToolUsed(Sender: TObject; ToolNum: Smallint; Flags: I nteger; const Points: IDispatch;bShift, bCtrl: WordBool; var EnableDefault: WordBool);varStyle: CMapXStyle;f: CMapXFeature;begincase Flags ofmiPolyToolBegin: ;{ 某些用户开始使用 PolyTool.. }miPolyToolEnd:{ 用户通过双击完成 PolyTool 的使用 }if ToolNum = MY_POLYGON_TOOL thenbegin{ 它们使用 MY_POLYGON_TOOL!制作新的区域图元并将其添加到第一个图层 }Style := Map1.DefaultStyle.Clone;Style.RegionPattern := miPatternSolid;Style.RegionColor := 255;Style.RegionBorderColor := 0;Style.RegionBorderWidth := 2;Style.RegionBorderStyle := 1;{ 使用由事件为我提供的点。
INCA-QM-BASIC_V7.1.0_Release_Notes

INCA-QM-BASIC Add-on Release NotesCopyrightThe data in this document may not be altered or amended without special notification from ETAS GmbH. ETAS GmbH undertakes no further obligation in relation to this document. The software described in it can only be used if the customer is in possession of a general license agreement or single license. Using and copying is only allowed in concurrence with the specifications stipulated in the contract.Under no circumstances may any part of this document be copied, reproduced, transmitted, stored in a retrieval system, or translated into another language without the express written permission of ETAS GmbH. © Copyright 2013ETAS GmbH, StuttgartThe names and designations used in this document are trademarks or brands belonging to the respective owners.Contents1Introduction (4)1.1Definitions and Abbreviations (4)1.2References (4)1.3Conventions (4)1.4User Documentation (5)2Product Definition (5)2.1Functions at a glance (5)2.2General Description (5)2.2.1Safety Notice (5)2.2.2System Prerequisites (5)2.2.3Software Prerequisites (6)2.2.4Restrictions (6)2.2.5Miscellaneous (6)2.3Delivery (6)2.3.1Used 3rd Party Software (6)2.4Installation (6)2.4.1Installation Hints (6)2.5Licensing (6)3Changes (8)3.1What’s New (8)3.2Compatibility to Earlier Releases (8)3.3Fixed Problems (8)3.4Known Issue Reports (8)3.5Known Issues (8)3.5.1Software related Items (8)4Hints (9)5Hotfix Information (10)6Contact, Support and Problem Reporting (11)1IntroductionINCA-QM-BASIC is an add-on product to INCA, the ETAS product for measurement andcalibration. The INCA-QM-BASIC add-on provides in INCA the creation, view, editing andexchange of maturity information additionally to the calibration data.INCA-QM-BASIC supports the exchange formats PaCo V2.0 and CDF V2.0.1.1Definitions and AbbreviationsTerm/Abbreviation DefinitionCDF C alibration D ata F ormat: CDF is an ASAM standard that includes thefurther development of PaCo.CDM C alibration D ata M anagerEHI E TAS H elp Desk I nternationalHSP H ardware S ervice P ackHW HardwareKIR K nown I ssue R eport – For severe Problem Reports which occur after arelease, ETAS has introduced the Known Issue Report to inform affectedcustomer immediately. The current Known Issues of former versions canbe found on the ETAS website: /kirPaCo Pa rameter Co ntent: PaCo is an MSRSW standard adopted by ASAM andfurther developed within the CDF standard.PR Problem ReportQM-BASIC Basic package for Quality ManagementSW SoftwareWB Walkback: INCA system error1.2Referencesnone1.3ConventionsThe following typographical conventions are used in this document:Choose File O pen. Menu commands are shown in boldface.Click OK. Buttons are shown in boldface.Press <E NTER>. Keyboard commands are shown in angled brackets.The "Open File" dialog box is displayed. Names of program windows, dialog boxes, fields, etc. areshown in quotation marks.Select the file setup.exe Text in drop-down lists on the screen, program code, as wellas path- and file names are shown in the Courier font.General emphasis and new terms are set in italics.A distribution is always a one-dimensionaltable of sample points.1.4User DocumentationThe INCA-QM-BASIC user’s documentation is part of the INCA online help.2Product Definition2.1Functions at a glanceDuring the development of an ECU different teams work on different software functions inparallel. This means that calibration data has to be exchanged between calibration engineersor project teams. The ASAM standards PaCo and CDF V2.0 describe the maturity ofparameters or software functions in quality meta data (QMD) state information. The add-onINCAQM-BASIC allows creating, viewing, editing and transferring Quality Meta Data inaddition to the calibration data. The QMD describe the state of each calibration value andthe history of applied state changes. At the same time, this information can be defined forsoftware functions.The INCA-QM-BASIC add-on to INCA provides QMD handling and supports the exchangeformats PaCo V2.0 and CDF V2.0.•Support of Quality Meta Data (QMD) states and history•Storing of QMD states in XML files (PaCo1 or CDF2 format) and INCA datasets•Visualization of QMD states for functions and variables•Comparison of QMD states independent of value comparison2.2General Description2.2.1Safety NoticePlease respect the Safety Notice stated in the INCA Release Notes.2.2.2System PrerequisitesThe following minimum system prerequisites have to be met:Required Hardware 2 GHz Processor2 GB RAMDVD-ROM drive (for installation)Network adapterGraphics with a resolution of at least 1024 x 768, 256 MB RAM, 16bitcolor and DirectX 9Required Operating System Windows® XP SP3 (32bit) or higher,Windows® Vista SP1 (32bit) or higher,Windows® 7 SP1 (32 or 64bit) or higher. (INCA uses the 32bitcompatibility mode on a 64-bit operating system)(English, French, Japanese, Chinese and German OS version supported) Required Free Disk Space 1 GB not including the size for user data (absolute min. required, butnot recommended)The following system prerequisites are recommended:Recommended Hardware 3 GHz Quad-Core Processor or equivalent4 GB RAMDVD-ROM drive (for installation)Network adapterGraphics with a resolution of at least 1280 x 1024, 1GB RAM, 32bit colorand DirectX 9Recommended Operating System Windows® 7 SP1 64bit (INCA uses the 32bit compatibility mode on a 64-bit operating system)(English, French, Japanese, Chinese and German OS version supported)Recommended Free Disk Space >10 GBRecommendation on Performance Investigation on performance showed:-More Memory improves execution time of repetitive operations -SSD hard disks improve the file access times2.2.3Software PrerequisitesINCA V7.1 must be installed before the installation of the INCA-QM-BASIC add-on.2.2.4RestrictionsNone2.2.5MiscellaneousNone2.3DeliveryThe INCA-QM-BASIC software is delivered together with the INCA Software DVD. The DVDcontains an installation routine including INCA-QM-BASIC software, documentation, tools,utilities, and further information. All software documentation is available in the PortableDocument Format (PDF), which requires Adobe® Reader®. You find the installation link inthe Tools & Utilities directory on the installation DVD.2.3.1Used 3rd Party SoftwareThe 3rd Party Software used by INCA and its add-ons is listed in the document:Open_Source_Software_in_INCA_7.1.pdf2.4InstallationThe installation can be done via the user interface started by the DVD.2.4.1Installation HintsClose a running INCA before stating the installation.2.5LicensingINCA and INCA-QM-BASIC add-on are protected via electronic licensing. In order to run and use the products, a license file is required. The license needs to be installed via the ETASLicense Manager. The license manager is opened during the installation and can also be started at a later point as an external program located in the ETAS program folder in the Start menu. The license file can be obtained through a self service portal on the ETAS website by using the software entitlement you received during the order process or it is provided by your tool coordinator.3ChangesThis chapter describes changes with respect to the previous version of INCA-QM-BASIC Add-on V7.1.0.3.1What’s NewSee What's New slides of INCA.3.2Compatibility to Earlier ReleasesINCA-QM-BASIC Add-on V7.1.0 is compatible to earlier versions.3.3Fixed ProblemsThis section describes the set of fixed problems of the released version of INCA-QM-BASICAdd-on V7.1.0.Problem Number Title3.4Known Issue ReportsIf a product issue develops, ETAS will prepare a Known Issue Report (KIR) and post it onthe internet. The report includes information regarding the technical impact and status ofthe solution. Therefore you must check the KIR applicable to this ETAS product version andfollow the relevant instructions prior to operation of the product.The Known Issue Report (KIR) can be found here:/kir3.5Known IssuesThis section describes the set of known problems of the released version of INCA-QM-BASIC Add-on V7.1.0.3.5.1Software related ItemsProblem Number Title4HintsNone5Hotfix InformationNoneINCA-QM-BASIC Add-onRelease NotesPage 11 of 11 If printed, this document is an uncontrolled copy. Template: 00TE00156 V05 – released 6 Contact, Support and Problem Reporting For details of your local sales office as well as your local technical support team and product hotlines, take a look at the ETAS website:ETAS subsidiariesWWW: /en/contact.php ETAS technical supportWWW: /en/hotlines.php。
- 1、下载文档前请自行甄别文档内容的完整性,平台不提供额外的编辑、内容补充、找答案等附加服务。
- 2、"仅部分预览"的文档,不可在线预览部分如存在完整性等问题,可反馈申请退款(可完整预览的文档不适用该条件!)。
- 3、如文档侵犯您的权益,请联系客服反馈,我们会尽快为您处理(人工客服工作时间:9:00-18:30)。
1
新增内容
新增内容
MapXtreme 2005 的 6.7 版中有下列新特性。
AJAX 样本 Web 应用程序 制图增强 坐标系统增强功能 导出格式 经纬网图层 Windows Vista 中的 IIS 7.0 LegendControl 性能增强 支持的操作系统、数据库和浏览器 主题图性能和可用性增强 Workspace 管理器可用性增强
MapXtreme 2005 v6.7 发行说明
FeatureOverrideStyleModifier modifier = new FeatureOverrideStyleModifier(); modifier.Style = style;
FeatureLayer layeபைடு நூலகம் = yers["LayerAlias"] as FeatureLayer; layer.Modifiers.Append(modifier);
MapXtreme 2005 v6.7 发行说明
6
新增内容
如何对主题图应用半透明效果 可对主题地图应用半透明效果。下例所示的是对城市边界图层应用的范围主题。该图层位于其余图层的上面。
如果已启用半透明效果,则可为起始和结束主题范围(容器)选择半透明值,然后自动展开半透明色。这还会自动在起 始和结束主题容器之间展开透明色。例如,上图中主题起始容器(灰色)的透明度值为 75%,结束容器(红色)的透 明度值为 50%。由于此主题有 3 个容器,因此会自动将中间容器的透明度值设置为 63%(从 50 到 75 均匀分布)。
有关 AJAX 技术 和 MapXtreme Web 应用程序的更多信息,请参阅《开发人员指南》中的第 5 章:Web 应用 程序、控件和工具。
注: 必须在系统中安装 Microsoft 2.0 AJAX Extensions 1.0 才能使用 AJAXDemo 样本。这些文件可从 MapXtreme 2005 产品 CD 中找到。
用 API 添加半透明效果
如何向图层中添加半透明效果 以下 C# 代码样本所示的是如何通过 API 以编程的方式向图层中添加半透明效果。 // 从工作空间中加载地图: Map map = Session.Current.MapFactory.CreateEmptyMap(new Size(500, 500)); MapWorkSpaceLoader mapLoader = new MapWorkSpaceLoader("Workspace.mws"); mapLoader.AutoPosition = false; map.Load(mapLoader);
用 GDI+ 增强渲染效果之前:
用 GDI+ 增强渲染效果之后:
MapXtreme 2005 v6.7 发行说明
3
新增内容
此外还添加了半透明度滑块(TrackBarValuePicker 控件),以用于所有样式对话框(线样式、区域样式、符号样式、 文本样式等)。通过此控件可用滑块或数值选择框选取 0-100 之间的百分比值。但是,此滑块仅在启用半透明效果之 后才起作用。
选中启用半透明。 2. 选择要对其添加半透明效果的图层,将其移到列表顶部,然后添加样式覆盖。
3. 在样式覆盖的“可见性”选项卡中,单击特定于该图层中对象的样式按钮。对于此例,请单击区域样式按钮。
MapXtreme 2005 v6.7 发行说明
5
新增内容
将显示“区域样式”对话框。
4. 用半透明度滑块选择要应用的半透明度级别。每种颜色都有自身的半透明度级别。 上例中所示的还有类似于水印的半透明标注。如果禁止查看半透明城市边界区域,则标注将如下图所示:
MapXtreme 2005 v6.7 发行说明
2
新增内容
制图增强
已通过 GDI+ 半透明效果和抗锯齿效果增强渲染功能 Microsoft Windows GDI+ 是 Windows XP 操作系统或 Windows Server 2003 操作系统的一部分,用于提供二维矢量图 形、成像功能和版式。对于 Windows 图形设备接口(GDI,旧版 Windows 中的图形设备接口),GDI+ 已通过添加新 特性和优化原有特性得到改进。通过 MapXtreme 2005 中的 GDI+ 渲染功能可创建半透明标注、主题图和图层,此外还 可应用抗锯齿效果,以便在以较低分辨率呈现高清晰度转换时对线、曲线和区域边界的锯齿状边缘进行平滑处理。 可通过两个新属性(MapInfo.Mapping.DrawingAttributes 和 MapInfo.Mapping.LegendDrawingAttributes 这两个类中的 EnableTranslucency 和 SmoothingMode)启用该 API 中的 GDI+ 渲染功能。也可用 Workspace 管理器的图层控件中 新增的“样式”选项卡启用这些属性。
“帮助内容”窗格中) • 可以通过“开始”>“所有程序”菜单下的 MapInfo > MapXtreme 2005 v6.7 >
“学习资源”浏览器阅读 PDF 版本 • MapInfo 网站上的 PDF 版本的访问地址为 /
support/documentation/manuals.cfm#mapxtreme0405
本文档是对《MapXtreme 2005 开发人员指南》的补充。本次发行相关的信息请参 阅本文档,全面的产品信息和使用方法请参阅《开发人员指南》。《开发人员指 南》以三种格式提供,可从以下位置获取:
• MapXtreme 2005 产品包装盒中附带的印刷本指南 • 集成到 Visual Studio .NET 2003 和 Visual Studio 2005 中的 HTML 版本(在
MapXtreme 2005 v6.7 发行说明
4
新增内容
用 Workspace 管理器添加半透明效果
如何向地图中添加半透明效果 下图中含有半透明城市边界区域。此区域与 "Watervliet" 标注部分重叠,该标注未被覆盖的部分("Watervliet" 的前两个 字母)不同于该标注受到覆盖的部分。该标注本身在地图的其余部分也是半透明的。
MapXtreme 2005 v6.7 发行说明
Pitney Bowse MapInfo 公司总部: 电话:518 285 6000 传真:518 285 6070 销售热线:800 327 8627 政府销售热线:800 619 2333 技术支持:518 285 7283
// 启用半透明效果和抗锯齿效果: map.DrawingAttributes.EnableTranslucency = true; map.DrawingAttributes.SmoothingMode = MapInfo.Mapping.SmoothingMode.AntiAlias;
// 创建图元覆盖样式修饰符,以便用 50% 的半透明度 // 修改区域样式前景色: CompositeStyle style = new CompositeStyle(); ((SimpleInterior)style.AreaStyle.Interior).ForeColor = Color.FromArgb((int)(255 * 0.5), Color.Red); style.AreaStyle.Interior.Attributes = StyleAttributes.InteriorAttributes.ForeColor;
所有颜色的半透明效果均受支持,无论是已启用还是已禁用半透明效果,各种工具均可正常运行。虽然必须启用“启用 半透明”选项才能打印半透明光栅图像,但该选项对光栅图像的显示或导出没有影响(请参阅第 21 页的“半透明效果 打印”)。
注: 如果通过启用半透明效果和抗锯齿渲染质量较高的地图,尤其是在有三个或更多透明图层的地图中,则往往会 降低渲染速度。
2007 年 8 月
主题列表:
新增内容 . . . . . . . . . . . . . . . . . . . . . . . . . . . . . . . . . . . . . . . . . . . . . . . 2 发生变化的内容 . . . . . . . . . . . . . . . . . . . . . . . . . . . . . . . . . . . . . . . . 21 错误更正 . . . . . . . . . . . . . . . . . . . . . . . . . . . . . . . . . . . . . . . . . . . . . . 23 已知问题 . . . . . . . . . . . . . . . . . . . . . . . . . . . . . . . . . . . . . . . . . . . . . . 30 文档主题 . . . . . . . . . . . . . . . . . . . . . . . . . . . . . . . . . . . . . . . . . . . . . . 40
© 2007 Pitney Bowse MapInfo Corporation. 保留所有权利。MapInfo 和 MapInfo 徽标 都是 Pitney Bowse MapInfo Corporation 和 (或)其分支机构的商标。
发行说明中有关于对 MapXtreme 2005 v6.7 所作的增强和更新的信息。本文档还 涵盖了错误更正、已知问题以及《开发人员指南》印刷时未包含的其它信息。
要以编程方式更改颜色的半透明度,请使用 System.Drawing.Color.FromArgb() 方法。借此可为所需颜色指定 alpha 值 (在 GDI+ 中,alpha 通道是像素颜色数据中保留的用于存储半透明度信息那一部分)。有关更多信息,请参阅 .NET 文档,其访问地址为 /en-us/library/system.drawing.color.fromargb.aspx。