英语图表作文常用词句
图表作文最基本句型
对比基本句:1.The cost of food accounted for thelargest proportion.2.The money which was spent onfood accounted for the largest proportion.3.The amount of money spent on foodwas the smallest/least.主语和后面的形容词一定要匹配4.British consumers spent moremoney on all items than Germans.5.In all the classes, the number ofboys is larger than that of girls.6.The smoking rate of men wasslightly/significantly higher than that of women.7.The consumption of beef wasslightly higher than that of lamb in 1991, with250 and 230 grams respectively.8. The British spent the most money/the largest amount of money on all items.9. The proportion of people aged over 65 was the highest.修饰名词:1.形容词+ 名词2.名词+ 介词短语3.名词+ 定语从句4.名词+ 分词短语The amount of acid rain which is caused by car using is the largest.The amount of acid rain caused by car using is the largest.变化基本句:1.increase—rise—growincreased—rose—grewdecrease—decline—falldecreased—declined—fell动词+副词Slightly—marginally—微小/差距很小Considerably—remarkably—可观Significantly—substantially—极其1). The proportion of people over 65 years old increased significantly from 13% in 1991 to 40% in 2011.2). The number of high school graduates who attended the High Test decreased considerably from 3.5 million in 2011 to 3.2 million in 2015.2.词组短语1). …….saw a (形容词)increase/rise/decrease/fall—名词词性2). ……witnessed a (形容词) increase/rise/decrease/fall—名词词性3). ……showed a/an upward/downward trend……A: The cost of textbooks saw an obvious increase, rising from 200 yuan to 260.B: The percentage of families having only one child witnessed a dramatic increase from 23% in 1995 to 60% in 2015.C: The number of cars using clean energy showed an upward trend, increasing from350,000 in 2012 to 600,000 in 2015.3.特殊变化Double 增长一倍Triple 增长两倍Half—halved 减少一半1). The number of Chinese tourists who visited Japan and South Korea doubled over the ten years, rising from 1.5 million in 2005 to 3 million in 2015. 2). The number of wild birds in the US almost halved, declining from 5 million in 2010 to 2.7 million in 2015.基本介绍句和过渡句:1.The chart shows information about名词短语/疑问句(how….).例句:The chart give s information about expenditures on six kinds of consumer products in four different countries in 1992.2.These charts give data regarding thepopularity of three kinds of music between genders and among different age groups.3.The graph illustrate s how thepercentages of TV viewers and radio listeners changed during a period of 24 hours.4.These charts compare five countriesin terms of illiteracy rates of males and females in 1990.5.过渡句—It is obvious that 特征描述6.过渡句—We can also see from thechart that……7.先写出一个明显特征,然后再强调在某个方面/时间尤其明显。
雅思小作文饼图常用词汇、万能句型、范文整理
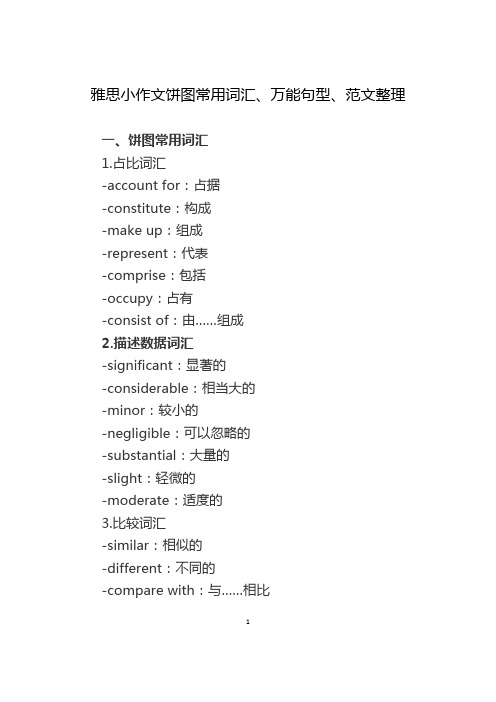
雅思小作文饼图常用词汇、万能句型、范文整理一、饼图常用词汇1.占比词汇-account for:占据-constitute:构成-make up:组成-represent:代表-comprise:包括-occupy:占有-consist of:由……组成2.描述数据词汇-significant:显著的-considerable:相当大的-minor:较小的-negligible:可以忽略的-substantial:大量的-slight:轻微的-moderate:适度的3.比较词汇-similar:相似的-different:不同的-compare with:与……相比1-in contrast to:与……形成对比-while:然而-whereas:然而-on the other hand:另一方面4.其他常用词汇-proportion:比例-segment:部分-percentage:百分比-distribution:分布-category:类别-sector:扇形二、饼图万能句型1.开头句型-The pie chart illustrates the proportion of categories in a specific field.-The pie chart provides information about the distribution of various segments.-The pie chart depicts the percentage of different categories in a given context.2.数据描述句型-Category A accounts for a significant proportion of the total, reaching XX%.-XX%of the total is occupied by CategoryB.emiring it the largest segment.2-Category C constitutes a considerable part, comprising XX%of the pie chart.-The proportion of Category D is relatively minor, only accounting for XX%.3.比较句型-In comparison with Category A, Category B has a higher percentage of XX%.-While Category A occupies XX%,Category B represents a larger proportion of XX%.-The distribution of Category C is similar to that of Category D, both comprising XX%.-In contrast to Category A, the percentage of Category B is significantly lower, at XX%.4.总结句型-Overall, the pie chart reveals a clear distribution of categories in the given field.-In summary, the majority of the pie chart is occupied by Category A, followed by Category B.-It can be concluded that Category C and Category D play minor roles in the overall distribution.三、实战演练题目:The pie chart below shows the main reasons for traffic accidents in a particular area. Summarise the3information by selecting and reporting the main features, and make comparisons where relevant.答案:The pie chart illustrates the main reasons for traffic accidents in a specific area. Upon analysis, several key points can be identified.First and foremost, the largest proportion of traffic accidents is caused by driver error, accounting for 45%of the total. This is followed by poor weather conditions, which constitute 25%of the accidents. Vehicle defects and road conditions each occupy 10%of the pie chart, while the remaining 10%is attributed to other factors.In comparison, driver error is the most significant factor, nearly doubling the percentage of poor weather conditions. Meanwhile, vehicle defects and road conditions share the same proportion, both comprising a minor part of the total.Overall, the pie chart reveals that driver error is the primary cause of traffic accidents in the given area, with poor weather conditions being the second most common factor. Other factors, such as vehicle defects and road conditions, play relatively minor roles in the overall distribution.4。
图表英语作文句子表达
图表英语作文句子表达1. 我需要写一篇描述图表和数据的英语作文,求一些常用的单词短语和句一、图表类作文常用的单词、短语和句型1. 表示数据变化的单词或短语 in the case of (在……的情况下) in terms of (在……方面)increase / raise / rise / go up(增加) decrease / grow down / drop / fall (减少) increased by (增长了) increased to (增长到)the number sharply goes up to(数字急剧上升至)significant(重大的),steady(平稳的),gradual(逐渐的),slow(慢慢的),stable(稳定的),rapid(快速的)…… 2. 表示从图表得知的信息的句型 The table / chart / graph shows that。
(这个图表告诉我们……)According to the table / chart /graph, we can see that。
(根据图表,我们可以看出……)It can be concluded from the graph that。
(从图表中可以得出……) The table shows the changes in the number of。
over the period from。
to。
(该表格描述了在……期间……数量的变化)二、图表类作文的模式图表类作文中的图表主要有以下形式:柱形图类(chart)、圆饼图类(pie chart)、曲线图类(line chart)、表格类(table)。
写文章时,首先要对图表加以描述,而后引出主题加以讨论,最后得出结论,也就是按照描述图表—解释原因—下结论的步骤来写。
切忌对图表不作交代就直接谈论主题。
1. 表格类作文的模式表格类作文一般可以分为三段:第一段对表格中的数据进行描述,只要抓住变化规律即可,切忌一一列举数据;第二段说明变化的原因;第三段得出结论。
英语六级图表作文模板及常用句型
英语六级图表作文模板及常用句型As is shown by the percentage in the picture X has been on rise/ decrease, X dramatically decreasing from X in X to X in X. From the sharp decline in the chart, it goes without saying that X.There are at least two good reasons accounting for X . In one hand, X .In the other hand, X is due to the fact thatX .In addition, X is responsible for X . Maybe there are some other reasons to show X .But itis generally believed that the above mentioned reasons are commonly convincing.As far as I am concerned, I hold the point of view that X . I am sure my opinion is both sound and well-grounded.英语六级图表作文常用句型1. 篇首As we can see from the chart/ As is shown in the table/ According to the table, the price of oil increased dramatically.The figures in the chart reflect that/ The statistics show that/The numbers in the graph reveal that people’s income has been increasing steadily.The graph suggests/shows/indicates/illustrates that there has been a sharp decline/rise in the population in this region.It’s clear/apparent that the output of this type of products is rising/dropping.2. 数据变化常用句型数据的增长The number of ….has grown steadily /has risen from / climbed / went sharply up /soared/ tends to go up / tends to increase….There was a rapid/sharp /dramatic/gradual/slowincrease/rise in the number of students.The number of students is on the rise/on the increase.数据的降低The number of … dropped steadily from / declined suddenly / fell/ tends to go down/ shows a tendency to decrease….There is a sharp fall/ gradual decrease/ sudden reduction / slow decline / drop ..in the number of ..in 2006.数据的持平In 2006, the number of … remain the same /steady /stable / constant /level.There was little change/hardly any change in the number of between …and …/There was a slight fluctuation in the number of ..from … to…表示比较级、倍数、比例关系be in direct ratio to/with 成正比 be in inverse ratioto/with 成反比have the largest percentage /proportion of 占比例the number of .. makes up /takes up / accounts for fifty percent of the total.占总量的50%Compared with…, … has a higher / lower percentage与。
图表作文常用词和例句

图表作文主体段介绍数据或描述变化趋势的常用词及例句动词部表示上升的动词go up (went up) increase (increased) rise (rose) grow (grew)其中rise和increase这两个词也可以作名词用。
另外“经历了一段上升的趋势/ 经历了一段下降的趋势”还可以用固定短语experience an upward trend / experience a downward trend来表达。
例句:It is expected to maintain this level until 2030, while the others should rise slightly after 2025.This rise was particularly noticeable between 1999 and 2002.National and international fixed line calls grew steadily from 38 billion to 61 billion at the end of the period.表示急剧上升的动词jump (jumped) shoot up (shot up) surge (surged) soar (soared)其中surge也可作名词用。
例句:The spending on research and development soared to 2.7 million pounds in 1990.表示下降的动词decline (declined) (decline不能用is / are + declined这样的被动形式)fall (fell) drop (dropped)dip (dipped) decrease (decreased)其中,decline, fall, drop, decrease这四个词也经常作名词用。
【英文写作:图表类经典高分句式】雅思托福四六级写作稳稳高分!
【英⽂写作:图表类经典⾼分句式】雅思托福四六级写作稳稳⾼分!【英⽂写作:图表类经典⾼分句式】背熟这50个句式,雅思托福四六级写作稳稳拿⾼分1.the table shows the changes in the number of...over the period from...to...该表格描述了在...年之...年间...数量的变化。
2.the bar chart illustrates that...该柱状图展⽰了...3.the graph provides some interesting data regarding...该图为我们提供了有关...有趣数据。
4.the diagram shows (that)...该图向我们展⽰了...5.the pie graph depicts(that)....该圆形图揭⽰了...6.this is a cure graph which describes the trend of...这个曲线图描述了...的趋势。
7.the figures/statistics show (that)...数据(字)表明...8.the tree diagram reveals how...该树型图向我们揭⽰了如何...9.the data/statistics show (that)...该数据(字)可以这样理解...10.the data/statistics/figures lead us to the conclusion that...这些数据资料令我们得出结论...11.as is shown/demonstrated/exhibited in the diagram/graph/chart/table...如图所⽰...12.according to the chart/figures...根据这些表(数字)...13.as is shown in the table...如表格所⽰...14.as can be seen from the diagram,great changes have taken place in...从图中可以看出,...发⽣了巨⼤变化。
图表作文的常用词汇

图表作文的常用词汇1. 表示上升rise, grow, climb, increase, jump, on the rise/ on the increase2. 表示下降fall, decline, descend, decrease, drop, on the drop/on the decrease3. 表示占比例account for, make up, occupy, rank4. 表示程度的副词sharply, drastically, dramatically, greatly, steadily, slowly, gradually图表作文的常用表达句式1. 描述图表内容●As can be clearly seen from the above graph, there’ s an obvious tendency with respect to …●According to the figures shown in the table/graph, we can see/conclude that…●As is shown/can be seen in the chart,… .●The table represents the development and changes in agriculture in the past 30 years. 2. 描述增减变化●Compared with the number of 1986, it still increased by 3899, with an increasing proportion 2%.●The number of … grew/rose slightly from … to …●There was a sudden/sharp/rapid decline in the number of … from … to …●The population amounted to 1,2000 million in 2000.●No increase is shown in 1988, then came a sharp increase of 8 million.●The number of … remained the same/dropped to … between … and …3. 原因分析句式●So far as I know, the tendency comes up as a result of the following factors.●Some driving factors that contribute to the above tendency may be summarized as follows.●There are several reasons for the increase/decrease… . First of all,…4. 预测趋势句式●As can be clearly seen from the above graph, there is an obvious trend with respect to… ●The tendency will inevitably give rise to some positive/negative effects as follows ●The above graphs makes it easy to draw a conclusion that…5. 描述时间●over the per iod from 1989 to 2002●during the past half century●in the 3-year spanning from 1995 to 1998●between 1999 and 2003图片作文●As is shown in the picture, …●In this cartoon, …●The set of drawings above vividly depicts…信函的写作建议信 A letter of suggestionDear John,You have asked me for my advice concerning … , and I will try to make some useful suggestions.…Yours sincerely, James推荐信 Recommendation for a positionDear Sir,It is my great pleasure to recommend to you, Mr./Ms. … , a former colleague of mine, wh o is currently applying for a position as a secretary in your company. … . Most outstanding ability is … / He has a good command of …I think the most important personalities are her loyalty and reliability, and these impressed me vividly.I appreciate pretty much any sincere consideration of him/her and hopefully, the opportunity you offer. If any further information is required, please feel free to contact me and I will be available at (address& time.Yours sincerely, James Smith求职信 Application letterDear Sir,Your advertisement in China Daily of July 4th for a secretary prompts me to offer you my qualifications for this position (I refer to your company ’ s advertisement for a computer engineering manager in the April 29 edition of the Bejing Review and attach a resume to support my application for the position. I am a graduate of Beijing University, majoring in Marketing and I have 10 years of successful experience behind me.I appreciate pretty much any opportunity for interview (I hope you will give me opportunity to talk with you in person (May I have the privilege of an interview? If you will let me know when it is convenient for you to see me, I will arrange my calendar accordingly. You may telephone me on my private line (6347541 if you prefer calling.Look forward to your prompt/ earliest reply.Yours sincerely, James Smith。
图表分析常用英语语句
Useful Words & Expressions for Interpreting Visuals图表分析常用英语语句一、描述上升趋势的用语an upturn 回升、好转趋势an upward trend 上升、好转趋势pick up/recover 好转/复苏rise slowly/gradually 慢慢地/逐渐地上升rocket/soar骤升move upward 上升,看涨leap 剧增spiral upwards 陡升、持续不断地上升sustain an increase 维持升幅reach a peak 到达最高点reach/come to 达到amount to 合计达rise/upturn/upsurge/soar/skyrocket 上升,向上趋势,高涨、二、描述下降趋势的用语spiral downward 剧降,持续不断地下降a significant reduction 显著的减幅fluctuate 波动bottom out/level out 降到最低点downward trend 下降move downward 下降,下落decline/decrease/fall 下降趋势drop slightly/gradually 轻微/逐渐下跌dwindle/shrink/drop 下降,降低,下跌slump/plummet/collapse/plunge/dive 暴跌/剧跌/崩溃/猛降/突降slide/slip 滑落/下滑三、描述平稳趋势的用语remain constant/stable 保持不变/稳定level off 趋势平稳reach a plateau 达到停滞或平稳阶段remain constant 保持不变stand at (数量)为(多少)四、描述上升和下降程度用语steeply 急剧地dramatically/sharply/markedly/substantially 鲜明地,显著地considerably 相当地a great deal 大量地,大幅度地rather 相当地somewhat 有一些,有几分slightly 稍微地五、各类线条和轴的名称solid line 实线dotted line 虚线broken line 断续线vertical/Y axis 垂直轴(Y)horizontal/X axis 水平轴(X)point 坐标(原点)graduator 刻度legend 图例color scheme 色调的搭配shaded area 阴影部分sedge/slice 扇形六、常用句型1. The rising momentum lasted for two years and started to level off in 2005.增长势头持续了2年,然后在2005年开始走平。
- 1、下载文档前请自行甄别文档内容的完整性,平台不提供额外的编辑、内容补充、找答案等附加服务。
- 2、"仅部分预览"的文档,不可在线预览部分如存在完整性等问题,可反馈申请退款(可完整预览的文档不适用该条件!)。
- 3、如文档侵犯您的权益,请联系客服反馈,我们会尽快为您处理(人工客服工作时间:9:00-18:30)。
一、图表作文写作常识1、图形种类及概述法:泛指一份数据图表:a data graph/chart/diagram/illustration/table 饼图:pie chart直方图或柱形图:bar chart / histogram趋势曲线图:line chart / curve diagram表格图:table流程图或过程图:flow chart / sequence diagram程序图:processing/procedures diagram2、常用的描述用法The table/chart diagram/graph shows (that)According to the table/chart diagram/graphAs (is) shown in the table/chart diagram/graphAs can be seen from the table/chart/diagram/graph/figures,Figures/statistics shows (that)……It can be seen from the figures/statisticsWe can see from the figures/statisticsIt is clear from the figures/statisticsIt is apparent from the figures/statisticsTable/chart/diagram/graph figures (that) ……Table/chart/diagram/graph shows/describes/illus trates how……3、图表中的数据(Data)具体表达法数据(Data)在某一个时间段固定不变:fixed in time在一系列的时间段中转变:changes over time持续变化的data在不同情况下:增加:increase / raise / rise / go up ……减少:decrease / grow down / drop / fall ……波动:fluctuate / rebound / undulate / wave ……稳定:remain stable / stabilize / level off ……最常用的两种表达法:动词+副词形式(Verb+Adverb form)形容词+名词形式(Adjective+Noun form)二、相关常用词组1、主章开头图表类型:table、chart、diagram graph、column chart、pie graph描述:show、describe、illustrate、can be seen from、clear、apparent、reveal、represent内容:figure、statistic、number、percentage、proportion2、表示数据变化的单词或者词组rapid/rapidly迅速的,飞快的,险峻的dramatic/dramatically戏剧性的,生动的significant/significantly有意义的,重大的,重要的sharp/sharply锐利的,明显的,急剧的steep/steeply急剧升降的steady/steadily稳固的,坚定不移的gradual/gradually渐进的,逐渐的slow/slowly缓慢的,不活跃的slight/slightly轻微的、略微地stable/stably稳定的3、其它在描述中的常用到的词significant changes图中一些较大变化noticeable trend明显趋势during the same period在同一时期grow/grew增长distribute分布,区别unequally不相等地in the case of adv.在……的情况下in terms of / in respect of / regarding在……方面in contrast相反,大不相同government policy政府政策market forces市场规率measure n.尺寸,方法,措施v.估量,调节forecast.先见,预见v.预测三、考研英语图表写作套句精选1.the table shows the changes in the number of……over the period from……to……该表格描述了在……年之……年间……数量的变化。
2.the bar chart illustrates that……该柱状图展示了……3.the graph provides some interesting data regarding……该图为我们提供了有关……有趣数据。
4.the diagram shows (that)……该图向我们展示了……5.the pie graph depicts (that)……该圆形图揭示了……6.this is a cure graph which describes the trend of……这个曲线图描述了……的趋势。
7.the figures/statistics show (that)……数据(字)表明……8.the tree diagram reveals how……该树型图向我们揭示了如何……9.the data/statistics show (that)……该数据(字)可以这样理解……10.the data/statistics/figures lead us to the conclusion that……这些数据资料令我们得出结论……11.as is shown/demonstrated/exhibited in the diagram/graph/chart/table……如图所示……12.according to the chart/figures……根据这些表(数字)……13.as is shown in the table……如表格所示……14.as can be seen from the diagram,great changes have taken place in……从图中可以看出,……发生了巨大变化。
15.from the table/chart/diagram/figure,we can see clearly that……or it is clear/apparent from the chart that……从图表我们可以很清楚(明显)看到……16.this is a graph which illustrates……这个图表向我们展示了……17.this table shows the changing proportion of a & b from……to……该表格描述了……年到……年间a与b的比例关系。
18.the graph,presented in a pie chart,shows the general trend in……该图以圆形图形式描述了……总的趋势。
19.this is a column chart showing……这是个柱型图,描述了……20.as can be seen from the graph,the two curves show the fluctuation of……如图所示,两条曲线描述了……的波动情况。
21.over the period from……to……the……remained level.在……至……期间,……基本不变。
22.in the year between……and……在……年到……期间……23.in the 3 years spanning from 1995 through 1998……1995年至1998三年里……24.from then on/from this time onwards……从那时起……25.the number of……remained steady/stable from (month/year) to (month/year)。
……月(年)至……月(年)……的数量基本不变。
26.the number sharply went up to……数字急剧上升至……27.the percentage of……stayed the same between……and…………至……期间……的比率维持不变。
28.the figures peaked at……in(month/year)……的数目在……月(年)达到顶点,为……29.the percentage remained steady at……比率维持在……30.the percentage of……is slightly larger/smaller than that of…………的比例比……的比例略高(低)。
31.there is not a great deal of difference between……and…………与……的区别不大。
32.the graphs show a threefold increase in the number of……该图表表明……的数目增长了三倍。
33……decreased year by year while……increased steadily.……逐年减少,而……逐步上升。
34.the situation reached a peak(a high point at) of[%].……的情况(局势)到达顶(高)点,为……百分点。
35.the figures/situation bottomed out in……数字(情况)在……达到底部。
36.the figures reached the bottom/a low point/hit a trough.数字(情况)达到底部(低谷)。
37.a is ……times as much/many as b. a是b的……倍。
38.a increased by……a增长了……39.a increased to……a增长到……40.high/low/great/small/ percentage.比低高(低)41.there is an upward trend in the number of…………数字呈上升趋势。
42.a considerable increase/decrease occurred from……to…………到……发生急剧上升。