Flow chart tool流程图绘制工具
使用Flow功能在Word中创建流程图和组织结构图

使用Flow功能在Word中创建流程图和组织结构图Microsoft Word是一个广泛使用的办公软件,它不仅可以用来编辑文档,还有一些强大的功能,如创建流程图和组织结构图。
在本文中,我们将介绍如何使用Word中的Flow功能来实现这些图表的创建。
首先,我们需要打开Word并创建一个新的文档。
在顶部的菜单栏中,我们可以看到一个名为“插入”的选项。
点击这个选项,然后在下拉菜单中选择“SmartArt”。
SmartArt是Word中的一个功能,它允许我们创建各种类型的图表和图形。
在SmartArt面板中,我们可以看到不同的图表类型,包括流程图和组织结构图。
我们可以根据需要选择其中一个类型。
如果我们选择了流程图类型,Word会自动创建一个空白的流程图,并在右侧的面板中显示相关选项。
我们可以在面板中添加文本框,以表示流程图中的不同步骤或节点。
我们可以通过单击面板中的“添加形状”按钮来添加新的文本框,并通过拖动和调整大小来调整它们的位置和大小。
除了添加文本框,我们还可以在流程图中添加箭头或连线,以表示不同步骤之间的关系。
我们可以通过单击面板中的“连接形状”按钮来添加箭头或连线,并通过拖动它们来连接不同的文本框。
在创建组织结构图方面,Word的流程图功能同样提供了很多便利。
我们可以使用组织结构图类型来创建一个具有层级结构的图表。
在面板中,我们可以添加不同的文本框来表示不同的职位或角色,并通过箭头或连线来表示它们之间的关系。
除了基本的文本框和箭头,Word的流程图功能还提供了其他一些高级选项。
例如,我们可以更改文本框的颜色和样式,以使图表更加美观。
我们还可以添加背景色和边框,以及调整箭头的样式和粗细。
在完成流程图或组织结构图的创建后,我们可以将其保存为Word文档或导出为其他格式,如PDF或图像文件。
这样,我们就可以方便地与他人共享或打印这些图表。
总之,使用Flow功能在Word中创建流程图和组织结构图非常简单。
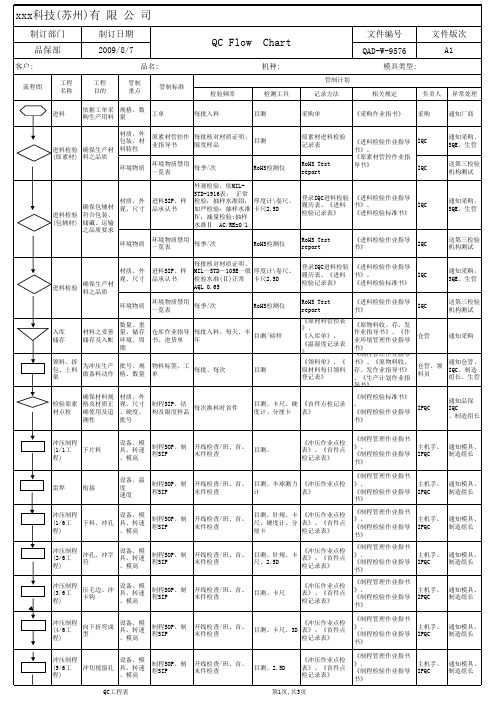
QC FLOW CHART
清洗SOP
1次/2H
PH计 导电仪
风切
去除产品表 面残留水
清洗SOP
1次/2H
目测
烘干
将产品表面 残留水烘干
温度检测 、 时间设定 组装线光 源 洁净度
清洗SOP
1次/2H
目测
《清洗机各药槽控 清洗线组 《制程管理作业指书》 制日报表》 长
组装SOP
1次/2周
落尘测试仪 照度计 目测 温湿度计
《环境检测数据记 《无尘室管理作业指书 生技设备 录表》 》 人员 《无尘室清洁日检 《无尘室管理作业指书 组装作业 表》 》 员 《温湿度记录表》 《装配线自主检查 组装作业 《制程管理作业指书》 表》 员
品名:
管制 重点 设备、模 具、转速 、模高 管制标准
QC Flow Chart
机种:
管制计划 检验频率 检测工具 记录方法
文件编号 QAD-W-9576
模具类型:
文件版次 A1
相关规定
负责人
异常处理
冲压制程 成型压毛边 (6/6工程)
制程SOP、制程 开线检查/班、首、 SIP 末件检查
目测、卡尺、 《制程管理作业指书》 《冲压作业点检表 2.5D、3D、厚薄 、 主机手、 》、《首件点检记 规、硬度计、分 《制程检验作业指导书 IPQC 录表》 厘卡 》 目测 《冲压自主检查表 《制程管理作业指书》 线检 》
符号说明
备注:此产品为连续模生产,检验时取成品检验相关尺寸
核准:
审核:
制订:
QC工程表
第3页,共3页
《成品收、存、备、出 仓管 作业指导书》
通知组装、 品保
成品SIP 保证出货产 品之品质符 出货检验 合 客户 要求 外观、数 成品外观SIP 量 、包装
Flow Chart 流程图分享
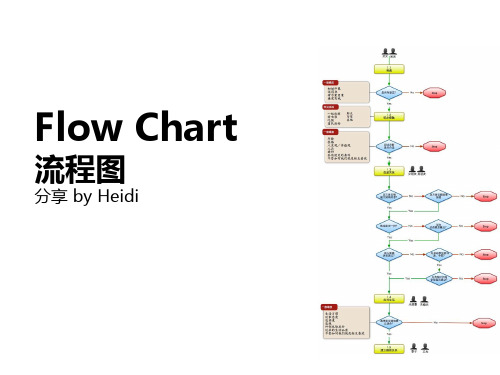
每个网格内的活动是由该 部门该岗位在该阶段作的 活动
4
业务流程图
连线游戏
原则
DON’T !
DO!
按照自己的想当然绘制流程 把流程图局限在你自己的部门 在真空中工作 在确认起点和结束点前试图绘制 陷入太多的细节 单兵作战
部门之间协作绘制
在开始前确认流程的起点和结束 高层级的流程图 按实际情况绘制流程 在整个组织内思考流程
5
数据流程图
符号
数据源或外部实体
处理过程
对数据的转换, 如平均值,计数 等。
数据存储
数据流向
5
数据流程图
参考步骤
1. 梳理业务流程 2. 数据流转分析-调查
3. 采用标准符号绘制
4. 配合数据字典交付
是对数据流程图中的数据项、数据结构、数据流、处理逻辑、数据存储 和外部实体进行定义和描述的工具,也是数据分析和管理工具,同时也
按 主 体
泳道图
基本流程图
数据流程图
Transaction Flow Diagram
完整流程图
页面流程图
Page Flow Diagram
注:广义上还应该包含甘特图,系统流程图等,不做为本次分享内容。
4
业务流程图
定义
用规定的,尽可能少的符号及连线来表示具体业务处理过程。 按照业务实际处理的步骤绘制。 主要表示各部门业务处理过程
示例
也可能很原始……
1
什么是流程图(Flow Chart)?
示例
也有可能很复杂……
1
什么是流程图(Flow Chart)?
示例
可能更复杂……
1
什么是流程图(Flow Chart)?
QC操作流程 QC Processing Flow Chart

Merchandiser
Full set QC Inspection Files need to be prepared by PGS SHA Merchandisers . office QC Manger need to check and confirm the full set inspection files against the checking list to make sure all information matching and clear to understand otherwise clarification is needed from merchandiser.
Inspection Result - Reject
If inspection is rejected, written report along with samples representing the
defective bulk, will be sent to the appropriate merchandiser &buyer office
Goods will not be released if there is no fully accepted ITS / SGS reports. It is supplier's responsibilty if any shipment delay due to failed testing report.
A min of 80% ready packed goods are required for buyer office QC to carry out final inspection, or final inspection will be cancled by office QC. It is supplier's responsibility if the shipment being delayed due to packing percentage not up to HS inspection requriement.
QC FLOW CHART
制订部门 品保部
客户:
流程图 工程 名称 工程 目的 依据工单采 购生产用料
制订日期 2009-8-7
品名:
管制 重点 规格、数 量 材质、外 包装、材 料特性 环境物质 管制标准
QC Flow Chart
机种:
管制计划 检验频率 工单 每批入料 检测工具 目测 记录方法 采购单
制程SOP、制程 开线检查/班、首、 SIP 末件检查
《制程管理作业指书》 目测、半球测力 《冲压作业点检表 、 主机手、 计 》 《制程检验作业指导书 IPQC 》 《制程管理作业指书》 目测、针规、卡 《冲压作业点检表 、 主机手、 尺、硬度计、分 》、《首件点检记 《制程检验作业指导书 IPQC 厘卡 录表》 》 《制程管理作业指书》 《冲压作业点检表 目测、针规、卡 、 主机手、 》、《首件点检记 尺、2.5D 《制程检验作业指导书 IPQC 录表》 》 《制程管理作业指书》 《冲压作业点检表 、 主机手、 》、《首件点检记 《制程检验作业指导书 IPQC 录表》 》
文件编号 QAD-W-9576
模具类型:
文件版次 A1
相关规定 《采购作业指书》
负责人 采购
异常处理 通知厂商
进料
进料检验 确保生产材 (原素材) 料之品质
原素材管控作 每批核对材质证明、 目测 业指导书 限度样品 环境物质禁用 每季/次 一览表
RoHS检测仪
原素材进料检验记 《进料检验作业指导书 IQC 录表 》、 《原素材管控作业指导 RoHS Test 书》 IQC report
通知模具、 制造组长
冲压制程 下料、冲孔 (1/6工程)
制程SOP、制程 开线检查/班、首、 SIP 末件检查
流程图的的绘制工具及及选择

流程图的绘制工具及其选择*为了让流程能够得以规范和落地,我们一般都会绘制具有合适颗粒度的管理或业务流程图,并编写流程说明,制作流程文档,用来描述企业的各类业务如何运作以及业务运作模式如何解决用户的需求,以期为流程责任人或执行人提供清晰明确的视图和指引。
业务流程图是一种直观的工具,因此几乎所有的办公领域都会运用到它:人事部门有人事结构图,软件开发有开发流程图,各种工艺制造业的管理需要有工艺工程图……总之,由于图形表达方式便捷及明了,流程图的绘制就成了企业办公过程中最常见的工作之一,准确、简洁而精美是这项工作的主要目标。
要实现这一目标并不容易,但在拥有了计算机后,情况就大为改观,人们可以通过利用各种优秀的流程图绘制软件来更好地完成这项工作。
要绘制流程图,就必须有自带相关绘图功能的软件的支持。
在众多的应用中,有人使用比较经典的流程图绘制工具Visio——功能强大但操作较为复杂;也有人采用Word自带的流程图绘图工具,但Word绘图工具功能简陋;此外还有SmartDraw,它容易上手,功能也比较强。
然而,有些客户此前也许并没有绘制过专业的流程图,更何况是流程图软件的使用;有些客户有了一定的基础,但是使用的软件不尽相同。
那么,对于一般的企业或其他组织机构而言,应该选择什么软件绘制流程图会更好呢?一、都有哪些流程图绘制工具?首先我们来认识一下都有哪些电子化的流程图绘制工具。
就我看来,可以将现有的流程图绘制软件分为如下四类:专业的绘图软件;在线的绘图软件/网站;流程管理软件/系统;附带绘图功能的一般软件。
下表对这四类软件进行了不完全的分类举例和介绍:类型流程软件简介专业绘图软件Visio Microsoft Office Visio是当今最优秀的绘图软件之一,它将强大的功能和易用性完美结合。
它有助于IT和商务专业人员轻松地可视化、分析和交流复杂信息。
它能够将难以理解的复杂文本和表格转换为一目了然的 Visio 图表。
流程图(flowchart)
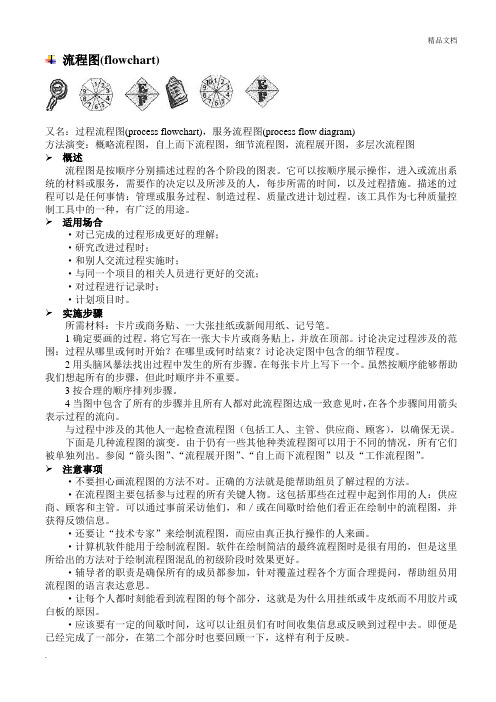
流程图(flowchart)又名:过程流程图(process flowchart),服务流程图(process flow diagram)方法演变:概略流程图,自上而下流程图,细节流程图,流程展开图,多层次流程图➢概述流程图是按顺序分别描述过程的各个阶段的图表。
它可以按顺序展示操作,进入或流出系统的材料或服务,需要作的决定以及所涉及的人,每步所需的时间,以及过程措施。
描述的过程可以是任何事情:管理或服务过程、制造过程、质量改进计划过程。
该工具作为七种质量控制工具中的一种,有广泛的用途。
➢适用场合·对已完成的过程形成更好的理解;·研究改进过程时;·和别人交流过程实施时;·与同一个项目的相关人员进行更好的交流;·对过程进行记录时;·计划项目时。
➢实施步骤所需材料:卡片或商务贴、一大张挂纸或新闻用纸、记号笔。
1确定要画的过程。
将它写在一张大卡片或商务贴上,并放在顶部。
讨论决定过程涉及的范围:过程从哪里或何时开始?在哪里或何时结束?讨论决定图中包含的细节程度。
2用头脑风暴法找出过程中发生的所有步骤。
在每张卡片上写下一个。
虽然按顺序能够帮助我们想起所有的步骤,但此时顺序并不重要。
3按合理的顺序排列步骤。
4当图中包含了所有的步骤并且所有人都对此流程图达成一致意见时,在各个步骤间用箭头表示过程的流向。
与过程中涉及的其他人一起检查流程图(包括工人、主管、供应商、顾客),以确保无误。
下面是几种流程图的演变。
由于仍有一些其他种类流程图可以用于不同的情况,所有它们被单独列出。
参阅“箭头图”、“流程展开图”、“自上而下流程图”以及“工作流程图”。
➢注意事项·不要担心画流程图的方法不对。
正确的方法就是能帮助组员了解过程的方法。
·在流程图主要包括参与过程的所有关键人物。
这包括那些在过程中起到作用的人:供应商、顾客和主管。
可以通过事前采访他们,和/或在间歇时给他们看正在绘制中的流程图,并获得反馈信息。
How to Create Flow Charts如何制作工作流程图

How to Create Flow Charts in WordFlow charts are good visual tools. You can use one to displayfunctions, such as how a system operates or how a business's accounting procedures work. A flow chart can present a process, progression or structure with easily readable pictures and aminimal amount of text. For instance, you can create a flow chart to show your organization's supervisory structure so employees can know at a glance who reports to whom. Using Microsoft Word, you can create an effective flow chart in a short amount of time.Instructions1.o1Open a new blank Word document. If you are using Word 2003 or earlier, click"AutoShapes" on the "Drawing" toolbar. In Word 2007, go to the "Insert" tab of the ribbon and click on "Shapes."o2Point to "Flowchart" in Word 2003 and click on the first shape that you want in your flow chart. In Word 2007, click the shape you want to use in the "Flowchart" section of the "Shapes" dropdown gallery.∙3Click on the blank page where you want to apply the first shape. Drag the shape into the size you require. Choose and apply more shapes onto the page until you have all of the shapes you need for your flow chart.∙4Add connectors between the shapes to show your flow. Go back to the "AutoShapes"menu in the Word 2003 "Drawing" toolbar, or the "Shapes" dropdown in Word 2007.Click on a connector, line or arrow and apply it to the page between the first andsecond shape. Repeat with the remaining shapes, connecting all of the requiredshapes to show the process flow.∙5Add color to your flow chart shapes. Click on the shape to select it, right-click and choose "Format Shape." Choose the color or fill effect you want to use.∙6Right click the first shape and click on "Add Text." Type the text you want in the first box and press "Enter." Repeat with the remaining shapes. Save your flow chart and print it out if desired.Tips & Warnings∙If you can't find the "Drawing" toolbar in Word 2003, go to the "View"menu and point to "Toolbars." Click "Drawing" and the "Drawing"toolbar will appear at the bottom of the Window.How to Make a Flowchart in ExcelExcel is a good Office application to use if you want your files to include visual aids.You can make charts, graphs and pivot tables in Excel to show (rather than tell) the information you want to get across. You can also use Excel to create flowcharts, which show a progression or how something operates. Adding a flowchart to an existing Excel spreadsheet can provide further impact. Or you can make a flowchart in a new worksheet as an independent file.Instructions1.o1Make the "Drawing" toolbar available in Excel 2003 by going to the "View" menu and pointing to "Toolbars." Click on "Drawing"; the "Drawing" toolbar will appear at the bottom of the window. In Excel 2007, go to the "Insert' tab of the ribbon and find the "Illustrations" section.o2Click on "AutoShapes" in Excel 2003 and point to "Flowchart." Click on the firstshape you want to use and click onto the worksheet to place it in the appropriate area.In Excel 2007, click the "Shapes" button and choose the shape you want to use first from the "Flowchart" gallery. Click onto the worksheet and place the shape there. For the best results, begin your flowchart near the top of the worksheet, but leave a few rows in case you decide to add text above it.o Sponsored LinksFlash Drive ManagementCentral management of secure USB flash drives anywhere in the world!o3Add more shapes to your flowchart in the same manner. You need to have one shape for each step in the process. The position of the shape will depend on when the step takes place, as well as how you determine whether to take the step. For instance, if Step One is a yes or no question, you might put "Yes" in a shape that is down and to the right of the first shape and "No" down and to the left. Right-click each shape and click on "Add Text" to add the information needed.o4Add connectors between the shapes. In Excel 2003, click the "AutoShapes" button and click on "Connectors." Choose a connector and click on the first shape. Drag into place, linking the two shapes. In Excel 2007, choose a connector from the "Shapes"drop-down menu. Connect all of the appropriate shapes.o5Format the shapes for more interest and effect. Right-click a shape and choose"Format Shape" (or "Format AutoShape"). On the "Font" tab, you can choose adifferent font, change the font size or color or add effects. On the "Alignment" tab, you can center your text. On the "Colors and Lines" tab, you can fill the shape with a color or other fill effect. When you are finished making changes, clck "OK."o6Save your worksheet. You can use thHow to Write a Flow ChartFlow charts are commonly used diagrams that help a readerunderstand a process. The chart uses boxes and arrows to convey the information. In each box, the writer lists key words or phrases in the process; the arrows indicate the progression of the process.While each flow chart will vary depending on the specific subject matter, the majority of flow charts diagram a process from start to finish. To help illustrate how to write a flowchart, consider how a person brushes his teeth.Instructions1.o1Title the flow chart. In this example, use a title such as "Brushing Teeth."o2Draw a rectangle under the title. Write the first step in the process in this rectangle.Here, the first step might be "Rinse toothbrush under water briefly."∙3Draw a line from the box with an arrow pointing downward. Connect the arrow to a second box. Write the second step of the process in the second box. In this example, you may write "Apply toothpaste to the brush."∙4Repeat Steps 2 and 3 listing each subsequent step. At points in the process where one of two outcomes can occur, draw two lines from one box leading to two separate steps in the process. An example here may be the proper motion to use whenbrushing teeth. Underneath the box stating "Apply toothpaste to the brush", draw two separate lines at angle away from the box. In one of the outcomes, write "Use a circular brushing pattern"; in the other, write "Use an up-and-down brushingpattern."∙5Connect the final box of the process. Write "Finish" or, for this example, "Rinse and repeat as necessary.Tips & Warnings∙Use different shapes to help readers understand complex processes. For example, suggests using ovals for start and finish,rectangles for instructions, and diamonds for times during the processwhere a person needs to make a decision. Use these shapes or come upwith your own.Symbols Used in a FlowchartThe symbols in a flowchart are geometric shapes used to illustrate the different actions that can occur during a process, program or algorithm.Although flowcharts included text descriptives as well, the symbols on the chart vary in shape to give visual cues to the reader that aid in the understanding of the chart. Without even reading the text, a user can quickly grasp the general process based on the order of the symbolsRounded Rectangle∙The rounded rectangle symbol on a flowchart is known as a "terminator." It is used to show the start, stop, beginning or end of a process. They are commonly seen at the top and bottom of a flowchart, but may appear within a flowchart if sub-processes branch off then terminate before the end of the overall process.Arrow∙The arrow symbol is used to show the flow of information through the program. The arrow points in the direction the process moves from start to finish. If a section of the flowchart indicates information goes into one block and back out again to an earlier step in the process, the arrow line will be bent, with right angles like a square,pointing up and back around to a previous section of the chart, illustrating a "loop"or step that repeats. A double arrow may appear on flowcharts to indicate digital data read/write actions to the same device.Diamond∙A diamond is used on a flowchart to show decision. It can mark the appearance of anIF statement, for example, or any question in the process that has multiple outcomes that lead to new directions in the process. A "yes" to the question posted in thediamond would take the process in one direction indicated by a point on thediamond. A "no" response would send the process in another direction indicated by a second point on the diamond. They don't necessarily need to be opposite points.Plain Rectangle∙One of the more common symbols seen in a flowchart, the plain rectangle is used to show individual steps or actions in the process and is often used directly after the start of the process and after any decision symbols to show the next action to take place.Rectangle with Wavy Bottom∙This symbol resembled a torn piece of paper and indicates a "document" in theprocess. It could be physical document created during the process, as in a printout, or an electronic document, such as an email message, generated by the process. A "stacked" version of this symbol indicates multiple documents output.Rounded Rectangle with Concave End∙This symbol is used to show data being stored for those processes that include data moving to certain locations. A terminating symbol would follow if the data storage is the end of a particular process branch on the chart.。