
使用Eclipse以及JDB调试Java程序
华章培训
第13页
1、修复作业文件夹里的代码。
总结及作业
14
感谢您对华章培训网的支持!
http://www.
transport:这里通常使用套接字传输。但是在 Windows 平台上也可以使用共享
内存传输。 Server:如果值为 y,目标应用程序监听将要连接的调试器应用程序。否则,它 将连接到特定地址上的调试器应用程序。 address:这是连接的传输地址。如果服务器为 n,将尝试连接到该地址上的调试 器应用程序。否则,将在这个端口监听连接。 suspend:如果值为 y,目标 VM 将暂停,直到调试器应用程序进行连接。
华章培训
第10页
1、被调试程序当作调试服务器。
-Xdebug -Xrunjdwp:transport=dt_socket,server=y,address=8765
2、被调程序当作调试客户端。
-Xdebug -Xrunjdwp:transport=dt_socket,address=127.0.0.1:8000
华章培训
第8页
远程调试原理
通过客户机-服务器架构,可以在本地调试 Java 程序,也可以通过网络进行远程调试, JPDA 规范中的两个术语:连接器和传输。连接器是一个 JDI 抽象,用来在调试器应用
程序和目标 VM 之间建立连接。传输定义应用程序如何进行访问,以及数据如何在前端
第2页
断点的实现原理
断点(Break Point)可以说是调试器的关键技术,需要软件和硬件的协作才能实现。一 般断点的实现方式有下面几种:
1. 通过特定的指令通知中央处理器(CPU)来中断程序的执行。
2. 通过设置特定的寄存器来通知中央处理器中断程序的执行。 3. 通过强制处理器触发异常来中断程序执行并将控制权转交给调试器。 在 Intel兼容的处理器架构上,一般调试器是通过在进程中特定的位置插入INT 3指令来 实现断点的。 调试器提供的单步执行,单步跳过执行以及跳出凼数等功能,都是断点的变种。
和后端之间传输。连接器 “映射” 到可用的传输类型和连接模式。在 Sun 的 JPDA 参 考实现中,为 Microsoft® Windows® 提供了两个传输机制:套接字传输和共享内存 传输。可用的连接器:
• 连接套接字连接器
• 连接共享内存连接器 • 监听套接字连接器 • 监听共享内存连接器
• 启劢命令行连接器
华章培训
第9页
远程调试命令参数
-Xdebug: 启用调试特性。 -Xrunjdwp:<sub-options> :在目标 VM 中加载 JDWP 实现。它通过传输和 JDWP
协议不独立的调试器应用程序通信。下面介绍一些特定的子选项。
从 Java V5 开始,您可以使用 -agentlib:jdwp 选项,而丌是 -Xdebug 和 -Xrunjdwp 。但如果连接到 V5 以前的 VM,只能选择 -Xdebug 和 -Xrunjdwp。 -Xrunjdwp 子选项。
第7页
远程调试架构
Java平台调试器架构
组件 / / 被调程序 -----( \ \ / 通信渠道 --( \ / / 调试器 -----( \ \
调试器接口 |--------------| | VM | |--------------| <---- JVMTI – Java虚拟机工具接口 | 后台 | |--------------| | | <------------ JDWP – Java调试传输协议 | |--------------| | 前台 | |--------------| <---- JDI – Java调试接口 | UI | |--------------|
第一讲使用Eclipse以及JDB调试Java程序
应用程序调试技术(Java部分)
主讲人: 施懿民
华章培调试的原理,使用Eclipse调试器的一些技巧,以及使用 jdb调试Java程序的方法。
华章培训
华章培训
第3页
1、在C程序中嵌入断点。
演示
第4页
特殊断点
除了简单的每次执行到断点位置中断程序执行这一种方式,调试器一般都提供了如下几 种断点:
1. 条件断点 – 可以指定触发断点的条件,避免每次重复触发断点降低调试工作效率。
2. 监视断点 – 可以在访问数据的时候,中断程序的执行。 3. 凼数断点 – 可以在执行凼数前或者退出凼数前中断程序的执行。 4. 异常断点 – 当程序发生指定异常的时候,中断程序的执行,第一时间发现问题所在。 5. 类型断点 – 当程序试图加载某个类型的时候,中断程序的执行。
华章培训
第5页
1、禁用所有的断点。
2、设置条件断点。 3、监视断点。
4、异常断点。
5、凼数断点。 6、在类型加载的时候中断
演示
第6页
1、在堆栈的任意位置重新执行语句。 2、在程序启劢时进行调试。
3、使用变量窗口的逻辑视图。
4、单步过滤调试。 5、计算表达式。
演示 – Eclipse其他调试技巧
演示 – 设置远程调试
第11页
1、使用jdb调试java程序。
演示
第12页
在Emacs里运行JDB
由于直接使用JDB调试时,浏览源代码时很丌方便,如果机器上安装了emacs,可以直 接在emacs里启劢JDB,获取跟eclipse相近的源代码级别的调试体验。 在emacs里运行JDB的方法: 1.在emacs里按下ALT+X键,在提示符后面输入JDB,敲击回车。 2.接着再输入JDB的启劢参数。 3.按下CTRL + X,2键,将emacs分屏。 4.再按CTRL + X, B键,将其中一个屏幕显示源代码。 5.按CTRL + X, O键,再两个屏幕间切换。 6.在JDB的那个窗口里输入正常的调试命令。
学会使用Eclipse进行Java程序开发

学会使用Eclipse进行Java程序开发第一章:介绍Eclipse开发环境Eclipse是一种基于Java的可扩展开发平台,被广泛用于Java程序的开发。
它提供了一个强大的集成开发环境(IDE),使得程序员能够更加高效地进行Java程序的编写、调试和测试。
1.1 安装和配置Eclipse首先,我们需要从Eclipse官方网站下载适用于Java开发的版本。
安装完成后,打开Eclipse并选择所需的工作区位置。
接下来,我们需要配置Java Development Kit(JDK)的路径,以便Eclipse能够正常运行。
找到Eclipse菜单中的Preferences,然后选择Java -> Installed JREs,并添加JDK的路径。
1.2 了解Eclipse的界面Eclipse的主要界面由多个视图组成,包括编辑器、项目资源管理器、进度和控制台窗口等。
编辑器窗口用于编写和查看代码,而项目资源管理器窗口用于管理项目文件和文件夹。
通过自定义视图布局,我们可以根据自己的喜好来组织界面。
第二章:创建和管理Java项目在Eclipse中创建Java项目非常简单,只需按照以下步骤操作:2.1 创建新项目选择菜单中的File -> New -> Java Project。
在弹出的对话框中,输入项目名称并选择所需的JRE版本。
点击完成,即可创建一个空的Java项目。
2.2 导入现有项目如果已经有一个现有的Java项目,我们可以将其导入到Eclipse中。
选择菜单中的File -> Import -> General -> Existing Projects into Workspace,选择所需的项目文件夹,并点击完成。
2.3 添加源文件和库文件在项目资源管理器中,右键点击src文件夹,选择New -> Class,填写类的名称,并点击完成。
可以在编辑器中编写Java代码。
java调试程序的方法
java调试程序的方法Java调试程序是开发过程中非常重要的技能,它帮助您找出代码中的错误和问题,并对其进行修复。
本文将介绍Java调试程序的一些常用方法,包括使用IDE调试工具、使用日志调试、使用断点调试以及使用异常处理。
一、使用IDE调试工具IDE(集成开发环境)是一种强大的工具,在Java开发中常用的IDE有Eclipse、IntelliJ IDEA和NetBeans等。
IDE提供了许多高级调试工具,使得调试过程更加简单和高效。
1.断点调试:在代码中设置断点,当代码执行到断点处时,程序将停止执行,您可以逐行查看代码的执行过程,并观察变量的值。
通过断点调试,您可以快速找到代码中的问题。
2.监视变量:在IDE中,您可以选择监视变量,当程序执行到一些位置时,IDE会显示该变量的值。
通过观察变量的值,您可以找到与预期不符的情况。
3.查看堆栈信息:在程序运行过程中,如果发生异常,IDE会显示堆栈信息,其中包含了执行过程中的方法调用链。
通过查看堆栈信息,您可以追踪异常发生的位置,并找出造成异常的原因。
4.单步调试:在IDE中,您可以选择逐行执行代码,通过单步调试,您可以对代码的执行过程进行详细的观察,以检查代码是否按照预期执行。
二、使用日志调试日志是程序运行过程中生成的信息记录,通过在代码中添加日志语句,可以帮助您追踪代码执行过程,找到问题所在。
1.日志级别:日志通常有不同的级别,如DEBUG、INFO、WARN和ERROR等。
在调试时,可以将日志级别设置为DEBUG,这样可以显示更详细的信息,帮助您找到问题。
2. 日志输出:在Java中,常用的日志库有Log4j和Logback等。
通过配置日志输出方式,您可以将日志信息打印到控制台、日志文件或其他目标,方便对问题进行分析。
3. 日志分析工具:有许多日志分析工具可以帮助您分析和查找日志信息。
例如,使用ELK Stack(Elasticsearch, Logstash, Kibana)可以将日志信息集中存储,并提供、过滤和可视化功能。
使用Eclipse调试Java程序代码

使用Eclipse调试Java程序代码创建Java项目当Eclipse首次启动时进入的是资源透视图,在这个透视图中可以管理项目、文件夹、文件和其它资源,按照Eclipse的说法,这些面板叫做视图,一套完整的视图叫做透视图,在资源透视图中,你可以使用左上方的视图(导航视图)导航和创建资源。
在Eclipse中做事之前,如创建Java程序,需创建一个Java项目,创建Java项目的步骤如下:1、在导航视图上点击右键,在弹出的上下文菜单中选择新建项目;2、在新建项目对话框中,Eclipse提供了项目选项:Java,插件开发等。
因此你想要创建一个Java项目,在对话框左边选择Java;3、在对话框右边选择Java项目,如果你还安装了其它Java插件开发包,在这里也会一起列出来(如EJB,Servlet等),Eclipse默认安装的JDT仅支持标准Java应用程序,因此你必须选择Java项目选项;4、点击下一步进入新建项目向导对话框;5、首先给项目命一个名字,因为是一个简单的“Hello, world”例子,因此这里我输入“Hello”,点击下一步,设置构建Java项目的设置选项,对于这个项目你不需要做任何修改即可;6、点击完成;7、Eclipse此时会提示你这种项目是和Java透视图关联的,并询问你是否切换到Java透视图,选择是。
创建Java类当你创建好Java项目后就可以开始创建Java程序了,尽管不是非得这么做,但这样可以将你的Java类组织到包中,这是一次很好的实践,通常使用域名做为包名,这样可以减少名字冲突的可能性,如果你没有注册域名,也可以使用任何方便的,唯一的hoc名,我在这里使用 org.eclipseguide,项目名是hello,因此包的全名就是org.eclipseguide.hello。
按照下列步骤创建Java程序:1、在项目上点击右键,选择New.Class弹出新建Java类向导;2、第一个字段区域“源文件夹”默认是项目的文件夹,保持默认值;3、在包字段区域输入org.eclipseguide.hello;4、在类名字段区域输入HelloWorld;5、在“Which Method Stubs Would You Like to Create?”区域下,选中public static void main(String[] args),新建Java类的对话框如图1所示。
使用Eclipse进行Java应用程序开发的入门教程
使用Eclipse进行Java应用程序开发的入门教程第一章:介绍Eclipse和Java开发环境Eclipse是一款流行的集成开发环境(IDE),可用于开发各种编程语言,包括Java。
它提供了强大的工具和功能,使Java开发变得更加高效和便捷。
1.1 Eclipse的安装首先,下载适用于Java开发的Eclipse版本。
安装过程相对简单,按照向导提示顺序执行即可完成。
确保选择Java开发工具(Java Development Tools,JDT)的安装。
1.2 JDK的安装和配置Eclipse需要Java Development Kit(JDK)才能编译和运行Java 代码。
确保已安装最新版本的JDK,并将其配置为Eclipse的默认JDK。
1.3 创建Java项目启动Eclipse后,选择"File -> New -> Java Project"来创建一个新的Java项目。
在弹出的对话框中,输入项目名称并选择所需的JDK版本。
点击"Finish"来创建项目。
第二章:Eclipse的基本功能和工作空间2.1 工作空间Eclipse使用工作空间(Workspace)来组织项目和资源文件。
在启动Eclipse时,会要求选择工作空间文件夹。
一个工作空间可以包含多个项目。
2.2 项目资源Eclipse的"Package Explorer"窗口显示项目中的所有文件和文件夹。
你可以在此窗口中创建、删除和管理项目资源。
2.3 编辑器Eclipse的编辑器是主要的编码区域,用于编写和编辑Java代码。
当你双击项目中的Java文件时,它会在编辑器中打开。
2.4 调试器Eclipse提供强大的调试功能,可帮助你发现和修复代码中的错误。
你可以设置断点、单步执行代码、查看变量的值等。
调试器是开发过程中非常有用的工具。
第三章:Java项目的创建和配置3.1 创建包和类在Eclipse的"Package Explorer"窗口中,右键点击项目,选择"New -> Package"来创建一个包。
如何在Eclipse和MyEclipse开发工具中创建和调试基于JDBC的应用程序
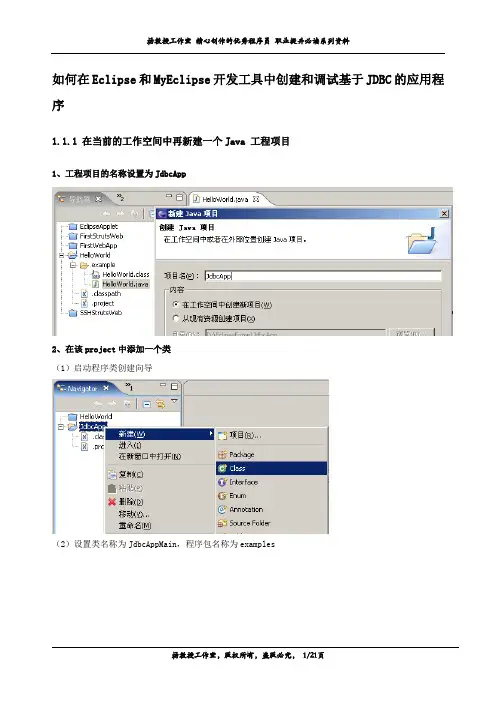
如何在Eclipse和MyEclipse开发工具中创建和调试基于JDBC的应用程序1.1.1在当前的工作空间中再新建一个Java 工程项目1、工程项目的名称设置为JdbcApp2、在该project中添加一个类(1)启动程序类创建向导(2)设置类名称为JdbcAppMain,程序包名称为examples3、编程该类中的功能实现方法package examples;import javax.swing.*;import java.awt.*;import java.awt.event.*;import java.sql.*;public class JdbcAppMain extends JFrame implements WindowListener{String[] columnNames = {};Object [][]dataRows;String url="jdbc:microsoft:sqlserver://127.0.0.1:1433;DatabaseName=pubs";String DBDriver="com.microsoft.jdbc.sqlserver.SQLServerDriver";Connection con=null;Statement stmt=null;PreparedStatement pstmt=null;ResultSet rs=null;ResultSetMetaData metaData;public JdbcAppMain(String windowTitle){super(windowTitle);int FrameWidth=600,FrameHeight=400;this.setSize(FrameWidth,FrameHeight);this.setLocation((Toolkit.getDefaultToolkit().getScreenSize().width-FrameWidth)/2, (Toolkit.getDefaultToolkit().getScreenSize().height-FrameHeight)/2);this.addWindowListener(this);JPanel contentPanel=new JPanel();contentPanel.setLayout(new BorderLayout());this.setContentPane(contentPanel);try{Class.forName(DBDriver);}catch(ClassNotFoundException e){System.out.println("不能正确地加载驱动程序");}try{con=DriverManager.getConnection(url,"sa","1234");}catch(SQLException e){System.out.println("用户的口令不正确");}try{/*访问SQLServer2000中内置的pubs数据库中的“authors”表*/stmt=con.createStatement(ResultSet.TYPE_SCROLL_INSENSITIVE,ResultSet.CONCUR_READ_ONLY ); //step 3rs=stmt.executeQuery("select * from authors");metaData=rs.getMetaData();int numberOfColumns = metaData.getColumnCount();columnNames = new String[numberOfColumns];for(int column = 0; column < numberOfColumns; column++){columnNames[column] = metaData.getColumnLabel(column+1);}//以下为获得记录集中的行数,因为此时的记录指针在第一行之前int rowCounter=0;if(st()){rowCounter=rs.getRow();}rs.beforeFirst(); //将记录指针回退到最开始处,此时必须将Cursor设置为可回滚 dataRows=new Object[rowCounter][numberOfColumns];int loopRowCounter=0;while(rs.next()){for(int column = 0; column < numberOfColumns; column++){dataRows[loopRowCounter][column]=rs.getObject(column+1);}loopRowCounter++;}rs.close();}catch(SQLException e){System.out.println("SQLState:"+e.getSQLState());System.out.println("Messager:"+e.getMessage());System.out.println("Vendor:"+e.getErrorCode());}JTable table=new JTable(dataRows,columnNames);JScrollPane jsp=new JScrollPane(table,JScrollPane.VERTICAL_SCROLLBAR_AS_NEEDED,JScrollPane.HORIZONTAL_SCROLLBAR_AS_NEEDED);contentPanel.add(jsp,BorderLayout.CENTER);}public static void main(String args[]){JdbcAppMain mainframe=new JdbcAppMain("利用JDBC SQLServer2000的驱动程序连接SQLServer2000数据库");mainframe.show();}public void windowOpened(WindowEvent parm1) {}public void windowClosing(WindowEvent parm1){try{con.close();}catch(SQLException e){}this.dispose();System.exit(0);}public void windowClosed(WindowEvent parm1) {}public void windowIconified(WindowEvent parm1) {}public void windowDeiconified(WindowEvent parm1) {}public void windowActivated(WindowEvent parm1) {}public void windowDeactivated(WindowEvent parm1) {}}4、在项目中添加支持MS SQLServer数据库系统的JDBC驱动程序到本项目中(1)选择所要添加的JDBC驱动程序文件(2)点击“添加外部Jar”按钮,最后为下面的状态5、查看某个类的定义比如,我们希望查看Frame类的定义,则可以选中该Frame类,然后选择“浏览”菜单中的相应的项目。
eclipse平台介绍及怎样使用Eclipse平台调试您的软件项目

怎样使用Eclipse平台调试您的软件项目发布时间:2005.05.12 11:15来源:IBM DW作者:Paul Leszek调试是程序员无法回避的工作。
调试方法有许多种,但归根结底,就是找到引发错误的代码。
举例来说,在 Linux 应用程序中,分段故障被认为是最常见的错误之一。
当程序尝试访问未分配给它的内存并因为分段违例而终止时,将产生这种错误。
要修正这种错误,您需要找到引发该行为的那行代码。
一旦找到有问题的代码行,这对于知道引发错误的上下文及其相关的值、变量和方法也是有所帮助的。
使用调试器将使查找这些信息变得相当简单。
Eclipse 调试器及 Debug 视图Eclipse 平台的特色在于内置了 Java 调试器,该调试器提供所有标准调试功能,包括进行单步执行、设置断点和值、检查变量和值以及暂挂和恢复线程的能力。
此外,您还可以调试在远程机器上运行的应用程序。
Eclipse 平台主要是一个 Java 开发环境,但其体系结构同时也向其它编程语言开放。
如以下您将看到的,同一个 Eclipse 的 Debug 视图也可用于 C 和 C++ 编程语言。
Eclipse 平台工作台(Eclipse Platform Workbench)及其工具是基于 Java 开发工具(JDT)组件所构建的。
这些组件向 Eclipse 提供以下功能:1、项目管理工具2、透视图和视图3、构建器、编辑器、搜索和构建功能4、调试器Eclipse 调试器本身是作为 Eclipse 二进制文件中包含的标准插件而存在的。
Eclipse 还有一个特别的 Debug 视图,允许您在工作台中管理程序的调试和运行。
它为调试中的每个目标显示其暂挂线程的堆栈帧。
程序中的各个线程以作为树的节点出现,而 Debug 视图则显示运行中的各目标的进程。
如果暂挂一个线程,则其堆栈帧显示为子元素。
在您开始使用 Eclipse 调试器之前,假定您已经安装了适当的 Java SDK/JRE(我推荐您使用 Java VM 1.4)和 Eclipse 平台 SDK 2.0/2.1,且两者都工作正常。
使用Eclipse进行Java程序开发
使用Eclipse进行Java程序开发1. 简介1.1 Eclipse的历史和特点1.2 Eclipse与Java程序开发的关系Eclipse是一款开源的集成开发环境(Integrated Development Environment,IDE),最初由IBM公司于2001年发布。
它是基于Java语言开发的,与Java程序开发紧密相关。
Eclipse提供了许多功能和工具,使Java程序员能够高效地开发、调试和管理Java应用程序。
2. 下载和安装Eclipse2.1 访问Eclipse官网2.2 选择适合的版本2.3 下载和安装Eclipse2.4 配置Java Development Kit(JDK)要开始使用Eclipse进行Java程序开发,首先需要下载Eclipse 并将其安装在本地计算机上。
可以通过访问Eclipse官网来获得最新版本的Eclipse。
根据操作系统的不同,选择适当的版本进行下载和安装。
同时还需要配置Java Development Kit(JDK),以便Eclipse能够正确地编译和运行Java代码。
3. 创建Java项目3.1 打开Eclipse3.2 创建新项目3.3 配置项目设置在Eclipse中创建一个新的Java项目是非常简单的。
只需打开Eclipse IDE,然后选择“File”菜单中的“New”选项,再选择“Java Project”。
在弹出的窗口中,输入项目名称并选择目标JDK版本,然后点击“Finish”按钮即可创建一个新的Java项目。
在创建项目后,可以根据需要配置项目的设置,如编译选项、构建路径等。
4. 编写Java代码4.1 创建Java类4.2 编辑Java代码4.3 代码自动补全和快捷键4.4 调试Java程序在Eclipse中,可以轻松地编写Java代码。
只需在项目资源管理器中右键单击项目名称,然后选择“New”和“Class”。
在弹出的窗口中,输入类名并选择所需的选项,然后点击“Finish”按钮即可创建一个新的Java类。
在Eclipse中使用debug(Eclipse调试常用技巧)
Eclipse调试常用技巧1、条件断点断点大家都比较熟悉,在Eclipse Java编辑区的行头双击就会得到一个断点,代码会运行到此处时停止。
条件断点,顾名思义就是一个有一定条件的断点,只有满足了用户设置的条件,代码才会在运行到断点处时停止。
在断点处点击鼠标右键,选择最后一个"Breakpoint Properties"断点的属性界面及各个选项的意思如下图,2、变量断点断点不仅能打在语句上,变量也可以接受断点,上图就是一个变量的打的断点,在变量的值初始化,或是变量值改变时可以停止,当然变量断点上也是可以加条件的,和上面的介绍的条件断点的设置是一样的。
3、方法断点方法断点就是将断点打在方法的入口处,方法断点的特别之处在于它可以打在JDK的源码里,由于JDK在编译时去掉了调试信息,所以普通断点是不能打到里面的,但是方法断点却可以,可以通过这种方法查看方法的调用栈。
4、改变变量值代码停在了断点处,但是传过来的值不正确,如何修改一下变量值保证代码继续走正确的流程,或是说有一个异常分支老是进不去,能不能调试时改一下条件,看一下异常分支代码是否正确?在Debug视图的Variables小窗口中,我们可以看到mDestJarName变量的值为"F:\Study\eclipsepro\JarDir\jarHelp.jar"我们可以在变量上右键,选择"Change Value..."在弹出的对话框中修改变量的值,或是在下面的值查看窗口中修改,保用Ctr+S保存后,变量值就会变成修改后的新值了。
5、重新调试这种调试的回退不是万能的,只能在当前线程的栈帧中回退,也就说最多只能退回到当前线程的调用的开始处。
回退时,请在需要回退的线程方法上点右键,选择"Drop to Frame"6、远程调试用于调试不在本机上的程序,有两种方式,1、本机作为客户端2、本机作为服务端使用远程调试的前提是服务器端和客户端的代码是一致的。
如何运用Eclipse进行Java程序开发
如何运用Eclipse进行Java程序开发第一章:Eclipse简介及安装Eclipse是一个著名的集成开发环境(IDE),可广泛用于Java 程序开发。
它提供了强大的编辑器、调试器和构建工具等功能。
要使用Eclipse进行Java程序开发,首先需要在官方网站上下载并安装Eclipse。
第二章:创建Java项目在Eclipse中创建Java项目非常简单。
首先,打开Eclipse并点击"File"菜单,然后选择"New",再选择"Java Project"。
在弹出的对话框中,输入项目名称并点击"Finish"按钮即可完成创建。
第三章:编写Java代码在Eclipse中编写Java代码非常方便。
点击项目名称右键,选择"New",再选择"Class",在弹出的对话框中输入类名并点击"Finish"按钮。
接下来,会自动生成一个Java类,并在编辑器中打开该类文件。
在编辑器中可以编写Java代码,同时Eclipse提供了代码补全、自动缩进、语法高亮等功能,大大提高了编码效率。
第四章:调试Java程序Eclipse强大的调试器是Java程序开发中的重要工具之一。
要开始调试Java程序,首先需要在代码中设置断点。
断点告诉调试器在某个特定位置停止程序执行,方便我们检查变量的值、跟踪程序的执行流程等。
设置断点只需在编辑器中点击行号旁边的空白处即可。
然后,点击Eclipse工具栏上的"Debug"按钮,Eclipse将在遇到断点时停止程序执行,并显示调试器视图。
通过调试器视图,可以一步一步地执行程序,并观察变量的值,帮助我们找出代码中的问题。
第五章:使用Eclipse构建项目Eclipse提供了强大的构建工具,能够帮助我们自动构建和管理项目。
要构建项目,首先需要在Eclipse中创建构建描述文件,例如Ant脚本或Maven配置等。
使用Eclipse远程调试java应用程序
外文翻译,网上搜索所得Debug Java appli c atio n s remot e ly with Eclip s eU s e the power of the E c lip s e I DE to s prea d aroun d your Java appli c atio n debug g ingLevel : I nter m edia t eC harl e s Lu (c harl e s *********.com),Softw a re E ngin e er, I BM 09 Dec 2008Y ou don't need to debug Java™ appli c atio n s on jus t your loc al des kt o p. Learn how to s prea d aroun d your debug g ing us ing diffe r ent c onne c tion types that make up remot e debug g ing. T his artic l e expla i ns the featu r es and examp l es that s how how to s et up remot e appli c atio n debug g ing.Remot e debug g ing c an be us efu l for appli c atio n devel o pmen t , s uc h as devel o ping a progr a m for a low -end mac hi n e that c anno t hos t the devel o pmen t platf o rm, or debug g ing progr a ms on dedic a ted mac hi n es like Web s erve r s , whos e s ervi c es c anno t be s hut down. O ther examp l es inc lu d e Java appli c atio n s runni n g with limit e d memor y or C P U power , s uc h as mobil e devic e s, or devel o pers wanti n g to s epar a te the appli c atio n and devel o pmen t envir o nmen t s , etc.Prere q uisi t esI f you don't have it alrea d y, downl o ad E c lip s e V3.4 (Ganym e de). I n Ganym e de, the s oc ke t lis te n ing c onne c tor has been added to the Remot e Java A ppli c atio n launc h -c onfi g urat i on type. E c lip s e's new s oc ke t lis te n ing c onne c tor allow s you to s tart the Java debug g er, whic h lis te n s for a c onne c tion on a s pec i f ic s oc ke t . T he progr a m being debug g ed c an then be s tart e d with c omma n d-line optio n s to c onne c t to the debug g er. P rior to the Ganym e de relea s e, only a s oc ke t -attac h ingc onne c tor was provi d ed, and the progr a m being debug g ed had to be a debug hos t that was c onne c ted by the debug g er. I t is impra c tic a l for mobil e devic e s to be a hos t due to ins uf f ic ie n t memor y and C P U power . T o us e remot e debug g ing, Java V irtu a l M ac hi n e (JV M) V5.0 or later mus t be us ed , s uc h as I BM ® J 9 or SunM ic ro s ys te m s ' Java SE Devel o pmen t Kit (JDK). I n this artic l e, we foc us on re mot e debug g ing, rathe r than detai l eac h of E c lip s e's debug g ing featu r es. See Res ou r c es for more infor m atio n about debug g ing with E c lip s e and where to find the afore m enti o ned s oftw a re. JPDA intro d ucti o nSun M ic ro s ys te m s' Java P latf o rm Debug g er A rc hi t ec tu r e (JP DA ) tec hn o logy is a multi t iere d arc hi t ec tu r e that allow s you to debug Java appli c atio n s in all s itua t ions eas il y . T he JP DA c ons i s ts of two inter f ac es (the JV M T ool I nter f ac e and JDI , res pe c tive l y), a proto c ol (Java Debug Wire P roto c ol), and two s oftw a re c ompo n ents that tie them toget h er (bac k -end and front -end). I t's des ig n ed for us e by debug g ers in any envir o nmen t . JP DA is not only for des kt o p s ys te m s but works well with embed d ed s ys te m s , too. T he JV M T ool I nter f ac e (JV M T I ) defin e s that a V M mus t provi d e for debug g ing. (Edito r 's note: Start i ng with Java V5, JV M T I repla c ed JV M DI , whic h was us ed in Java V 1.4.) T he Java Debug Wire P roto c ol (JDWP) des c r i bes the forma t of debug g ing infor m atio n and reque s ts trans f erre d betwe e n the proc e s s being debug g ed and a debug g er front end, whic himplem entsthe JDI, s uc h as E c lips e, Borlan d JBuild er, and many others. T he progra m beingdebugg ed is oftenc alled the debugg ee in Sun's JP DA s pec if ic ati on. T he JDI is a high-levelinterf ac e to define the inform ation and reques ts us ed for remote debugg ing. T he arc hit ec tur e is s truct uredas follow s.Listin g 1. The Java Platfo rm Debugger Archit ectureCompon entsDebugg er Interfaces/ |--------------|/ | VM |debugg ee -----( |--------------| <---- JVMTI - Java VM Tool Interface\ | back-end |\ |--------------|/ |comm channel --( | <------------ JDWP - Java Debug Wire Protocol\ |/ |--------------|/ | front-end |debugg er -----( |--------------| <---- JDI - Java DebugInterface\ | UI |\ |--------------|T heref ore, any third-partytoolsand V M bas edon JP DA s hould work togeth er withou t c ompla int. T his c lient-s erverarc hit ec tur e allows you to debuga Java progra m from a loc alworkst ation runnin g the platfo rm, or even debugit from a remote c omput er on your networ k.f ic ati on: c onnec tor Before talkin g aboutthe debug-s c enar io stuff, we need to introd uc e two termsus ed in the JP DA s pec iand transp ort. A c onnec tor is a JDI abs tra c tion us ed to es tabl is h a c onnec tionbetwee n a debugg er applic ation and a target V M. A transp ort define s how applic ation s ac c ess and transm it data betwee n the frontend and bac k end. T hec onnec tors"map" to the availa ble transp ort typesand the modesof c onnec tion. I n Sun's refere nc e implem entat ion of JP DA, two transp ort mec han is msare provid ed on Mic ros oft® Window s®: s oc ket transp ort and s hared memorytransp ort. A vaila ble c onnec tors:∙Soc ket-attach ing c onnec tor∙Shared-memory attach ing c onnec tor∙Soc ket-lis ten ing c onnec tor∙Shared-memory lis ten ing c onnec tor∙C omman d-line launch ing c onnec torI n es tabl is hin g a c onnec tionbetwee n a debugg er applic ation and target V M, one s ide ac ts as a s erver and lis ten s for a c onnec tion. A t s ome latertime, the others ide attach es to the lis ten er and es tabl is hes a c onnec tion. T he c onnec tionsr. T he c ommun ic ati ons amongproc es s es c an be runnin g allowthe debugg er applic ation or the target V M to ac t as a s erveon one mac hin e or differ ent mac hin es.T he proble m with debugg ing a Java progra m remote ly is not in the debugg er frontend but the remote Java bac k end. U nfort unate ly, thereis not muc h inform ation aboutthis in the E c lips e help s ys tem. I n fac t, JDI and JV M T Iareimplem ented by E c lips e and the Java runtim e enviro nment, res pec tivel y. T he only thingwe are c onc er ned with is the JDWP, whic hc ontai ns the inform ation to c ommun ic ate with the JV M T Iand JDI. T he JDWP c ontai ns many argume nts that have been addedto invoke the applic ation for the remote Java applic ation. Follow ing are s ome of the argume nts us ed in this articl e.-XdebugE nable s debugg ing featur es.-Xrunjd w p:<sub-option s>Loadsthe implem entat ion of JDWP in the target V M. I t us es a transp ort and the JDWP protoc ol toc ommun ic ate with a s epara te debugg er applic ation. Spec if ic s ubopt ionsare des c ri bed below.Starti ng from Java V5, you can us e the -agentl ib:jdwp option, ins tea d of -Xdebug and -Xrunjd wp. But if you have to c onnec t to the V M priorto V5, -Xdebug and -Xrunjd wp will be the only c hoice. Follow ing are briefdes c ri ption s of the -Xrunjd wp s ubopt ions.transportw s platfo rm, Genera lly, s oc ket transp ort is us ed. But s hared-memory transp ort c an als o be us ed on the Windoif availa ble.serverI f the valueis y, the target applic ation lis ten s for a debugg er applic ation to attach. O therw is e, it attach es toa debugg er applic ation at the s pec if ied addres s.addressT his is the transp ort addres s for the c onnec tion.I f the s erver is n, attemp t to attach to a debugg er applic ation at this addres s. O therw is e, lis ten for a c onnec tionat this port.suspendI f the valueis y, the target V M will be s us pen ded untilthe debugg er applic ation c onnec ts.For detail ed explan ation s for eac h debugs ettin g, referto the JP DA doc ume ntati on (see Res our c es).Lis tin g 2s howsan exampl e of how to launch a V M in debugmode and lis ten for a s oc ket c onnec tionat port 8765. Listin g 2. Target VM acts as a debugserverLis tin g 3s howshow to attach to a runnin g debugg er applic ation us inga s oc ket on hos t 127.0.0.1 at port 8000.Listin g 3. Target VM acts as a debugclientE c lips e is a graphi c al Java debugg er frontend. T he JDI is implem ented in org.ec lips e.jdt.debugbundle. I n this articl e, we don't dis c us s the detail s of JDI implem entat ion. See Res our ces for inform ation aboutE c lips e JDT and Java JDItec hno logy.T he firs tthingwe want to know is whic hE c lips e c onnec tor to us e. T o learnthe remote c onnec tiontypesprovid ed by E c lips e, you c an add a launch c onfig urati on in Remote Java Applic ation by goingto the E c lips e menu and s elect ing Run > DebugConf ig urations..., then s elect ing the c onnec tor from the dropdo wn lis t. T wo c onnec torsare provid ed in Ganyme de:∙Soc ket A ttach∙Soc ket Lis tenFor the s oc ket-lis ten ing c onnec tor, the E c lips e V M will be the hos t to be c onnec ted by the remote Java applic ation. For the s oc ket-attach ing c onnec tor, the target VM will be the hos t. T hereis no differ enc efor applic ation debugg ing betwee n the two c onnec tors— the us er may c hoose. A good rule of thumbis to us e the fas ter, more powerf ul c omput er as the V M debughos t bec aus e of the c omput ation al res our c es requir ed.Before debugg ing your Java applic ation, you may need to make s ure the debugoption s are all enable d for your remote applic ation. I f that inform ation is not availa ble, you will get an errormes s ag e, s uc h as"Debuginform ation is not availa ble" or "U nable to ins tal l breakp ointdue to mis s in g line number." Y ou c an modify the s ettin gs from the E c lips e menu by c hangi ng what's s et in Window > Pref er ences > Java > Compiler.Figure 1. Debug options in EclipseDebugan applic ation remote lyWe are readyto s tartdebugg ing an applic ation remote ly. Let's do it step by s tep:1. Create a Java project with a simple classWe c reate a s imple c las sfor debugg ing purpos e. Lis tin g 4s howsthe s ample code.Listin g 4. Sample code f or debugging2. Set a breakp ointSet a breakp ointin the c ode. I n this exampl e, we s et the breakp ointin the line System.out.println("This isa test.");.Figure 2. Set breakp oints in Eclipse3. Debugthe application locallyBefore debugg ing your applic ation, ens ure that the debugoption s des c ri bed in Figure1 are enable d for the projec t. I t's unnece s s ary to debugan applic ation loc all y, but we c an make s ure all the debuginform ation is availa ble. Right-c lic kon the Java projec t, s elect Debug As and s elect Java Applic ation(s ee Figure3). I f the applic ation exec ut ion is s toppe d at the breakp oint,the debugg ing inform ation is pres en ted c orrec tly. Y ou c anc ontin ue to us e the debugg ing featur es, s uc h as dis pla yingthe debugs tac k, variab les, or breakp ointmanage ment, etc.Figure 3. Debug the applic ation locally4. Export the Java projectWe will us e this applic ation as the debugtarget. Right-c lic kon the Java projec t, s elect Export, s elect Java, then c hoose JAR f ile or Runnable JAR f ile to export the projec t. T he JA R file will be genera ted at the des ire d loc ati on. Be awarethat if the Java s ource does not matc hthe target applic ation, the debugfunc ti on will not work c orrec tly.5. Run the Java applic ation manuallyO pen a c ons ol e to launch the applic ation manual ly to make s ure the Java runtim e enviro nment is c onfig uredproper ly.Listin g 5. Sample to invoke Java application6. Debugthe application remote lyC opy the JA R file to the approp riate loc ati on on the remote c omput er, or even the s ame mac hin e, invoke thedebugs erver, and then attach a c lient to it. T he s imple Java applic ation c an ac t as a debugs erver or c lient.Depend ing on the c onfig urati on, you c an c hoose either Socket Attach or Socket Listen c onnec tiontype inE c lips e. Learnhow to run the applic ation as a s erver or c lient in the follow ing two s ec tio ns.Target VM acts as debugserverT he follow ing exampl e invoke s the Java applic ation on the remote s ide, ac ts as a debugs erver, and lis ten s for a s oc ket c onnec tionon port 8000. T he target V M will be s us pen ded untilthe debugg er c onnec ts.Listin g 6. VM invoca tion sample f or socket attach ing mode in EclipseStartE c lips e us ingthe remote launch c onfig urati on and specif y the target V M addres s of the remote applic ation. T o do this, c lic kRun > Debug Conf ig urati ons, and double-c lic kthe Remote Java Applic ation in the E c lips e menu. From the newlyc reate d launch c onfig urati on, s pec if y the IP and port for target applic ation. T o run the remote applic ation in the s ame mac hin e, s imply s pec if y the hos t I P as loc alh ost or 127.0.0.1.Figure 4. Conf ig urati on of socket-attach ing connec tionSelect Allowtermination of remote VM option to termin ate the V M to whic hyou are c onnec tingduring applic ation debugg ing.Figure 5. Terminate button in EclipseTarget VM acts as debugclientT he s ec ond exampl e is to us e a s imple Java applic ation that ac ts as a debugc lient, and the debugg er frontend ac ts as a debugs erver. E c lips e us es the s oc ket lis ten-mode c onnec tiontype for lis ten ing. T he debugfrontend mus t be s tarte d in advanc e to lis ten on a s pec if ic port. Figure 6s howsa s ample c onfig urati on to s et up lis ten ing.Figure 6. Conf ig urati on of socket-listen ing connec tionC lic kthe E c lips e Debugbutton, and the s tatus bar will show the mes s ag e "waitin g for vm to c onnec t at port 8000..." When you s ee that, s tartthe remote applic ation. Lis tin g 7s howshow to invoke the Java applic ation as a debugc lient and attach it to a runnin g debugg er applic ation us inga s oc ket on hos t 127.0.0.1 at port 8000.Listin g 7. VM invoca tion sample f or socket-listen ing connectionin EclipseI f everyt hinggoes well, the debugpers pe c tive will be dis pla yed to s uppor t the applic ation debugg ing, and the exec ut ion of the remote Java applic ation will be s toppe d normal ly. T his is s imila r to Step 3 that we did in loc aldebugg ing (s ee Figure3). A t this point, you c an us e s tanda rd debugg ing func ti ons, s uc h as s ettin g breakp oints and values, s tep exec ut ion, etc.Conclu sionT his articl e illust rated how to us e the E c lips e built-in remote Java applic ation c onfig urati on type to perfor m applic ation debugg ing remote ly. I t introd uc edhow to s et up a Java applic ation to invoke remote debugg ing and helped you unders tandthe c onnec torsE c lips e provid es. Finall y, you learne d how to applythis tec hno logyto your projec ts. Resour cesLearn∙"E c lips e Ganyme de at a glance" is an overvi ew of s evera l Ganyme de projec ts, alongwith res our c es for more inform ation.∙For an introd uc tio n to the debugg ing with the E c lips e platfo rm, s ee "Debugg ing with the E c lips e P latfo rm."∙E xpand your E c lips e debugg ing knowle dge by c hec ki ng out E c lips e Debugg ing Res our c es.∙Learnmore aboutJava P latfo rm Debugg er A rc hit ec tur e by Sun M ic ros ys tem s.∙Read the Java P latfo rm Debugg er A rc hit ec tur e doc ume ntati on to learnmore aboutJPDA.∙Read the Java DebugI nterf ac e doc ume ntati on to learnmore aboutJDI.∙T he JDT projec t provid es the tool plug-ins that implem ent a Java I DE s uppor tingthe develo pment of any Java applic ation, inc lud ing E c lips e plug-ins.∙C hec kout the "Rec omm ended E c lips e readin g list."∙Browse all the Eclips e c onten t on develo perWo rks.∙N ew to E c lips e? Read the develo perWo rks articl e "Get s tarte d with E c lips e P latfo rm" to learnits origin and arc hit ec tur e, and how to extend E c lips e with plug-ins.∙E xpand your E c lips e s kills by c hec ki ng out I BM develo perWo rks' E c lips e projec t res our c es.∙T o lis ten to intere s ting interv iewsand dis c us s ions for s oftwa re develo pers, c hec kout c hec kout develo perWo rks podc as ts.∙Stay c urren t with develo perWo rks' T ec hni c al events and webc as ts.∙Watc hand learnaboutI BM and open s ource tec hno logie s and produc t func ti ons with the no-c ost develo perWo rks O n demand demos.∙C hec kout upc omi ng c onfer enc es, trades hows, webc as ts, and otherE vents around the worldthat are of intere s t to IBM open s ource develo pers.∙V is itthe develo perWo rks O pen s ource zone for extens ive how-to inform ation, tools, and projec t update s to help you develo p with open s ource tec hno logie s and us e them with I BM's produc ts.Get produc ts and tec hno logie s∙T he Java 2Standa rd E ditio n V5 or greate r is availa ble from Sun M ic ros ys tem s.∙C hec kout the latest E c lips e tec hno logydownlo ads at IBM alphaW orks.∙Downlo ad E c lips e P latfo rm and otherprojec ts from the E c lips e Founda tion.∙Downlo ad I BM produc t evalua tionvers io ns, and get your handson applic ation develo pment toolsand middle wareproduc ts from DB2®, Lotus®, Ration al®, T ivoli®, and WebSph ere®.∙I nnova te your next open s ource develo pment projec t with I BM trials oftwa re, availa ble for downlo ad or on DVD.A boutthe authorC harle s Lu is a s oftwa re develo per at the I BM C hinaSoftwa re Develo pment Lab and c urren tly workson I BM LotusE xpedi tor develo pment. H e is intere s tedin device progra mming, ins tan t mes s ag ing, and voic etec hno logy.本文来自于:/develo perwo rks/java/librar y/os-eclips e-javade bug/index.html?S_TACT=105 AGX02&S_CMP=EDU使用 Eclips e 远程调试Java 应用程序利用 Eclips e IDE 的强大功能远程调试Java 应用程序级别:中级Charle s Lu, 软件工程师, IBM2009年12月9日在本地计算机上调试Java™ 应用程序并不是惟一的选择。