曼昆微观经济学英文版12design_tax
曼昆微观经济学课后练习英文答案完整版

曼昆微观经济学课后练习英文答案集团标准化办公室:[VV986T-J682P28-JP266L8-68PNN]the link between buyers’ willingness to pay for a good and the demandcurve.how to define and measure consumer surplus.the link between sellers’ costs of producing a good and the supply curve.how to define and measure producer surplus.that the equilibrium of supply and demand maximizes total surplus in amarket.CONTEXT AND PURPOSE:Chapter 7 is the first chapter in a three-chapter sequence on welfare economics and market efficiency. Chapter 7 employs the supply and demand model to develop consumer surplus and producer surplus as a measure of welfare and market efficiency. These concepts are then utilized in Chapters 8 and 9 to determine the winners and losers from taxation and restrictions on international trade.The purpose of Chapter 7 is to develop welfare economics—the study of how the allocation of resources affects economic well-being. Chapters 4 through 6 employed supply and demand in a positive framework, which focused on the question, “What is the equilibrium price and quantity in a market” This chapter now addresses the normative question, “Is the equilibrium price and quantity in a market the best possible solution to the resource allocation problem, or is it simply the price and quantity that balance supply and demand” Students will discover that under most circumstances the equilibrium price and quantity is also the one that maximizes welfare.KEY POINTS:Consumer surplus equals buyers’ willingness to pay for a good minus the amount they actually pay for it, and it measures the benefit buyers get from participating in a market. Consumer surplus can be computed by finding the area below the demand curve and above the price.Producer surplus equals the amount sellers receive for their goods minus their costs of production, and it measures the benefit sellers get from participating in a market. Producer surplus can be computed by finding the area below the price and above the supply curve.An allocation of resources that maximizes the sum of consumer and producer surplus is said to be efficient. Policymakers are often concerned with the efficiency, as well as the equality, of economic outcomes.The equilibrium of supply and demand maximizes the sum of consumer andproducer surplus. That is, the invisible hand of the marketplace leadsbuyers and sellers to allocate resources efficiently.Markets do not allocate resources efficiently in the presence of market failures such as market power or externalities.CHAPTER OUTLINE:I. Definition of welfare economics: the study of how the allocation of resources affects economic well-being.A. Willingness to Pay1. Definition of willingness to pay: the maximum amount that a buyer will pay for a good.2. Example: You are auctioning a mint-condition recording of Elvis Presley’s first album. Four buyers show up. Their willingness to pay is as follows:If the bidding goes to slightly higher than $80, all buyersdrop out except for John. Because John is willing to paymore than he has to for the album, he derives some benefitfrom participating in the market.3. Definition of consumer surplus: the amount a buyer is willing to payfor a good minus the amount the buyer actually pays for it.4. Note that if you had more than one copy of the album, the price in the auction would end up being lower (a little over $70 in the case of two albums) and both John and Paul would gain consumer surplus.B. Using the Demand Curve to Measure Consumer Surplus1. We can use the information on willingness to pay to derive a demandmarginal buyer . Because the demand curve shows the buyers’ willingness to pay, we can use the demand curve to measure c onsumer surplus.C. How a Lower Price Raises Consumer Surplussurplus because they are paying less for the product than before (area A on the graph).b. Because the price is now lower, some new buyers will enter the market and receive consumer surplus on these additional units of output purchased (area B on the graph).D. What Does Consumer Surplus Measure?1. Remember that consumer surplus is the difference between the amount that buyers are willing to pay for a good and the price that they actually pay.2. Thus, it measures the benefit that consumers receive from the good as the buyers themselves perceive it.III. Producer SurplusA. Cost and the Willingness to Sell1. Definition of cost: the value of everything a seller must give up to produce a good .2. Example: You want to hire someone to paint your house. You accept bidsfor the work from four sellers. Each painter is willing to work if the priceyou will pay exceeds her opportunity cost. (Note that this opportunity costthus represents willingness to sell.) The costs are:sellers will drop out except for Grandma. Because Grandma receives more than she would require to paint the house, she derives some benefit from producing in the market.4. Definition of producer surplus: the amount a seller is paid for a good minus the seller’s cost of providing it.5. Note that if you had more than one house to paint, the price in the auction would end up being higher (a little under $800 in the case of two houses) and both Grandma and Georgia would gain producer surplus.ALTERNATIVE CLASSROOM EXAMPLE:Review the material on price ceilings from Chapter 6. Redraw themarket for two-bedroom apartments in your town. Draw in a priceceiling below the equilibrium price.Then go through:consumer surplus before the price ceiling is put into place. consumer surplus after the price ceiling is put into place. You will need to take some time to explain the relationship between the producers’ willingness to sell and the cost of producing the good. The relationship between cost and the supply curve is not as apparent as the relationship between the It is important to stress that consumer surplus is measured inmonetary terms. Consumer surplus gives us a way to place amonetary cost on inefficient market outcomes (due to governmentB. Using the Supply Curve to Measure Producer Surplus1. We can use the information on cost (willingness to sell) to derive a2.the cost of the marginal seller. Because the supply curve shows the sellers’ cost (willingness to sell), we can use the supply curve to measure producer surplus.C. How a Higher Price Raises Producer Surplussurplus because they are receiving more for the product than before (area C on the graph).b. Because the price is now higher, some new sellers will enter the market and receive producer surplus on these additional units of output sold (area D on the graph).D. Producer surplus is used to measure the economic well-being of producers,ALTERNATIVE CLASSROOM EXAMPLE:Review the material on price floors from Chapter 6. Redraw the marketfor an agricultural product such as corn. Draw in a price supportabove the equilibrium price.Then go through:producer surplus before the price support is put in place.producer surplus after the price support is put in place.Make sure that you discuss the cost of the price support tomuch like consumer surplus is used to measure the economic well-being of consumers.IV. Market EfficiencyA. The Benevolent Social Planner1. The economic well-being of everyone in society can be measured by total surplus, which is the sum of consumer surplus and producer surplus:Total Surplus = Consumer Surplus + Producer SurplusTotal Surplus = (Value to Buyers – Amount Paid byBuyers) +(Amount Received by Sellers – Cost to Sellers)Because the Amount Paid by Buyers = Amount Received bySellers:2. Definition of efficiency: the property of a resource allocation of maximizing the total surplus received by all members of society .3. Definition of equality: the property of distributing economicprosperity uniformly the members of society .a. Buyers who value the product more than the equilibrium price will purchase the product; those who do not, will not purchase the product. Inother words, the free market allocates the supply of a good to the buyers who value it most highly, as measured by their willingness to pay.b. Sellers whose costs are lower than the equilibrium price will produce the product; those whose costs are higher, will not produce the product. Inother words, the free market allocates the demand for goods to the sellers who can produce it at the lowest cost.value of the product to the marginal buyer is greater than the cost to the marginal seller so total surplus would rise if output increases.Pretty Woman, Chapter 6. Vivien (Julia Roberts) and Edward(Richard Gere) negotiate a price. Afterward, Vivien reveals shewould have accepted a lower price, while Edward admits he wouldhave paid more. If you have done a good job of introducingconsumer and producer surplus, you will see the light bulbs gob. At any quantity of output greater than the equilibrium quantity, the value of the product to the marginal buyer is less than the cost to the marginal seller so total surplus would rise if output decreases.3. Note that this is one of the reasons that economists believe Principle #6: Markets are usually a good way to organize economic activity.C. In the News: Ticket Scalping1. Ticket scalping is an example of how markets work to achieve anefficient outcome.2. This article from The Boston Globe describes economist Chip Case’sexperience with ticket scalping.D. Case Study: Should There Be a Market in Organs?1. As a matter of public policy, people are not allowed to sell their organs.a. In essence, this means that there is a price ceiling on organs of $0.b. This has led to a shortage of organs.2. The creation of a market for organs would lead to a more efficientallocation of resources, but critics worry about the equity of a market system for organs.V. Market Efficiency and Market FailureA. To conclude that markets are efficient, we made several assumptions about how markets worked.1. Perfectly competitive markets.2. No externalities.B. When these assumptions do not hold, the market equilibrium may not be efficient.C. When markets fail, public policy can potentially remedy the situation. SOLUTIONS TO TEXT PROBLEMS:Quick Quizzes1. Figure 1 shows the demand curve for turkey. The price of turkey is P 1and the consumer surplus that results from that price is denoted CS. Consumer surplus is the amount a buyer is willing to pay for a good minus the amount the buyer actually pays for it. It measures the benefit to buyers ofparticipating in a market.Figure 1 Figure 22. Figure 2 shows the supply curve for turkey. The price of turkey is P 1and the producer surplus that results from that price is denoted PS. Producer surplus is the amount sellers are paid for a good minus the sellers’ cost of providing it (measured by the supply curve). It measures the benefit to sellers of participating in a market.It would be a good idea to remind students that there are circumstances when the market process does not lead to the most efficient outcome. Examples include situations such as when a firm (or buyer) has market power over price or when there areFigure 33. Figure 3 shows the supply and demand for turkey. The price of turkey is P, consumer surplus is CS, and producer surplus is PS. Producing more turkeys 1than the equilibrium quantity would lower total surplus because the value to the marginal buyer would be lower than the cost to the marginal seller on those additional units.Questions for Review1. The price a buyer is willing to pay, consumer surplus, and the demand curve are all closely related. The height of the demand curve represents the willingness to pay of the buyers. Consumer surplus is the area below the demand curve and above the price, which equals the price that each buyer is willing to pay minus the price actually paid.2. Sellers' costs, producer surplus, and the supply curve are all closely related. The height of the supply curve represents the costs of the sellers. Producer surplus is the area below the price and above the supply curve, which equals the price received minus each seller's costs of producing the good.Figure 43. Figure 4 shows producer and consumer surplus in a supply-and-demand diagram.4. An allocation of resources is efficient if it maximizes total surplus, the sum of consumer surplus and producer surplus. But efficiency may not be the only goal of economic policymakers; they may also be concerned about equitythe fairness of the distribution of well-being.5. The invisible hand of the marketplace guides the self-interest of buyers and sellers into promoting general economic well-being. Despite decentralized decision making and self-interested decision makers, free markets often lead to an efficient outcome.6. Two types of market failure are market power and externalities. Market power may cause market outcomes to be inefficient because firms may cause price and quantity to differ from the levels they would be under perfect competition, which keeps total surplus from being maximized. Externalities are side effects that are not taken into account by buyers and sellers. As a result, the free market does not maximize total surplus.Problems and Applications1. a. Consumer surplus is equal to willingness to pay minus the price paid. Therefore, Melissa’s willingness to pay must be $200 ($120 + $80).b. Her consumer surplus at a price of $90 would be $200 $90 = $110.c. If the price of an iPod was $250, Melissa would not have purchased one because the price is greater than her willingness to pay. Therefore, she would receive no consumer surplus.2. If an early freeze in California sours the lemon crop, the supply curve for lemons shifts to the left, as shown in Figure 5. The result is a rise in the price of lemons and a decline in consumer surplus from A + B + C to just A. So consumer surplus declines by the amount B + C.Figure 5 Figure 6In the market for lemonade, the higher cost of lemons reduces the supply of lemonade, as shown in Figure 6. The result is a rise in the price of lemonade and a decline in consumer surplus from D + E + F to just D, a loss of E + F. Note that an event that affects consumer surplus in one market oftenhas effects on consumer surplus in other markets.3. A rise in the demand for French bread leads to an increase in producer surplus in the market for French bread, as shown in Figure 7. The shift of the demand curve leads to an increased price, which increases producer surplusfrom area A to area A + B + C.Figure 7The increased quantity of French bread being sold increases the demandfor flour, as shown in Figure 8. As a result, the price of flour rises, increasing producer surplus from area D to D + E + F. Note that an event that affects producer surplus in one market leads to effects on producer surplus in related markets.Figure 84. a.Figure 9b. When the price of a bottle of water is $4, Bert buys two bottles of water. His consumer surplus is shown as area A in the figure. He values hisfirst bottle of water at $7, but pays only $4 for it, so has consumer surplus of $3. He values his second bottle of water at $5, but pays only $4 for it, so has consumer surplus of $1. Thus Bert’s total consumer surplus is $3 + $1 = $4, which is the area of A in the figure.c. When the price of a bottle of water falls from $4 to $2, Bert buys three bottles of water, an increase of one. His consumer surplus consists of both areas A and B in the figure, an increase in the amount of area B. He gets consumer surplus of $5 from the first bottle ($7 value minus $2 price), $3from the second bottle ($5 value minus $2 price), and $1 from the third bottle ($3 value minus $2 price), for a total consumer surplus of $9. Thus consumer surplus rises by $5 (which is the size of area B) when the price of a bottle of water falls from $4 to $2.5. a.Figure 10b. When the price of a bottle of water is $4, Ernie sells two bottles of water. His producer surplus is shown as area A in the figure. He receives $4 for his first bottle of water, but it costs only $1 to produce, so Ernie has producer surplus of $3. He also receives $4 for his second bottle of water, which costs $3 to produce, so he has producer surplus of $1. Thus Ernie’s total producer surplus is $3 + $1 = $4, which is the area of A in the figure.c. When the price of a bottle of water rises from $4 to $6, Ernie sells three bottles of water, an increase of one. His producer surplus consists of both areas A and B in the figure, an increase by the amount of area B. He gets producer surplus of $5 from the first bottle ($6 price minus $1 cost), $3 from the second bottle ($6 price minus $3 cost), and $1 from the third bottle ($6 price minus $5 price), for a total producer surplus of $9. Thus producer surplus rises by $5 (which is the size of area B) when the price of a bottle of water rises from $4 to $6.6. a. From Ernie’s supply schedule and Bert’s demand schedule, thean equilibrium quantity of two.b. At a price of $4, consumer surplus is $4 and producer surplus is $4, as shown in Problems 3 and 4 above. Total surplus is $4 + $4 = $8.c. If Ernie produced one less bottle, his producer surplus would decline to $3, as shown in Problem 4 above. If Bert consumed one less bottle, hisconsumer surplus would decline to $3, as shown in Problem 3 above. So total surplus would decline to $3 + $3 = $6.d. If Ernie produced one additional bottle of water, his cost would be $5, but the price is only $4, so his producer surplus would decline by $1. If Bert consumed one additional bottle of water, his value would be $3, but the price is $4, so his consumer surplus would decline by $1. So total surplus declines by $1 + $1 = $2.7. a. The effect of falling production costs in the market for stereos results in a shift to the right in the supply curve, as shown in Figure 11. As a result, the equilibrium price of stereos declines and the equilibriumquantity increases.Figure 11b. The decline in the price of stereos increases consumer surplus from area A to A + B + C + D, an increase in the amount B + C + D. Prior to the shift in supply, producer surplus was areas B + E (the area above the supply curve and below the price). After the shift in supply, producer surplus is areas E + F + G. So producer surplus changes by the amount F + G – B, which may be positive or negative. The increase in quantity increases producer surplus, while the decline in the price reduces producer surplus. Because consumer surplus rises by B + C + D and producer surplus rises by F + G – B, total surplus rises by C + D + F + G.c. If the supply of stereos is very elastic, then the shift of the supply curve benefits consumers most. To take the most dramatic case, suppose the supply curve were horizontal, as shown in Figure 12. Then there is no producer surplus at all. Consumers capture all the benefits of falling production costs, with consumer surplus rising from area A to area A + B.Figure 128. Figure 13 shows supply and demand curves for haircuts. Supply equals demand at a quantity of three haircuts and a price between $4 and $5. Firms A, C, and D should cut the hair of Ellen, Jerry, and Phil. Oprah’s willingnessto pay is too low and firm B’s costs are too high, so they do not participate. The maximum total surplus is the area between the demand and supply curves, which totals $11 ($8 value minus $2 cost for the first haircut, plus $7 value minus $3 cost for the second, plus $5 value minus $4 cost for the third).Figure 139. a. The effect of falling production costs in the market for computers results in a shift to the right in the supply curve, as shown in Figure 14. As a result, the equilibrium price of computers declines and the equilibrium quantity increases. The decline in the price of computers increases consumer surplus from area A to A + B + C + D, an increase in the amount B + C + D.Figure 14 Figure 15Prior to the shift in supply, producer surplus was areas B + E(the area above the supply curve and below the price). After theshift in supply, producer surplus is areas E + F + G. So producersurplus changes by the amount F + G – B, which may be positive ornegative. The increase in quantity increases producer surplus,while the decline in the price reduces producer surplus. Becauseconsumer surplus rises by B + C + D and producer surplus rises byF +G – B, total surplus rises by C + D + F + G.b. Because typewriters are substitutes for computers, the decline in the price of computers means that people substitute computers for typewriters, shifting the demand for typewriters to the left, as shown in Figure 15. The result is a decline in both the equilibrium price and equilibrium quantity of typewriters. Consumer surplus in the typewriter market changes from area A + B to A + C, a net change of C – B. Producer surplus changes from area C + D + E to area E, a net loss of C + D. Typewriter producers are sad about technological advances in computers because their producer surplus declines.c. Because software and computers are complements, the decline in the price and increase in the quantity of computers means that the demand for software increases, shifting the demand for software to the right, as shown in Figure 16. The result is an increase in both the price and quantity of software. Consumer surplus in the software market changes from B + C to A + B, a net change of A – C. Producer surplus changes from E to C + D + E, an increase of C + D, so software producers should be happy about the technological progress in computers.Figure 16d. Yes, this analysis helps explain why Bill Gates is one the world’s richest people, because his company produces a lot of software that is a complement with computers and there has been tremendous technological advance in computers.10. a. With Provider A, the cost of an extra minute is $0. WithProvider B, the cost of an extra minute is $1.b. With Provider A, my friend will purchase 150 minutes [= 150 –(50)(0)]. With Provider B, my friend would purchase 100 minutes [=150 – (50)(1)].c. With Provider A, he would pay $120. The cost would be $100 with Provider B.Figure 17d. Figure 17 shows the friend’s demand. With Provider A, he buys 150minutes and his consumer surplus is equal to (1/2)(3)(150) – 120= 105. With Provider B, his consumer surplus is equal to(1/2)(2)(100) = 100.e. I would recommend Provider A because he receives greater consumer surplus.11. a. Figure 18 illustrates the demand for medical care. If each procedure has a price of $100, quantity demanded will be Q1 procedures.Figure 18b. If consumers pay only $20 per procedure, the quantity demanded will be Qprocedures. Because the cost to society is $100, the number of procedures 2performed is too large to maximize total surplus. The quantity that maximizes total surplus is Q1 procedures, which is less than Q2.c. The use of medical care is excessive in the sense that consumers get procedures whose value is less than the cost of producing them. As a result, the economy’s total surplus is reduced.d. To prevent this excessive use, the consumer must bear the marginal cost of the procedure. But this would require eliminating insurance. Another possibility would be that the insurance company, which pays most of the marginal cost of the procedure ($80, in this case) could decide whether the procedure should be performed. But the insurance company does not get the benefits of the procedure, so its decisions may not reflect the value to the consumer.。
微观经济学(曼昆)知识点梳理
1.经济学十大原理1.1.在效率(efficiency)和公平(equality)之间权衡和取舍1.2.机会成本(opportunity cost)1.3.理性人(rational people)考虑边际变动(marginal change)1.4.激励(incentive)1.5.贸易1.6.市场能够很好地组织经济活动1.7.市场需要产权(property rights),政府有时可以促进效率和平等,但也可能因为市场权力或外部性造成市场失灵(market failure)。
1.8.一国的生活水平取决于他生产产品和服务的能力,即生产率(productivity),生产率的增长率决定了平均收入的增长率。
1.9.通货膨胀(inflation)1.10.在经济周期中,人们需要平衡通货膨胀和失业2.经济思维2.1.科学的方法2.2.假设思维2.3.经济模型2.4.循环流量图(circular-flow diagram)2.5.生产可能性边界(production possibilities frontier)2.6.微观(microeconomics)与宏观(macroeconomics)2.7.实证表述(positive statements)与规范表述(normative statements)3.贸易4.供给与需求4.1.市场:某服务或物品的买者和卖者组成的群体。
4.2.需求量(quantity demand):买者愿意并能够购买的量。
其他条件不变,价格上升,需求量减少;价格下降,需求量增加,此为需求定理(law of demand)5.弹性(elasticity)5.1.弹性是数量对于价格变动的反应程度。
替代品(substitutes)、奢侈品往往富有弹性,互补品(complements)、必需品往往缺乏弹性;广义的市场缺乏弹性(inelastic),狭义的市场富有弹性;长期比短期市场更富有弹性。
曼昆经济学原理微观名词解释9-12(中英)

CHAPTER 9Application: International TradeWorld price: the price of a good that prevails in the world market for that good世界价格:一种物品在世界市场上通行的价格。
Tariff: a tax on goods produced abroad and sold domestically关税:对在国外生产而在国内销售的物品征收的一种税。
CHAPTER 10ExternalitiesExternality: the uncompensated impact of one person’s actions on the well-being of a bystander外部性:一个人的行为对旁观者福利的无补偿的影响Internalizing the externality: altering incentives so that people take into account the external effects of their actions外在性内部化:改变激励,以使人们考虑到自己行为的外部效应Corrective tax: a tax designed to induce private decision makers to take into account the social costs that arise from a negative externality矫正税:旨在引导私人决策者考虑负外部性引起的社会成本的税收Coase theorem: the proposition that if private parties canbargain without cost over the allocation of resources, they can solve the problem of externalities on their own科斯定理:认为如果私人各方可以无成本的就资源配置进行协商,那么他们就可以自己解决外部性问题的观点。
曼昆微观经济学chapter12
12
Copyright © 2006 Nelson, a division of Thomson Canada Ltd.
Learning Objectives
●Get an overview of how the Canadian government raises and spends money ●Examine the efficiency costs of taxes ●Learn alternative ways to judge the equity of a tax system ●See why studying tax incidence is crucial for evaluating tax equity ●Consider the tradeoff between efficiency and equity in the design of a tax system
Copyright © 2006 Nelson, a division of Thomson Canada Ltd.
The Federal Government
Spending ●Federal spending goes to interest on the debt and program spending
Table 4 Federal Governments Spending, 2002-2003 2002-
Copyright © 2006 Nelson, a division of Thomson Canada Ltd. Copyright©2004 South-Western
The Federal Government
曼昆微观经济学第四版关键概念中英文对照
微观经济学关键概念中英文对照CHAPTER 1scarcity稀缺性economics经济学efficiency效率equity平等opportunity cost机会成本rational people理性人marginal changes边际变动incentive激励market economy市场经济property rights产权market failure市场失灵externality外部性market power市场势力productivity生产率inflation通货膨胀business cycle经济周期CHAPTER 2circular-flow diagram循环流向图production possibilities frontier生产可能性边界microeconomics微观经济学macroeconomics宏观经济学positive statements实证表述normative statements规范表述CHAPTER 3absolute advantage绝对优势opportunity cost机会成本comparative advantage比较优势imports进口exports出口CHAPTER 4market市场competitive market竞争市场quantity demanded需求量law of demand需求定理demand schedule需求表demand curve需求曲线normal good正常物品inferior good低档物品substitutes替代品complements互补品quantity supplied供给量law of supply供给定理supply schedule供给表supply curve供给曲线equilibrium均衡equilibrium price均衡价格equilibrium quantity均衡数量surplus过剩shortage短缺law of supply and demand供求定理CHAPTER 5elasticity弹性price elasticity of demand需求价格弹性total revenue总收益income elasticity of demand需求收入弹性cross-price elasticity of demand需求的交叉价格弹性price elasticity of supply供给价格弹性CHAPTER 6price ceiling价格上限price floor价格下限tax incidence税收归宿CHAPTER 7welfare economics福利经济学willingness to pay支付意愿consumer surplus消费者剩余cost成本producer surplus生产者剩余efficiency效率equity平等CHAPTER 8deadweight loss无谓损失CHAPTER 9world price世界价格tariff关税CHAPTER 10externality外部性internalizing the externality外部性的内在化Coase theorem科斯定理transaction costs交易成本corrective tax矫正税CHAPTER 11Excludability排他性rivalry in consumption消费中的竞争性private goods私人物品public goods公有物品common resources公有资源free rider搭便车者cost-benefit analysis成本收益分析Tragedy of the Commons公有地悲剧CHAPTER 12CHAPTER 13total revenue总收益total cost总成本profit利润explicit costs显性成本implicit costs隐性成本economic profit经济利润accounting profit会计利润production function生产函数marginal product边际产量diminishing marginal product边际产量递减fixed costs固定成本variable costs可变成本average total cost平均总成本average fixed cost平均固定成本average variable cost平均可变成本marginal cost边际成本efficient scale有效规模economies of scale规模经济diseconomies of scale规模不经济constant returns to scale规模收益不变CHAPTER 14competitive market竞争市场average revenue平均收益marginal revenue边际收益sunk cost沉没成本CHAPTER 15Monopoly垄断企业natural monopoly自然垄断price discrimination价格歧视CHAPTER 16Oligopoly寡头monopolistic competition垄断竞争collusion勾结cartel卡特尔Nash equilibrium纳什均衡game theory博弈论prisoners'dilemma囚徒困境dominant strategy占优策略CHAPTER 17monopolistic competition垄断竞争CHAPTER 18factors of production生产要素production function生产函数marginal product of labor劳动的边际产量diminishing marginal product边际产量递减value of the marginal product边际产量值capital资本CHAPTER 19compensating differential补偿性工资差别human capital人力资本union工会strike罢工efficiency wages效率工资discrimination歧视CHAPTER 20poverty rate贫困率poverty line贫困线in-kind transfers实物转移支付life cycle生命周期permanent income持久收入utilitarianism功利主义utility效用liberalism自由主义maximin criterion最大化标准social insurance社会保障libertarianism自由意志主义welfare福利negative income负所得税。
12design_tax

• Excise Taxes: taxes on specific goods like gasoline, cigarettes, and alcoholic beverages.(消费税:对于某些特 殊物品,例如汽油,香烟,酒精饮料征收的税。)
State and Local Governments(州和地方政 府)
• State and local governments collect about 40 percent of taxes paid.
Copyright © 2004 South-Western/Thomson Learning
Individual Income Tax, 50% Social Insurance Tax, 35% Corporate Tax, 8% Other, 8%
Copyright © 2004 South-Western/Thomson Learning
The Federal Government
Copyright © 2004 South-Western/Thomson Learning
The Federal Government
• The Federal Government and Taxes (联邦政府和税 收)
• Payroll Taxes: tax on the wages that a firm pays its workers. (工薪税:对企业支付给工人的工资征税。)
曼昆的《微观经济学基础》课业笔记 英文版
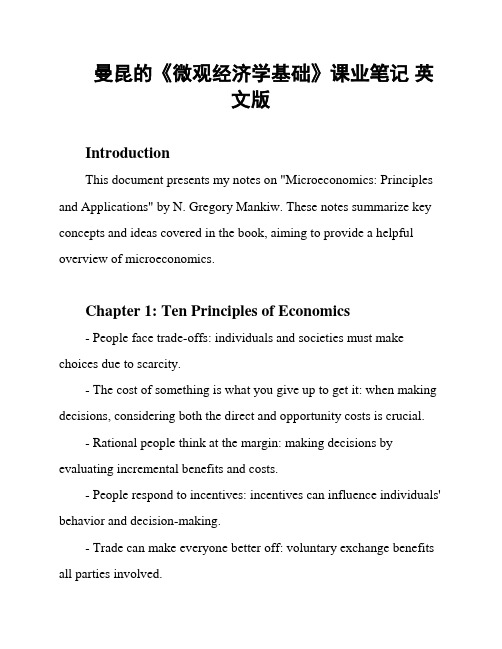
曼昆的《微观经济学基础》课业笔记英文版IntroductionThis document presents my notes on "Microeconomics: Principles and Applications" by N. Gregory Mankiw. These notes summarize key concepts and ideas covered in the book, aiming to provide a helpful overview of microeconomics.Chapter 1: Ten Principles of Economics- People face trade-offs: individuals and societies must make choices due to scarcity.- The cost of something is what you give up to get it: when making decisions, considering both the direct and opportunity costs is crucial.- Rational people think at the margin: making decisions by evaluating incremental benefits and costs.- People respond to incentives: incentives can influence individuals' behavior and decision-making.- Trade can make everyone better off: voluntary exchange benefits all parties involved.- Markets are usually a good way to organize economic activity: markets coordinate exchanges efficiently.- A country's standard of living depends on its ability to produce goods and services: productivity is key.- Prices rise when the government prints too much money: inflation can be caused by excessive money supply growth.- Society faces a short-run trade-off between inflation and unemployment: the Phillips curve illustrates this trade-off.Chapter 2: Thinking Like an Economist- Economists use models to simplify reality and understand economic behavior.- Assumptions in economic models help focus on essential elements.- Opportunity cost is the true cost of something and is measured by what we give up to obtain it.Chapter 3: Interdependence and the Gains from Trade- Specialization and international trade result in greater production efficiency and consumption possibilities.- Both parties benefit from trade even if one has an absolute advantage in both goods.- Prices reflect the opportunity cost and guide resources to their most valued uses.Chapter 4: The Market Forces of Supply and Demand- Markets consist of buyers and sellers, and their interactions determine prices and quantities.- Demand curve shows the relationship between price and quantity demanded, while supply curve reflects the relationship between price and quantity supplied.- Market equilibrium occurs when quantity demanded equals quantity supplied.- Changes in demand or supply shift their respective curves, leading to changes in equilibrium price and quantity.ConclusionThese notes provide a brief summary of the key concepts covered in "Microeconomics: Principles and Applications." Studying this bookallows for a deeper understanding of microeconomic principles and their applications in the real world.。
最新曼昆经济学原理英文版文案加习题答案12章

曼昆经济学原理英文版文案加习题答案12章WHAT’S NEW IN THE S EVENTH EDITION:All tables have been updated to the most recently available numbers. A new In the News box on “Tax Expenditures" has been added.LEARNING OBJECTIVES:By the end of this chapter, students should understand:➢how the U.S. government raises and spends money.➢the efficiency costs of taxes.➢alternative ways to judge the equity of a tax system.➢why studying tax incidence is crucial for evaluating tax equity.➢the trade-off between efficiency and equity in the design of a tax system.CONTEXT AND PURPOSE:Chapter 12 is the third chapter in a three-chapter sequence on the economics of the public sector. Chapter 10 addressed externalities. Chapter 11 addressed public goods and common resources. Chapter 12 addresses the tax system. Taxes are inevitable because when the government remedies an externality, provides a public good, or regulates the use of a common resource, it needs tax revenue to perform these functions.The purpose of Chapter 12 is to build on the lessons learned about taxes in previous chapters. We have seen that a tax reduces the quantity sold in a market, that the distribution of the burden of a tax depends on the relative elasticities of supply and demand, and that taxes cause deadweight losses. We expand the study of taxes in Chapter 12 by addressing how the U.S. government raises and spends money. The difficulty of making a tax system both efficient and equitable is then discussed.KEY POINTS:• The U.S. government raises revenue using various taxes. The most important taxes for thefederal government are individual income taxes and payroll taxes for social insurance. The most important taxes for state and local governments are sales taxes and property taxes.• The efficiency of a tax system refers to the costs it imposes on taxpayers. There are two costsof taxes beyond the transfer of resources from the taxpayer to the government. The first is the deadweight loss that arises as taxes alter incentives and distort the allocation of resources. The second is the administrative burden of complying with the tax laws.• The equity of a tax system concerns whether the tax burden is distributed fairly among thepopulation. According to the benefits principle, it is fair for people to pay taxes based on the benefits they receive from the government. According to the ability-to-pay principle, it is fair for people to pay taxes based on their capability to handle the financial burden. Whenevaluating the equity of a tax system, it is important to remember a lesson from the study of tax incidence: The distribution of tax burdens is not the same as the distribution of tax bills.• When considering changes in the tax laws, policymakers often face a trade-off betweenefficiency and equity. Much of the debate over tax policy arises because people give different weights to these two goals.CHAPTER OUTLINE:I. A Financial Overview of the U.S. GovernmentA. Figure 1 shows the level of government revenue in the United States, including federal, state, and local governments, as a percentage of total income for the U.S. economy.1. The role of government has grown substantially over the past century.2. The government’s revenue from taxation has grown at a faster rate than the economy’s levelof income.B. Table 1 compares the tax burden for several major countries, as measured by the government’stax revenue as a percentage of the nation’s total income.1. The United States has a low tax burden compared to most other advanced economies.2. Many European nations have much higher taxes, which finance a more generous social safetynet.C. The Federal Government1. Receiptsa. Table 2 reports the receipts of the federal government in 2011.b. Total receipts were $2,520 billion or $8,077 per person.c. The largest source of revenue is the individual income tax.d. A family’s income tax liability is how much it owes in taxes based on income. This tax isnot proportional to income. It is based on income minus deductions, and the tax rate rises as income rises. Table 3 presents federal tax rates for 2013.e. Other important revenue sources include payroll taxes (social insurance taxes), the corporate income tax, and excise taxes.2. Spendinga. Table 4 reports where the federal government spent its budget in 2011.b. Total spending was $3,757 billion or $12,042 per person.c. The largest category of expenditure is for income security, which includes Social Security, unemployment insurance payments, and welfare payments. The second largest expenseis health programs, including Medicare, Medicaid, and spending on medical research.d. The next largest category of spending is national defense.e. Another important category of expenditure is net interest on the federal debt.3. Definition of budget deficit: an excess of government spending over governmentreceipts.spending.D. Case Study: The Fiscal Challenge Ahead1. From 2009 to 2012, the U.S. federal government had budget deficits that exceeded $1 trillion every year, the largest budget shortfalls since World War II.2. Long-term projections of the government’s budget show that this is expected to rise dramatically in the decades ahead.a. The population ages 65 and older is growing; thus, Medicare and Social Security expenditures will rise as well.b. In addition, the costs of Medicare, Medicaid and government-subsidized health insurance are affected by the rising cost of medical care.E. State and Local Government1. Receiptsa. Table 5 reports the receipts from state and local governments for 2011.b. Total receipts were $2,064 billion or $6,615 per person.c. The two most important taxes for state and local governments are sales taxes andproperty taxes.d. State and local governments also levy individual and corporate income taxes.e. State governments also receive funding from the federal government.2. Spendinga. Table 6 shows how state and local governments spent their budgets in 2011.b. The largest category of spending was education, while the second largest category washealth programs.II. Taxes and EfficiencyA. Well-designed tax policies minimize the deadweight losses that occur when taxes distortincentives. They also minimize the administrative burdens that taxpayers face when complying with tax laws.B. Deadweight Losses1. Taxes lead to deadweight losses because they lower total surplus.2. Case Study: Should Income or Consumption Be Taxed?a. Because interest income is taxed, the current income tax laws discourage saving.b. If consumption (instead of income) is taxed, this disincentive disappears.c. European nations tend to rely more on consumption taxes than does the United States.C. Administrative Burden1. The current tax system is quite burdensome because of the large amount of paperworkrequired both when filling out tax forms and keeping records throughout the year.2. Many taxpayers spend resources hiring accountants and tax lawyers.a. People often need help filling out complex tax forms.b. Individuals may also want to learn how to arrange their affairs to reduce their tax burden.D. Marginal Tax Rates versus Average Tax Rates1. Definition of average tax rate: total taxes paid divided by total income.2. Definition of marginal tax rate: the amount that taxes increase from an additionaldollar of income.3. The average tax rate measures the sacrifice made by a taxpayer; the marginal tax ratemeasures how much the tax system distorts incentives.E. Lump-Sum Taxes1. Definition of lump-sum tax: a tax that is the same amount for every person.2. For this type of tax, the marginal tax rate is equal to zero.3. This is the most efficient type of tax because it does not distort incentives and thus has noeffect on total surplus. There is also little administrative burden with this type of tax.4. However, a lump-sum tax would take the same amount from the poor and the rich, whichmost people would view as unfair.III. Taxes and EquityA. The Benefits Principle1. Definition of benefits principle: the idea that people should pay taxes based on thebenefits they receive from government services.2. This principle tries to make public goods similar to private goods.3. An example of this would be the tax on gasoline, especially if revenues from the tax are used to build or maintain roads.B. The Ability-to-Pay Principle1. Definition of ability-to-pay principle: the idea that taxes should be levied on aperson according to how well that person can shoulder the burden.2. Definition of vertical equity: the idea that taxpayers with a greater ability to paytaxes should pay larger amounts.a. Three tax systems: proportional, regressive, and progressive.b. Definition of proportional tax: a tax for which high-income and low-incometaxpayers pay the same fraction of income.c. Definition of regressive tax: a tax for which high-income taxpayers pay a smaller fraction of their income than do low-income taxpayers.d. Definition of progressive tax: a tax for which high-income taxpayers pay a larger fraction of their income than do low-income taxpayers.e. Case Study: How the Tax Burden Is Distributed – Table 8 shows that the tax burden in this country is highly progressive. In addition, studies have shown that, if transferpayments are also taken into account, the degree of progressivity is substantial.3. Definition of horizontal equity: the idea that taxpayers with similar abilities to pay taxes should pay the same amount.C. Tax Incidence and Tax Equity1. The burden of a tax is not always borne by who pays the tax bill.2. Example: tax on fur coats. This will ultimately affect those who sell and produce the fur coats because the quantity of fur coats demanded will fall due to the increase in price.3. Case Study: Who Pays the Corporate Income Tax?a. The corporate income tax is popular among voters because a corporation is nonhumanand faceless.b. However, the burden of the corporate tax falls on stockholders, customers, and workers.c. An increase in corporate taxes means an increase in the cost of producing the product.Firms will cut back production (which lowers supply and raises the price to the consumer) and possibly lay off workers (which causes unemployment, lower wages, or both).D. In the News: Tax Expenditures1. Eliminating tax expenditures, special tax cuts for things like mortgage interest and charitablegiving, could result in lower taxes and fiscal sustainability.2. This article from The New York Times discussing the benefits of eliminating tax expendituresand the politics associated with such a proposal.IV. Conclusion: The Trade-off between Equity and EfficiencySOLUTIONS TO TEXT PROBLEMS:Quick Quizzes1. The two most important sources of tax revenue for the federal government are individualincome taxes and payroll taxes (social insurance taxes). The two most important sources oftax revenue for state and local governments are sales taxes and property taxes.2. The efficiency of a tax system depends on the costs of collecting a given amount of taxrevenue. One tax system is more efficient than another if the same amount of tax revenuecan be raised at a lower cost.A tax system can be inefficient because of the deadweight losses that result when taxesdistort the decisions that people make and because of the administrative burdens thattaxpayers bear as they comply with tax laws. An efficient tax system has low deadweightlosses and small administrative burdens.3. The benefits principle is the idea that people should pay taxes based on the benefits theyreceive from government services. It tries to make public goods similar to private goods bymaking those who benefit more from the public good pay more for it. The ability-to-payprinciple is the idea that taxes should be levied on a person according to how well thatperson can shoulder the burden. It tries to equalize the sacrifice each person makes towardpaying taxes.Vertical equity is the idea that taxpayers with greater ability to pay should pay largeramounts. Horizontal equity is the idea that taxpayers with similar abilities to pay should paythe same amount.Studying tax incidence is important for determining the equity of a tax system becauseunderstanding how equitable the tax system is requires understanding the indirect effects oftaxes. In many cases, the burden of the tax is borne by individuals other than those whoactually pay the tax.Questions for Review1. Over the past century, the government’s tax revenue has grown more rapidly than the rest ofthe economy. The ratio of government revenue to GDP has increased over time.2. Corporate profits are taxed first when the corporate income tax is taken out of acorporation's income. When the profits are used to pay dividends to the corporation'sshareholders, they are taxed again through individual income tax.3. The burden of a tax to taxpayers is greater than the revenue received by the governmentbecause: (1) taxes impose deadweight losses by reducing the quantity of goods producedand purchased to below their efficient level; and (2) taxes entail a costly administrativeburden on taxpayers.4. Some economists advocate taxing consumption rather than income because taxing incomediscourages saving. A consumption tax would not distort individuals’ saving decisions.5. The marginal tax rate on a lump-sum tax is zero. This type of tax has no deadweight loss,because it does not distort incentives.6. Wealthy taxpayers should pay more taxes than poor taxpayers should because: (1) theybenefit more from public services; and (2) they have a greater ability to pay.7. Horizontal equity refers to the idea that families in the same economic situation should betaxed equally. The concept of horizontal equity is hard to apply because families differ inmany ways, so it is not obvious how to tax them equitably. For example, two families withthe same income may have different numbers of children and different levels of medicalexpenses.Quick Check Multiple Choice1. b2. c3. a4. a5. d6. cProblems and Applications1. The federal government had a budget deficit in 2013. Policymakers expect budget deficitsover the next decade.2. a. The increase in revenue of the total government is attributable more to increases in stateand local government revenue than to federal government revenue. In 1964, state andlocal government revenue was 37% of total government revenue; by 2012, it had risento more than 48%.b. Personal income taxes accounted for more of the total revenue of federal and state andlocal governments in 2012 than in 1964; social insurance taxes accounted for asubstantially greater proportion in 2012 than in 1964; and corporate taxes accounted fora lower proportion in 2012 than in 1964.c. Transfer payments now account for a much greater proportion of the total expendituresof federal and state and local governments, while purchases account for a much smallerproportion. Expenditures on interest and subsidies are consistent.3. a. If the number of retirees is rising and total expenditures are frozen, then benefits perretiree will decline over time. Because the number of workers is rising, albeit slowly, taxpayments per worker would decline slowly over time.b. If benefits per retiree were frozen, total expenditures would rise quickly, along with thenumber of retirees. To pay for the increased expenditures, tax payments per workerwould rise, because the number of workers isn't growing as rapidly as the number ofretirees.c. If tax payments per worker were frozen, total expenditures would rise slowly, at thesame rate as the growth rate of the number of workers. Because the number of retireesis rising more rapidly, benefits per retiree would decline over time.d. The answers to parts (a), (b), and (c) suggest there is no easy solution. Either workerswill pay more per person or retirees will get fewer benefits per person. Policymakers mayeventually be forced to compromise, both reducing benefits per retiree and increasingtax payments per worker.4. If you earn $20,000 a year, then you pay federal income taxes in two parts: 10% on the first$8,925 of income and 15% on the amount above $8,925. Thus, your federal income taxesare ($8,925 ⨯ 0.10) + ($11,075 ⨯ 0.15) = $892.50 + $1661.25 = $2,553.75. You also pay $20,000 ⨯ 0.153 = $3,060 in federal payroll taxes and $20,000 ⨯ 0.04 = $800 in stateincome taxes, for a total tax bill of $6,413.75. Your average tax rate is $6,441.25/$20,000 =0.321 = 32.1%. Your marginal tax rate is 0.15 + 0.153 + 0.04 = 0.343 = 34.3%.If you earn $40,000 a year, then you pay federal income taxes in three parts: 10% on the first $8,925 of income, 15% for additional income up to $36,425, and 25% for the remaining $3,5750 of income. Thus, your federal income taxes are ($8,925 ⨯ 0.10) + ($27,500 ⨯ 0.15) + ($3,575 ⨯ 0.25) = $892.50 + $4,125 + $893.75 = $5911.25. You also pay $40,000 ⨯0.153 = $6,120 in federal payroll taxes, and $40,000 ⨯ 0.04 = $1,600 in state income taxes.Your total tax bill is $13,631.25. Your average tax rate is $13,631.25/$40,000 = 0.341 =34.1%. Your marginal tax rate is 0.25 + 0.153 + 0.04 = 0.443 = 44.3%.5. Excluding food and clothing from the sales tax is justified on equity grounds because poorpeople spend a greater proportion of their income on those items. By exempting them from taxation, the system makes the rich bear a greater burden of taxation than the poor. From the point of view of efficiency, however, excluding food and clothing from the sales tax is inefficient, because the incentives to purchase food and clothing rather than other items are likely affected by this tax exemption. This leads to an inefficient allocation of resources. In addition, because the demand for food and clothing is likely to be relatively inelastic, thedeadweight loss from a tax on these goods would be relatively small (when compared with a tax on a good whose demand is relatively elastic).6. a. An individual must pay taxes on the asset only when he or she sells it. Thus, this tax lawaffects the individual’s decision of whether to keep or sell the asset. Tax revenues onaccrued capital gains are only received by the government when an individual actuallysells the asset. Lowering the tax rate on capital gains may induce individuals to sellassets that they have been holding to avoid paying the taxes on the accrued capital gains.b. Because capital gains are not realized and thus taxed until the investment is sold,investors can avoid the tax by not selling the investment. When capital gains taxes arelowered, even temporarily, the investor has an incentive to sell the investment while thetax is lower. Thus, sales to realize capital gains will increase at the lower rate and so willtax revenue on the increased volume of transactions.c It is inefficient to tax only realized capital gains because it distorts the incentives anindividual faces with regard to keeping or selling a particular asset. However, it may bedifficult to estimate the rise in the value of an asset prior to its sale.7. If the state raises its sales tax from 5% to 6%, it is not plausible that sales tax revenue willincrease 20%. The increase in the tax rate is 20%, so the only way tax revenue couldincrease 20% would be if total spending didn't fall in response to the tax increase, which is unlikely. Instead, the higher tax would raise the price of goods, so people would spend less.Thus, tax revenue might go up, because the tax rate is higher, but by less than 20%. There is a possibility that tax revenues will fall.8. The effect of the Tax Reform Act of 1986 on interest payments was to reduce consumer debtand increase home equity debt. People started financing general expenditures through home equity loans and paid down their mortgages less quickly.9. a. The fact that visitors to many national parks pay an entrance fee is an example of thebenefits principle, because people are paying for the benefits they receive.b. The fact that local property taxes support elementary and secondary schools is anexample of the ability-to-pay principle, because if you own more expensive property, you must pay more tax.c. The setup of airport trust funds is an example of the benefits principle, because use ofthe airport generates tax revenue that pays for upkeep of the airport.。
- 1、下载文档前请自行甄别文档内容的完整性,平台不提供额外的编辑、内容补充、找答案等附加服务。
- 2、"仅部分预览"的文档,不可在线预览部分如存在完整性等问题,可反馈申请退款(可完整预览的文档不适用该条件!)。
- 3、如文档侵犯您的权益,请联系客服反馈,我们会尽快为您处理(人工客服工作时间:9:00-18:30)。
Copyright © 2004 South-Western/Thomson Learning
Table 2 Receipts of the Federal Government: 2001
Copyright©2004 South-Western
Receipts of the Federal Government...
• Policymakers have two objectives in designing a tax system...
• • Efficiency Equity
Copyright © 2004 South-Western/Thomson Learning
TAXES AND EFFICIENCY
Revenue as Percent of 35 GDP 30 Total government
25 State and local 20
15 Federal 10
5
0 1902
1913
1922 1927 1932
1940
1950
1960
1970
1980
1990
2000
Copyright © 2004 South-Western
• Budget Deficit
• A budget deficit is an excess of government spending over government receipts.
Copyright © 2004 South-Western/Thomson Learning
Table 4 Spending of the Federal Government: 2001
Table 1 Central Government Tax Revenue as a Percent of GDP
Copyright©2004 South-Western
The Federal Government
• The U.S. federal government collects about two-thirds of the taxes in our economy.
Copyright © 2004 South-Western/Thomson Learning
The Federal Government
• Budget Surplus
• A budget surplus is an excess of government receipts over government spending.
• A budget surplus may be used to reduce the government’s outstanding debts.
Copyright © 2004 South-Western/Thomson Learning
State and Local Governments
Copyright©2004 South-Western
Federal Government Spending: 2001
Social Security, 23%
Defense, 17% Net Interest, 14% Income security, 14% Medicare, 12%
Health, 9%
Table 5 Receipts of State and Local Governments: 1999
Copyright©2004 South-Western
State and Local Government
• Spending
• • • • Education Public Welfare Highways Other
Copyright © 2004 South-Western/Thomson Learning
TAXES AND EFFICIENCY
• The Cost of Taxes to Taxpayers
• The tax payment itself • Deadweight losses • Administrative burdens
100
Today, taxes account for up to a third of the average American’s income.
80 60 40 20 0
1789
Today
Copyright © 2004 South-Western/Thomson Learning
Figure 1 Government Revenue as a Percentage of GDP
Copyright © 2004 South-Western/Thomson Learning
The Federal Government
• Federal Government Spending
• Expense Category:
• • • • • • • Social Security National Defense Income Security Net Interest Medicare Health Other
The Design of the Tax System
12Leabharlann Copyright©2004 South-Western
“In this world nothing is certain but death and taxes.” . . . Benjamin Franklin
100
80 60 40 20
Copyright © 2004 South-Western/Thomson Learning
Deadweight Losses
• Because taxes distort incentives, they entail deadweight losses.
• The deadweight loss of a tax is the reduction of the economic well-being of taxpayers in excess of the amount of revenue raised by the government.
Copyright © 2004 South-Western/Thomson Learning
The Federal Government
• Individual Income Taxes
• The marginal tax rate is the tax rate applied to each additional dollar of income. • Higher-income families pay a larger percentage of their income in taxes.
Other, 14%,
Copyright © 2004 South-Western/Thomson Learning
The Federal Government
• Financial Conditions of the Federal Budget
• A budget deficit occurs when there is an excess of government spending over government receipts.
• State and local governments collect about 40 percent of taxes paid.
Copyright © 2004 South-Western/Thomson Learning
State and Local Government
• Receipts
Copyright © 2004 South-Western/Thomson Learning
The Federal Government
• The Federal Government and Taxes
• Payroll Taxes: tax on the wages that a firm pays its workers.
• One tax system is more efficient than another if it raises the same amount of revenue at a smaller cost to taxpayers. • An efficient tax system is one that imposes small deadweight losses and small administrative burdens.
Copyright © 2004 South-Western/Thomson Learning
Table 6 Spending of State and Local Governments: 1999
Copyright©2004 South-Western
TAXES AND EFFICIENCY
• Government finances the deficit by borrowing from the public.
• A budget surplus occurs when government receipts are greater than government spending.
Individual Income Tax, 50% Social Insurance Tax, 35% Corporate Tax, 8% Other, 8%
Copyright © 2004 South-Western/Thomson Learning
The Federal Government