全球气候变化【英文】共45页
世界气候变化Climate Change(温室效应Green House Effect)英文介绍
into space; the rest is absorbed by Earth’s system 3. Because of greenhouse gases in the atmosphere, only some of the sun’s energy is allowed to escape immediately—instead, the gases stay within the atmosphere, bouncing in all directions 4. The atmosphere is heated up as less and less gases are let out into space and more energy is absorbed by Earth
CO2 emissions Every ton of coal actually releases 2.86 tons of CO2—how is this possible?
Because coal is compressed carbon—when the carbon gets released,
Definitions according to
Global Warming process
1. The sun emits energy towards the Earth 2. The Earth reflects around 30% of the energy back
Process
Causes
What human-related causes are there? Deforestation Agriculture Fossil fuel burning Aerosol gases
全球变暖与气候变化 Global Warming And Climate Change 英语作文
On Global Warming AndClimate ChangeGlobal warming and climate change are two of the most pressing issues of the world today. Global warming refers to the heating up of the planet due to holes created on the ozone layer. The ozone layer protects our planet from harmful UV rays that the sun emits. This phenomenon causes our planet to heat up, and this concept is called >global warming which leads to climate change. There are many human-made ways in which the holes in the ozone layer are created, which are harmful to us and our entire planet.Long and Short Essays on Global Warming and Climate Change for Students and Kids in EnglishLong Essay on Global Warming and Climate Change 500 Words in EnglishBelow we have given long essay on global warming and climate change of 500 words. This long essay on global warming and climate change is suitable for students of classes 7,8,9 and 10, and also for competitive exam aspirants.The Ozone layer is a layer that covers the Earth and acts as a protective cover from the harmfulUltra Violet rays or UV rays of the sun. This layer also helps to maintain the temperature on the planet to let life sustain on the planet. Recently, the world has changed the balance of the Ozone layer and the planet. Here, we are talking about global warming and climate change.Over the last few decades, planet Earth has heated up a lot. This is called the phenomena of global warming, which means the warming up of the globe, i.e., Earth. Since we now live in the age of development and capitalism, there are factories all over the world that emit harmfulfumes. These fumes are an example of the kind of substances that create the holes in the Ozone layer. These holes allow in harmful UV rays and heat the planet.There are several reasons for global warming and climate change. The primary reason for global warming and climate change is the greenhouse effect. The greenhouse effect refers to the entrapment of heat by greenhouse gases, such as carbon dioxide, nitrous oxide, etc. between the Ozone layer and the surface of the Earth, creating more and more heat as it remaintrapped. This causes the temperature on the Earth to rise increasingly.Greenhouse gases come into the air in several ways, which are all human-made. The fumes emitted by factories, smoke released by vehicles and factories, and other instances of the burning of fossil fuels are >causes of global warming and climate change. Deforestation is one more reason for the same, as cutting down trees means more carbon dioxide in the air than there was before they were cut down.As a result of global warming and climate change, the icecaps and glaciers around theworld are melting, thereby increasing the sea level. Many islands have even become fully submerged due to the rising water levels. Extreme climatic conditions cause many people to die due to heat strokes caused by heatwaves, droughts, etc. Global warming and climate change have also caused many natural disasters, such as forest wildfires, tsunamis, floods, etc.Global warming and climate change have now reached a point where it is almost irreversible. There are a few things that we can do personally to help contain global warming and climatechange. Since vehicle emissions play a large contributing role, we can consider using modes of transport other than cars, such as walking, cycling, and public transport. Spreading awareness about global warming and climate change is one of the most important things.All in all, global warming and climate change is a terrible human-made phenomenon. We must acknowledge the damage that we, as a species, have done to our planet. It is important to understand what global warming and climate change are and to do our best to stop it from increasing more and more.Short Essay on Global Warming and Climate Change 200 Words in EnglishGlobal warming is a critical problem in the world today. It means that our planet is heating up more by the day.The Ozone layer protects the Earth from harmful ultraviolet rays of the sun. If this layer gets holes in it, it can be very dangerous for our planet. There are many gases in the air, such as carbon dioxide and nitrous oxide, which make holes in the Ozone layer, and because of this, our planet is becoming hotter. These gases come from cars, buses, trucks, factories, etc.Deforestation also adds more of these gases to the air.Global warming and climate change mean that the icy glaciers are melting and increasing the water level. There are many natural disasters because of global warming, like floods, tsunamis, droughts, etc.It is vital to become aware of global warming and climate change and make other people aware of it. We must do anything we can to stop it from increasing.10 Lines About Global Warming and Climate Change EssayGlobal warming refers to the heating up of Earth due to human activitiesThe Ozone layer protects us from harmful UV raysThe Ozone layer is depleting by the day, because of toxic gases and fumes produced on Earth (mostly by humans)The primary cause of global warming is the greenhouse effect, i.e., the entrapment ofgreenhouse gases between the Ozone layer and the surface of the Earth, creating more heat by the daySources of greenhouse gases include CFCs, burning of fossil fuels (such as to power engine vehicles), agriculture (methane produced by farm animals), factory fume emissions, etc.Due to global warming, there have been several natural disasters, such as forest fires, cyclones, etc.The sea levels are rising by the day because the planet is getting hotter, which is dangerous as it has submerged many lands.It is imperative to stop global warming and climate change or try our best to curb it.Using public transport instead of private vehicles per person is an alternative to try out to help curb global warming.It is essential to spread awareness about global warming and climate change. >FAQ’s on Essay On Global Warming And Climate ChangeQuestion 1.What does it mean by global warming and climate change?Answer:Global warming refers to the heating up of the Earth due to the depletion of the Ozone layer, the greenhouse effect, and the fumes and gases being emitted continuously by different sourceson Earth. It is incredibly harmful not only for the planet but also for living beings on the Earth.Question 2.What does it mean by the greenhouse effect, and how does it relate to global warming?Answer:In literal terms, the greenhouse effect refers to when gas comes from outside a plant greenhouse gets entrapped within the greenhouse, and remains inside to create moisture and heat. This same effect can beseen between the Earth’s surface and the Ozone layer, where hot UV rays enter through ozone holes and get trapped inside the Earth.Question 3.What are the consequences of global warming and climate change?Answer:Global warming has several consequences, such as the melting of glaciers, which leads to rising sea levels. Natural disasters increase in volume and intensity, etc. Global warming andclimate change also create hotter weather leading to higher death rates.Question 4.What can I do on my part to curb global warming?Answer:One of the most important things you can do to curb global warming is changing your mode of transport from personal vehicles to public transport spread the word about it, i.e., make people more aware, etc.。
全球气候变化Global temperature change
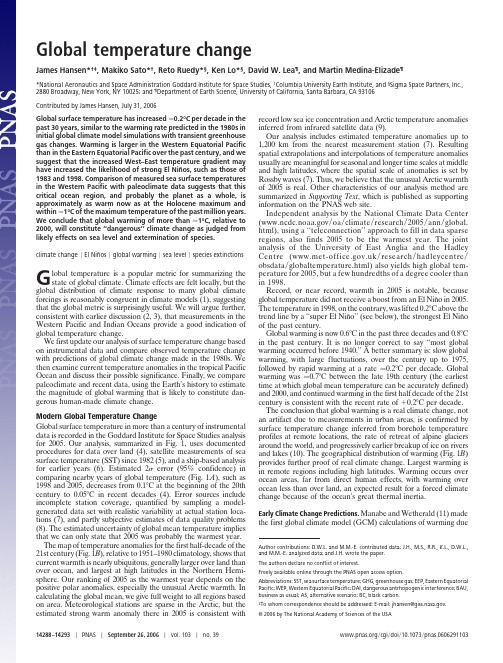
Global temperature changeJames Hansen*†‡,Makiko Sato*†,Reto Ruedy*§,Ken Lo*§,David W.Lea ¶,and Martin Medina-Elizade ¶*National Aeronautics and Space Administration Goddard Institute for Space Studies,†Columbia University Earth Institute,and §Sigma Space Partners,Inc.,2880Broadway,New York,NY 10025;and ¶Department of Earth Science,University of California,Santa Barbara,CA 93106Contributed by James Hansen,July 31,2006Global surface temperature has increased Ϸ0.2°C per decade in the past 30years,similar to the warming rate predicted in the 1980s in initial global climate model simulations with transient greenhouse gas changes.Warming is larger in the Western Equatorial Pacific than in the Eastern Equatorial Pacific over the past century,and we suggest that the increased West–East temperature gradient may have increased the likelihood of strong El Niños,such as those of 1983and parison of measured sea surface temperatures in the Western Pacific with paleoclimate data suggests that this critical ocean region,and probably the planet as a whole,is approximately as warm now as at the Holocene maximum and within Ϸ1°C of the maximum temperature of the past million years.We conclude that global warming of more than Ϸ1°C,relative to 2000,will constitute ‘‘dangerous’’climate change as judged from likely effects on sea level and extermination of species.climate change ͉El Niños ͉global warming ͉sea level ͉species extinctionsGlobal temperature is a popular metric for summarizing the state of global climate.Climate effects are felt locally,but the global distribution of climate response to many global climate forcings is reasonably congruent in climate models (1),suggesting that the global metric is surprisingly useful.We will argue further,consistent with earlier discussion (2,3),that measurements in the Western Pacific and Indian Oceans provide a good indication of global temperature change.We first update our analysis of surface temperature change based on instrumental data and compare observed temperature change with predictions of global climate change made in the 1980s.We then examine current temperature anomalies in the tropical Pacific Ocean and discuss their possible significance.Finally,we compare paleoclimate and recent data,using the Earth’s history to estimate the magnitude of global warming that is likely to constitute dan-gerous human-made climate change.Modern Global Temperature ChangeGlobal surface temperature in more than a century of instrumental data is recorded in the Goddard Institute for Space Studies analysis for 2005.Our analysis,summarized in Fig.1,uses documented procedures for data over land (4),satellite measurements of sea surface temperature (SST)since 1982(5),and a ship-based analysis for earlier years (6).Estimated 2error (95%confidence)in comparing nearby years of global temperature (Fig.1A ),such as 1998and 2005,decreases from 0.1°C at the beginning of the 20th century to 0.05°C in recent decades (4).Error sources include incomplete station coverage,quantified by sampling a model-generated data set with realistic variability at actual station loca-tions (7),and partly subjective estimates of data quality problems (8).The estimated uncertainty of global mean temperature implies that we can only state that 2005was probably the warmest year.The map of temperature anomalies for the first half-decade of the 21st century (Fig.1B ),relative to 1951–1980climatology,shows that current warmth is nearly ubiquitous,generally larger over land than over ocean,and largest at high latitudes in the Northern Hemi-sphere.Our ranking of 2005as the warmest year depends on the positive polar anomalies,especially the unusual Arctic warmth.In calculating the global mean,we give full weight to all regions based on area.Meteorological stations are sparse in the Arctic,but the estimated strong warm anomaly there in 2005is consistent withrecord low sea ice concentration and Arctic temperature anomalies inferred from infrared satellite data (9).Our analysis includes estimated temperature anomalies up to 1,200km from the nearest measurement station (7).Resulting spatial extrapolations and interpolations of temperature anomalies usually are meaningful for seasonal and longer time scales at middle and high latitudes,where the spatial scale of anomalies is set by Rossby waves (7).Thus,we believe that the unusual Arctic warmth of 2005is real.Other characteristics of our analysis method are summarized in Supporting Text ,which is published as supporting information on the PNAS web site.Independent analysis by the National Climate Data Center ( ͞oa ͞climate ͞research ͞2005͞ann ͞global.html),using a ‘‘teleconnection’’approach to fill in data sparse regions,also finds 2005to be the warmest year.The joint analysis of the University of East Anglia and the Hadley Centre ( ͞research ͞hadleycentre ͞obsdata ͞globaltemperature.html)also yields high global tem-perature for 2005,but a few hundredths of a degree cooler than in 1998.Record,or near record,warmth in 2005is notable,because global temperature did not receive a boost from an El Niño in 2005.The temperature in 1998,on the contrary,was lifted 0.2°C above the trend line by a ‘‘super El Niño’’(see below),the strongest El Niño of the past century.Global warming is now 0.6°C in the past three decades and 0.8°C in the past century.It is no longer correct to say ‘‘most global warming occurred before 1940.’’A better summary is:slow global warming,with large fluctuations,over the century up to 1975,followed by rapid warming at a rate Ϸ0.2°C per decade.Global warming was Ϸ0.7°C between the late 19th century (the earliest time at which global mean temperature can be accurately defined)and 2000,and continued warming in the first half decade of the 21st century is consistent with the recent rate of ϩ0.2°C per decade.The conclusion that global warming is a real climate change,not an artifact due to measurements in urban areas,is confirmed by surface temperature change inferred from borehole temperature profiles at remote locations,the rate of retreat of alpine glaciers around the world,and progressively earlier breakup of ice on rivers and lakes (10).The geographical distribution of warming (Fig.1B )provides further proof of real climate rgest warming is in remote regions including high latitudes.Warming occurs over ocean areas,far from direct human effects,with warming over ocean less than over land,an expected result for a forced climate change because of the ocean’s great thermal inertia.Early Climate Change Predictions.Manabe and Wetherald (11)madethe first global climate model (GCM)calculations of warming dueAuthor contributions:D.W.L.and M.M.-E.contributed data;J.H.,M.S.,R.R.,K.L.,D.W.L.,and M.M.-E.analyzed data;and J.H.wrote the paper.The authors declare no conflict of interest.Freely available online through the PNAS open access option.Abbreviations:SST,sea surface temperature;GHG,greenhouse gas;EEP,Eastern Equatorial Pacific;WEP,Western Equatorial Pacific;DAI,dangerous antrhopogenic interference;BAU,business as usual;AS,alternative scenario;BC,black carbon.‡Towhom correspondence should be addressed:E-mail:jhansen@.©2006by The National Academy of Sciences of the USA14288–14293͉PNAS ͉September 26,2006͉vol.103͉no.39 ͞cgi ͞doi ͞10.1073͞pnas.0606291103to instant doubling of atmospheric CO 2.The first GCM calculations with transient greenhouse gas (GHG)amounts,allowing compar-ison with observations,were those of Hansen et al.(12).It has been asserted that these calculations,presented in congressional testi-mony in 1988(13),turned out to be ‘‘wrong by 300%’’(14).That assertion,posited in a popular novel,warrants assessment because the author’s views on global warming have been welcomed in testimony to the United States Senate (15)and in a meeting with the President of the United States (16),at a time when the Earth may be nearing a point of dangerous human-made interference with climate (17).The congressional testimony in 1988(13)included a graph (Fig.2)of simulated global temperature for three scenarios (A,B,and C)and maps of simulated temperature change for scenario B.The three scenarios were used to bracket likely possibilities.Scenario A was described as ‘‘on the high side of reality,’’because it assumed rapid exponential growth of GHGs and it included no large volcanic eruptions during the next half century.Scenario C was described as ‘‘a more drastic curtailment of emissions than has generally been imagined,’’specifically GHGs were assumed to stop increasing after 2000.Intermediate scenario B was described as ‘‘the most plausi-ble.’’Scenario B has continued moderate increase in the rate of GHG emissions and includes three large volcanic eruptions sprin-kled through the 50-year period after 1988,one of them in the 1990s.Real-world GHG climate forcing (17)so far has followed a course closest to scenario B.The real world even had one large volcanic eruption in the 1990s,Mount Pinatubo in 1991,whereas scenario B placed a volcano in 1995.Fig.2compares simulations and observations.The red curve,as in ref.12,is the updated Goddard Institute for Space Studies observational analysis based on meteorological stations.The black curve is the land–ocean global temperature index from Fig.1,which uses SST changes for ocean areas (5,6).The land–ocean temper-ature has more complete coverage of ocean areas and yields slightly smaller long-term temperature change,because warming on aver-age is less over ocean than over land (Fig.1B ).Temperature change from climate models,including that re-ported in 1988(12),usually refers to temperature of surface air over both land and ocean.Surface air temperature change in a warming climate is slightly larger than the SST change (4),especially in regions of sea ice.Therefore,the best temperature observation for comparison with climate models probably falls between the mete-orological station surface air analysis and the land–ocean temper-ature index.Observed warming (Fig.2)is comparable to that simulated for scenarios B and C,and smaller than that for scenario A.Following refs.18and 14,let us assess ‘‘predictions’’by comparing simulated and observed temperature change from 1988to the most recent year.Modeled 1988–2005temperature changes are 0.59,0.33,and 0.40°C,respectively,for scenarios A,B,and C.Observed temper-ature change is 0.32°C and 0.36°C for the land–ocean index and meteorological station analyses,respectively.Warming rates in the model are 0.35,0.19,and 0.24°C per decade for scenarios A,B.and C,and 0.19and 0.21°C per decade for the observational analyses.Forcings in scenarios B and C are nearly the same up to 2000,so the different responses provide one measure of unforced variability in the model.Because of this chaotic variability,a 17-year period is too brief for precise assessment of model predictions,but distinction among scenarios and comparison with the real world will become clearer within a decade.Close agreement of observed temperature change with simula-tions for the most realistic climate forcing (scenario B)is accidental,given the large unforced variability in both model and real world.Indeed,moderate overestimate of global warming is likely because the sensitivity of the model used (12),4.2°C for doubled CO 2,is larger than our current estimate for actual climate sensitivity,which is 3Ϯ1°C for doubled CO 2,based mainly on paleoclimate data (17).More complete analyses should include other climate forcingsandFig.1.Surface temperature anomalies relative to 1951–1980from surface air measurements at meteorological stations and ship and satellite SST measurements.(A )Global annual mean anomalies.(B )Temperature anomaly for the first half decade of the 21stcentury.Annual Mean Global Temperature Change: ΔT s (°C)Fig.2.Global surface temperature computed for scenarios A,B,and C (12),compared with two analyses of observational data.The 0.5°C and 1°C tempera-ture levels,relative to 1951–1980,were estimated (12)to be maximum global temperatures in the Holocene and the prior interglacial period,respectively.Hansen et al.PNAS ͉September 26,2006͉vol.103͉no.39͉14289E N V I R O N M E N T A L S C I E N C EScover longer periods.Nevertheless,it is apparent that the first transient climate simulations (12)proved to be quite accurate,certainly not ‘‘wrong by 300%’’(14).The assertion of 300%error may have been based on an earlier arbitrary comparison of 1988–1997observed temperature change with only scenario A (18).Observed warming was slight in that 9-year period,which is too brief for meaningful comparison.Super El Niños.The 1983and 1998El Niños were successivelylabeled ‘‘El Niño of the century,’’because the warming in the Eastern Equatorial Pacific (EEP)was unprecedented in 100years (Fig.3).We suggest that warming of the Western Equatorial Pacific (WEP),and the absence of comparable warming in the EEP,has increased the likelihood of such ‘‘super El Niños.’’In the ‘‘normal’’(La Niña)phase of El Niño Southern Oscillation the east-to-west trade winds push warm equatorial surface water to the west such that the warmest SSTs are located in the WEP near Indonesia.In this normal state,the thermocline is shallow in the EEP,where upwelling of cold deep water occurs,and deep in the WEP (figure 2of ref.20).Associated with this tropical SST gradient is a longitudinal circulation pattern in the atmosphere,the Walker cell,with rising air and heavy rainfall in the WEP and sinking air and drier conditions in the EEP.The Walker circulation enhances upwelling of cold water in the East Pacific,causing a powerful positive feedback,the Bjerknes (21)feedback,which tends to maintain the La Niña phase,as the SST gradient and resulting higher pressure in the EEP support east-to-west trade winds.This normal state is occasionally upset when,by chance,the east-to-west trade winds slacken,allowing warm water piled up in the west to slosh back toward South America.If the fluctuation is large enough,the Walker circulation breaks down and the Bjerknes feedback loses power.As the east-to-west winds weaken,the Bjerknes feedback works in reverse,and warm waters move more strongly toward South America,reducing the thermocline tilt and cutting off upwelling of cold water along the South American coast.In this way,a classical El Niño is born.Theory does not provide a clear answer about the effect of global warming on El Niños (19,20).Most climate models yield either a tendency toward a more El Niño-like state or no clear change (22).It has been hypothesized that,during the early Pliocene,when the Earth was 3°C warmer than today,a permanent El Niño condition existed (23).We suggest,on empirical grounds,that a near-term global warming effect is an increased likelihood of strong El Niños.Fig.1B shows an absence of warming in recent years relative to 1951–1980in the equatorial upwelling region off the coast of South America.This is also true relative to the earliest period of SST data,1870–1900(Fig.3A ).Fig.7,which is published as supporting information on the PNAS web site,finds a similar result for lineartrends of SSTs.The trend of temperature minima in the East Pacific,more relevant for our purpose,also shows no equatorial warming in the East Pacific.The absence of warming in the EEP suggests that upwelling water there is not yet affected much by global warming.Warming in the WEP,on the other hand,is 0.5–1°C (Fig.3).We suggest that increased temperature difference between the near-equatorial WEP and EEP allows the possibility of increased temperature swing from a La Niña phase to El Niño,and that this is a consequence of global warming affecting the WEP surface sooner than it affects the deeper ocean.Fig.3B compares SST anomalies (12-month running means)in the WEP and EEP at sites (marked by circles in Fig.3A )of paleoclimate data discussed below.Absolute temperatures at these sites are provided in Fig.8,which is published as supporting information on the PNAS web site.Even though these sites do not have the largest warming in the WEP or largest cooling in the EEP,Fig.3B reveals warming of the WEP relative to the EEP [135-year changes,based on linear trends,are ϩ0.27°C (WEP)and Ϫ0.01°C (EEP)].The 1983and 1998El Niños in Fig.3B are notably stronger than earlier El Niños.This may be partly an artifact of sparse early data or the location of data sites,e.g.,the late 1870s El Niño is relatively stronger if averages are taken over Niño 3or a 5°ϫ10°box.Nevertheless,‘‘super El Niños’’clearly were more abundant in the last quarter of the 20th century than earlier in the century.Global warming is expected to slow the mean tropical circulation (24–26),including the Walker cell.Sea level pressure data suggest a slowdown of the longitudinal wind by Ϸ3.5%in the past century (26).A relaxed longitudinal wind should reduce the WEP–EEP temperature difference on the broad latitudinal scale (Ϸ10°N to 15°S)of the atmospheric Walker cell.Observed SST anomalies are consistent with this expectation,because the cooling in the EEP relative to WEP decreases at latitudes away from the narrower region strongly affected by upwelling off the coast of Peru (Fig.3A ).Averaged over 10°N to 15°S,observed warming is as great in the EEP as in the WEP (see also Fig.7).We make no suggestion about changes of El Niño frequency,and we note that an abnormally warm WEP does not assure a strong El Niño.The origin and nature of El Niños is affected by chaotic ocean and atmosphere variations,the season of the driving anomaly,the state of the thermocline,and other factors,assuring that there will always be great variability of strength among El Niños.Will increased contrast between near-equatorial WEP and EEP SSTs be maintained or even increase with more global warming?The WEP should respond relatively rapidly to increasing GHGs.In the EEP,to the extent that upwelling water has not been exposed to the surface in recent decades,little warming is expected,andtheBSST Change (°C) from 1870-1900 to 2001-2005Western and Eastern Pacific Temperature Anomalies (°C)parison of SST in West and East Equatorial Pacific Ocean.(A )SST in 2001–2005relative to 1870–1900,from concatenation of two data sets (5,6),as described in the text.(B )SSTs (12-month running means)in WEP and EEP relative to 1870–1900means.14290͉ ͞cgi ͞doi ͞10.1073͞pnas.0606291103Hansen etal.contrast between WEP and EEP may remain large or increase in coming decades.Thus,we suggest that the global warming effect on El Niños is analogous to an inferred global warming effect on tropical storms (27).The effect on frequency of either phenomenon is unclear,depending on many factors,but the intensity of the most powerful events is likely to increase as GHGs increase.In this case,slowing the growth rate of GHGs should diminish the probability of both super El Niños and the most intense tropical storms.Estimating Dangerous Climate ChangeModern vs.Paleo Temperatures.Modern SST measurements (5,6)are compared with proxy paleoclimate temperature (28)in the WEP (Ocean Drilling Program Hole 806B,0°19ЈN,159°22ЈE;site circled in Fig.3A )in Fig.4A .Modern data are from ships and buoys for 1870–1981(6)and later from satellites (5).In concatenation of satellite and ship data,as shown in Fig.8A ,the satellite data are adjusted down slightly so that the 1982–1992mean matches the mean ship data for that period.The paleoclimate SST,based on Mg content of foraminifera shells,provides accuracy to Ϸ1°C (29).Thus we cannot be sure that we have precisely aligned the paleo and modern temperature scales.Accepting paleo and modern temperatures at face value implies a WEP 1870SST in the middle of its Holocene range.Shifting the scale to align the 1870SST with the lowest Holocene value raises the paleo curve by Ϸ0.5°C.Even in that case,the 2001–2005WEPSST is at least as great as any Holocene proxy temperature at that location.Coarse temporal resolution of the Holocene data,Ϸ1,000years,may mask brief warmer excursions,but cores with higher resolution (29)suggest that peak Holocene WEP SSTs were not more than Ϸ1°C warmer than in the late Holocene,before modern warming.It seems safe to assume that the SST will not decline this century,given continued increases of GHGs,so in a practical sense the WEP temperature is at or near its highest level in the Holocene.Fig.5,including WEP data for the past 1.35million years,shows that the current WEP SST is within Ϸ1°C of the warmest intergla-cials in that period.The Tropical Pacific is a primary driver of the global atmosphere and ocean.The tropical Pacific atmosphere–ocean system is the main source of heat transported by both the Pacific and Atlantic Oceans (2).Heat and water vapor fluxes to the atmosphere in the Pacific also have a profound effect on the global atmosphere,as demonstrated by El Niño Southern Oscillation climate variations.As a result,warming of the Pacific has worldwide repercussions.Even distant local effects,such as thinning of ice shelves,are affected on decade-to-century time scales by subtropical Pacific waters that are subducted and mixed with Antarctic Intermediate Water and thus with the Antarctic Circumpolar Current.The WEP exhibits little seasonal or interannual variability of SST,typically Ͻ1°C,so its temperature changes are likely to reflect large scale processes,such as GHG warming,as opposed to small scale processes,such as local upwelling.Thus,record Holocene WEP temperature suggests that global temperature may also be at its highest level.Correlation of local and global temperature change for 1880–2005(Fig.9,which is published as supporting information on the PNAS web site)confirms strong positive correlation of global and WEP temperatures,and an even stronger correlation of global and Indian Ocean temperatures.The Indian Ocean,due to rapid warming in the past 3–4decades,is now warmer than at any time in the Holocene,independent of any plausible shift of the modern temperature scale relative to the paleoclimate data (Fig.4C ).In contrast,the EEP (Fig.4B )and perhaps Central Antarctica (Vostok,Fig.4D )warmed less in the past century and are probably cooler than their Holocene peak values.However,as shown in Figs.1B and 3A ,those are exceptional regions.Most of the world and the global mean have warmed as much as the WEP and Indian Oceans.We infer that global temperature today is probably at or near its highest level in the Holocene.Fig.5shows that recent warming of the WEP has brought its temperature within Ͻ1°C of its maximum in the past million years.There is strong evidence that the WEP SST during the penultimate interglacial period,marine isotope stage (MIS)5e,exceeded the WEP SST in the Holocene by 1–2°C (30,31).This evidence is consistent with data in Figs.4and 5and with our conclusion that the Earth is now within Ϸ1°C of its maximum temperature in the past million years,because recent warming has lifted the current temperature out of the prior Holocenerange.parison of modern surface temperature measurements with paleoclimate proxy data in the WEP (28)(A ),EEP (3,30,31)(B ),Indian Ocean (40)(C ),and Vostok Antarctica (41)(D).Fig.5.Modern sea surface temperatures (5,6)in the WEP compared with paleoclimate proxy data (28).Modern data are the 5-year running mean,while the paleoclimate data has a resolution of the order of 1,000years.Hansen et al.PNAS ͉September 26,2006͉vol.103͉no.39͉14291E N V I R O N M E N T A L S C I E N C ESCriteria for Dangerous Warming.The United Nations FrameworkConvention on Climate Change (www.unfccc.int)has the objective ‘‘to achieve stabilization of GHG concentrations’’at a level pre-venting ‘‘dangerous anthropogenic interference’’(DAI)with cli-mate,but climate change constituting DAI is undefined.We suggest that global temperature is a useful metric to assess proximity to DAI,because,with knowledge of the Earth’s history,global tem-perature can be related to principal dangers that the Earth faces.We propose that two foci in defining DAI should be sea level and extinction of species,because of their potential tragic consequences and practical irreversibility on human time scales.In considering these topics,we find it useful to contrast two distinct scenarios abbreviated as ‘‘business-as-usual’’(BAU)and the ‘‘alternative scenario’’(AS).BAU has growth of climate forcings as in intermediate or strong Intergovernmental Panel on Climate Change scenarios,such as A1B or A2(10).CO 2emissions in BAU scenarios continue to grow at Ϸ2%per year in the first half of this century,and non-CO 2positive forcings such as CH 4,N 2O,O 3,and black carbon (BC)aerosols also continue to grow (10).BAU,with nominal climate sensitivity (3Ϯ1°C for doubled CO 2),yields global warming (above year 2000level)of at least 2–3°C by 2100(10,17).AS has declining CO 2emissions and an absolute decrease of non-CO 2climate forcings,chosen such that,with nominal climate sensitivity,global warming (above year 2000)remains Ͻ1°C.For example,one specific combination of forcings has CO 2peaking at 475ppm in 2100and a decrease of CH 4,O 3,and BC sufficient to balance positive forcing from increase of N 2O and decrease of sulfate aerosols.If CH 4,O 3,and BC do not decrease,the CO 2cap in AS must be lower.Sea level implications of BAU and AS scenarios can be consid-ered in two parts:equilibrium (long-term)sea level change and ice sheet response time.Global warming Ͻ1°C in AS keeps tempera-tures near the peak of the warmest interglacial periods of the past million years.Sea level may have been a few meters higher than today in some of those periods (10).In contrast,sea level was 25–35m higher the last time that the Earth was 2–3°C warmer than today,i.e.,during the Middle Pliocene about three million years ago (32).Ice sheet response time can be investigated from paleoclimate evidence,but inferences are limited by imprecise dating of climate and sea level changes and by the slow pace of weak paleoclimate forcings compared with stronger rapidly increasing human-made forcings.Sea level rise lagged tropical temperature by a few thousand years in some cases (28),but in others,such as Meltwater Pulse 1A Ϸ14,000years ago (33),sea level rise and tropical temperature increase were nearly synchronous.Intergovernmental Panel on Climate Change (10)assumes negligible contribution to 2100sea level change from loss of Greenland and Antarctic ice,but that conclusion is implausible (17,34).BAU warming of 2–3°C would bathe most of Greenland and West Antarctic in melt-water during lengthened melt seasons.Multiple positive feedbacks,in-cluding reduced surface albedo,loss of buttressing ice shelves,dynamical response of ice streams to increased melt-water,and lowered ice surface altitude would assure a large fraction of the equilibrium ice sheet response within a few centuries,at most (34).Sea level rise could be substantial even in the AS,Ϸ1m per century,and cause problems for humanity due to high population in coastal areas (10).However,AS problems would be dwarfed by the disastrous BAU,which could yield sea level rise of several meters per century with eventual rise of tens of meters,enough to transform global coastlines.Extinction of animal and plant species presents a picture anal-ogous to that for sea level.Extinctions are already occurring as a result of various stresses,mostly human-made,including climate change (35).Plant and animal distributions are a reflection of the regional climates to which they are adapted.Thus,plants and animals attempt to migrate in response to climate change,but theirpaths may be blocked by human-constructed obstacles or natural barriers such as coastlines.A study of 1,700biological species (36)found poleward migration of 6km per decade and vertical migration in alpine regions of 6m per decade in the second half of the 20th century,within a factor of two of the average poleward migration rate of surface isotherms (Fig.6A )during 1950–1995.More rapid warming in 1975–2005yields an average isotherm migration rate of 40km per decade in the Northern Hemisphere (Fig.6B ),exceeding known paleoclimate rates of change.Some species are less mobile than others,and ecosystems involve interactions among species,so such rates of climate change,along with habitat loss and fragmentation,new invasive species,and other stresses are expected to have severe impact on species survival (37).The total distance of isotherm migration,as well as migration rate,affects species survival.Extinction is likely if the migration distance exceeds the size of the natural habitat or remaining habitat fragment.Fig.6shows that the 21st century migration distance for a BAU scenario (Ϸ600km)greatly exceeds the average migration distance for the AS (Ϸ100km).It has been estimated (38)that a BAU global warming of 3°C over the 21st century could eliminate a majority (Ϸ60%)of species on the planet.That projection is not inconsistent with mid-century BAU effects in another study (37)or scenario sensitivity of stress effects (35).Moreover,in the Earth’s history several mass extinc-tions of 50–90%of species have accompanied global temperature changes of Ϸ5°C (39).We infer that even AS climate change,which would slow warming to Ͻ0.1°C per decade over the century,would contribute to species loss that is already occurring due to a variety of stresses.However,species loss under BAU has the potential to be truly disastrous,conceivably with a majority of today’s plants and animals headed toward extermination.DiscussionThe pattern of global warming (Fig.1B )has assumed expected characteristics,with high latitude amplification and larger warming over land than over ocean,as GHGs have become the dominant climate forcing in recent decades.This pattern results mainly from the ice–snow albedo feedback and the response times of ocean andland.Fig.6.Poleward migration rate of isotherms in surface observations (A and B )and in climate model simulations (17)for 2000–2100for Intergovernmental Panel on Climate Change scenario A2(10)and an alternative scenario of forcings that keeps global warming after 2000less than 1°C (17)(C and D ).Numbers in upper right are global means excluding the tropical band.14292͉ ͞cgi ͞doi ͞10.1073͞pnas.0606291103Hansen etal.。
全球变暖(英语) global warming

content
Definition
Cause
Effect
We can do
Definition
what is gቤተ መጻሕፍቲ ባይዱobal warming?
Global warming is the observed and projected increases in the average temperature of Earth's atmosphere
Global Warming Effects: A Top 5 List
Methane emissions from animals , agriculture such as rice paddies, and from Arctic seabeds
Methane is another extremely potent greenhouse gas, ranking right behind CO2.When organic matter is broken down by bacteria under oxygen-starved conditions as in rice paddies, methane is produced .
Increase in usage of chemical fertilizers on croplands
In the last half of the 20th century, the use of chemical fertilzers has risen dramatically. The high rate of application of nitrogen-rich fertilizers has effects on the heat storage of cropland and the run-off of excess fertilizers creates 'dead-zones' in our oceans.
全球变暖英文THEGLOBALWARMING

So, how to save our home, how to protect us from the bad disaster?
China had promised at Copenhagen that would cut down greenhouse gas emissions ,as Chinese, we do have so much could do. let alone as a human.
First as well as the most important is plant trees as much as we can. Trees can hold water build topsoil. especial mangrove forests, as one kind of swamp trees, it can be called miracle whereon prevent and control flood, on the other hand, protecting extant plants is also important, such as Amazon Rainforest, as the lung of earth, it’s too important too cherish.
全球变暖(英语) global warming
Deforestation, especially tropical forests for wood pulp ,and farmland
Increase in usage of chemical fertilizers on croplands
Carbon dioxide emissions from fossil fuel burning power plants
Deforestation , especially tropical forests for wood, pulp, and farmland
The use of forests for fuel is one cause of deforestation. Forests remove and store carbon dioxide from the atmosphere, and this deforestation releases large amounts of carbon, as well as reducing the amount of carbon capture on the planet.
Use recycled paper
Make the most of scrap paper for shopping lists, notes ,scrapbooks , t elephone ,messages, taking notes in class, etc. Recycle your paper only when it has been thoroughly usems
The maximum wind speeds of the strongest tropical cyclones have increased significantly since 1981, according to research published in Nature this week. And the upward trend, thought to be driven by rising ocean temperatures, is unlikely to stop at any time soon.
全球变暖(英语)--global-warming
in sea levels worldwide
Scientists predict an increase in sea levels worldwide due to the melting of two massive ice sheets in Antarctica and Greenland, especially on the East coast of the US. However, many nations around the world will experience the effects of rising sea , which could displace millions of people.
Increase in usage of chemical fertilizers on croplands
Carbon dioxide emissions from fossil fuel burning power plants
Every day, more electric gadgets flood the market, and without widespread alternative energy sources, we are highly dependent on burning coal for our personal and commercial electrical supply.
Deforestation , especially tropical forests for wood, pulp, and farmland
The use of forests for fuel is one cause of deforestation. Forests remove and store carbon dioxide from the atmosphere, and this deforestation releases large amounts of carbon, as well as reducing the amount of carbon capture on the planet.
全球变暖(英语) global warming
Disappearance of coral reefs
A report on coral reefs from WWF says that in a worst case scenario, coral populations will collapse by 2100 due to increased temperatures and ocean acidification . The 'bleaching' of corals from small but prolonged rises in sea temperature is a severe danger for ocean ecosystems, and many other species in the oceans rely on coral reefs for their survival.
Methane emissions from animals , agriculture such as rice paddies, and from Arctic seabeds
Methane is another extremely potent greenhouse gas, ranking right behind CO2.When organic matter is broken down by bacteria under oxygen-starved conditions as in rice paddies, methane is produced .
Global Warming Effects: A Top 5 List
Rise in sea levels worldwide More killer storms Massive crop failures Widespread extinction of species Disappearance of coral reefs
《全球变暖英文》课件
要点二
Metal emissions
Investing in technologies and practices to reduce metal emissions from agriculture, landfills, and natural gas production
要点三
Nitrous oxide emissions
Glacier melting
Glaciers are retreating at an increasing rate, losing mass and shrinking in size This is due to warming temperatures, which is due to ice to melt and glaciers to receive
exacerbation of the greenhouse effect and ultimately causing global warming.
The impact of global warming
Global warming has a wide-ranging impact on natural ecosystems and human society.
Ecosystems are also experiencing shifts in specifications composition, range, and background This can lead to a loss of biodiversity and disrupt ecological balance The loss of specifications and ecosystems has negative implications for human well being and sustainable development
气候变化英文PPT课件
2019/11/10
优质
5
Other evidence of Climate Change
01
Glacier retreat
2019/11/10
优质
6
1875
2019/11/10
优质
2004
7
Glaciers and frozen ground are 02 receding
2019/11/10
places have cooled.
Other changes have occurred, e.g.:
Sea level has risen by about 20 cm,
Ocean heat content has increased,
2019/11/10 Almost all mountain glac优质iers have retreated
优质
8
Increased Glacier retreat since the early 1990s
Area of seasonaFra bibliotekly frozen ground in NH has decreased by 7% from 1901 to 2002
2019/11/10
优质
9
Snow cover and Arctic sea ice 03 are decreasing
2019/11/10
优质
12
Summary
Global surface temperatures have risen by
about 0.6°C since 1900
It is likely that this warming is larger than for