jobview说明
NuTool - LCDView 用户指南说明书

NuTool – LCDView Revision HistoryNuTool – LCDView Revision HistoryThe information described in this document is the exclusive intellectual property ofNuvoton Technology Corporation and shall not be reproduced without permission from Nuvoton.Nuvoton is providing this document only for reference purposes of NuMicro ® micro controller based systemdesign. Nuvoton assumes no responsibility for errors or omissions.All data and specifications are subject to change without notice.For additional information or questions, please contact: Nuvoton Technology Corporation .NuTool – LCDView Revision History TABLE OF CONTENTS1REVISION HISTORY (3)2SUPPORTED MIRCO CONTROLLER (4)3RESOURCES (5)NuTool – LCDView Revision History1 REVISION HISTORYVersion Release Date Description1.052022/6/1• Supported the conversion table feature. • Supported the copy and paste feature. 1.042022/5/20•Added supported micro controller:– NuMicro 8051 Family: ML56 Series. –NuMicro M23 Family: M2354 Series.•Enhanced stability.1.03 2022/3/7 • Improved performance and GUI. 1.022022/1/26• Supported the info area feature. • Supported the warning dialog feature. 1.012021/12/10•Supported the save and load project feature. • Supported the generate header file feature. •Added supported micro controller:–NuMicro M23 Family: M258 Series.1.00 2021/10/14• Release primary version.NuTool – LCDView Revision History 2SUPPORTED MIRCO CONTROLLERProduct Line Series Part NumberNuMicro®8051 FamilyML56ML54LD1AE, ML54MD1AE, ML54SD1AE, ML56LD1AE, ML56MD1AE,ML56SD1AE, ML51SD1AE, ML51LD1AE, ML51TD1AENuMicro®M23 FamilyM258M254SD3AE, M254SE3AE, M254QD3AE, M254QE3AE, M254KD3AE,M254KE3AE, M256SD3AE, M256SE3AE, M256QD3AE, M256QE3AE,M256KD3AE, M256KE3AE, M258SD3AE, M258SE3AE, M258QD3AE,M258QE3AE, M258KD3AE, M258KE3AEM2354M2354KJFAE, M2354LJFAE, M2354SJFAENuTool – LCDView Revision History3 RESOURCESWebsiteDetailsNuTool on https:///tool-and-software/software-development-tool/nutool/• Download the latest NuTool installation file. •View the NuTool revision history.NuTool on GitHubhttps:///OpenNuvoton/Nuvoton_Tools•Check the open source example code of NuTool for easier development.Important NoticeUsing this software indicates your acceptance of the disclaimer hereunder:THIS SOFTWARE IS FOR YOUR REFERENCE ONLY AND PROVIDED "AS IS" AND ANY EXPRESS OR IMPLIED WARRANTIES, INCLUDING, BUT NOT LIMITED TO, THE IMPLIED WARRANTIES OF MERCHANTABILITY AND FITNESS FOR A PARTICULAR PURPOSE ARE DISCLAIMED. YOUR USING THIS SOFTWARE/FIRMWARE IS BASED ON YOUR OWN DISCRETION, IN NO EVENT SHALL THE COPYRIGHT OWNER OR PROVIDER BE LIABLE TO ANY DIRECT, INDIRECT, INCIDENTAL, SPECIAL, EXEMPLARY, OR CONSEQUENTIAL DAMAGES (INCLUDING, BUT NOT LIMITED TO, PROCUREMENT OF SUBSTITUTE GOODS OR SERVICES; LOSS OF USE, DATA, OR PROFITS; OR BUSINESS INTERRUPTION) HOWEVER CAUSED AND ON ANY THEORY OF LIABILITY, WHETHER IN CONTRACT, STRICT LIABILITY, OR TORT (INCLUDING NEGLIGENCE OR OTHERWISE) ARISING IN ANY WAY OUT OF THE USEOF THIS SOFTWARE, EVEN IF ADVISED OF THE POSSIBILITY OF SUCH DAMAGE.。
QlikView中文教程v8_part1_WORKING+WITH+QLIKVIEW
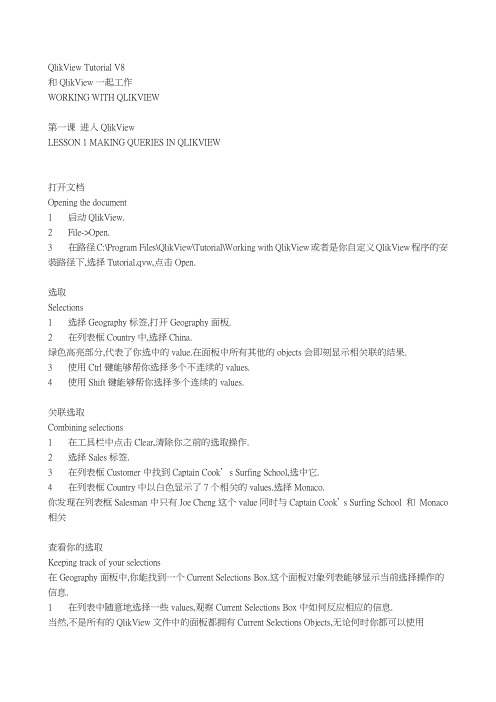
QlikView Tutorial V8和QlikView一起工作WORKING WITH QLIKVIEW第一课进入QlikViewLESSON 1 MAKING QUERIES IN QLIKVIEW打开文档Opening the document1 启动QlikView.2 File->Open.3 在路径C:\Program Files\QlikView\Tutorial\Working with QlikView或者是你自定义QlikView程序的安装路径下,选择Tutorial.qvw,点击Open.选取Selections1 选择Geography标签,打开Geography面板.2 在列表框Country中,选择China.绿色高亮部分,代表了你选中的value.在面板中所有其他的objects会即刻显示相关联的结果.3 使用Ctrl键能够帮你选择多个不连续的values.4 使用Shift键能够帮你选择多个连续的values.关联选取Combining selections1 在工具栏中点击Clear,清除你之前的选取操作.2 选择Sales标签.3 在列表框Customer中找到Captain Cook’s Surfing School,选中它.4 在列表框Country中以白色显示了7个相关的values.选择Monaco.你发现在列表框Salesman中只有Joe Cheng这个value同时与Captain Cook’s Surfing School 和Monaco 相关查看你的选取Keeping track of your selections在Geography面板中,你能找到一个Current Selections Box.这个面板对象列表能够显示当前选择操作的信息.1 在列表中随意地选择一些values,观察Current Selections Box中如何反应相应的信息.当然,不是所有的QlikView文件中的面板都拥有Current Selections Objects,无论何时你都可以使用Current Selections Window来查看自己选择操作的信息.2 在工具栏中点击Current Selections.出现一个新的窗口,显示了与Current Selections Box同样的信息.移动选取Moving selections1 在工具栏中点击Clear,清除你之前的选取操作.2 依旧在Geography面板.在列表框Country中,选择China.3 使用↓键选择China后面的一个value,使用↑键选择China前面的一个value.文本和数字查询Text searches and numeric searchesText searches1 在工具栏中点击Clear,清除你之前的选取操作.2 选中列表框Country的标题,标题变成深绿色.3 输入"ch".现在列表显示处关键字"ch"经模糊查询后的结果.细心的你,一定观察到"ch"被包含进前后2个"*"就像这样-->"*ch*",QlikView中"*"用来表示多个字符,"?"用来表示单个字符.经试验QlikView貌似未提供转义字符的支持???通常,你也可以使用工具栏中的Search,Edit菜单中的Search选项,或F3来打开查询窗口.4 敲击Enter键将选择所有查询出的结果.Numeric searches1 在工具栏中点击Clear,清除你之前的选取操作.2 选中列表框Area(km.sq)的标题.3 输入"<100".4 只有小于100的numbers被显示出来,按Enter键选中他们.Examples:a* will find all values that begin with the letter a.*b* will find all values that contain the letter b.<10 will find all numeric values smaller than 10.>10 will find all numeric values larger than 10.>10<100 will find all numeric values between 10 and 100.10* will find all values (numeric or text) beginning with 10.选取上一步或前一步Stepping back or forward in the list of selections1 点击工具栏中的Back按钮,会显示上一步的操作记录.2 再次点击Back按钮,显示上上一步的操作记录.3 点击工具栏中的Forward按钮,会显示前一步的操作记录.锁定选取与解锁选取Locking and unlocking selections1 选取另一个值后之前的选取将会消失.为了避免这种情况,可以将之前的选取锁定,被锁定的单元将呈现蓝色.一个与已锁定选取发生冲突的选取将不会被执行.2 选择工具栏中的Lock,Edit菜单中的Lock选项.这将锁定所有的选取,以防止他们被不小心清除.3 尝试选取其他列表中的value,不相关联的value的选取是不会被执行的.4 选择工具栏中的Unlock,Edit菜单中的Unlock选项.这将解除所有选取的锁定.选取书签Selection bookmarks它能够保存一个选取设置,供今后使用.1 选取一个或数个values,此时选择工具栏中的Add Bookmark.创建bookmarks时使用当前日期作为default name(显示在Create Bookmart对话框中).第一个被创建的书签将使用number 1,第二个使用number 2,等等.当然,你也可以自定义Bookmark Name.2 输入Bookmark Name,点击OK.3 在Bookmarks菜单中,选取刚刚创建的书签.将看到之前保存在这个书签中的选取设置.最多能够保存10个书签.保存你的作业Saving your work1 选择File菜单中的Save As保存一个备份文档.2 在File name中填入MyTutorial.qvw或是相似的文件名,点击Save.3 选择File菜单中的Close,关闭当前文件.3 选择File菜单中的Exit,退出程序.检查你的作业Checking your workWorking with QlikView文件夹下除了Tutorial.qvw之外还有一个TutorialFinal.qvw,这个是已完成的示例,你可以将它打开做个比较.第二课处理面板和面板对象LESSON 2 HANDLING SHEETS AND SHEET OBJECTS打开文档Opening the document1 启动QlikView.2 打开MyTutorial.qvw.如果你最近使用过,你能够在Recently Opened Documents标签里找到它.介绍Presentation掌握所有不同的对象,在QlikView中面板是由众多最基本的要素所构成.一个文件通常包含数个面板,以用来完成想要实现的复杂设计布局.一个面板对象能够装载另一个面板.面板之间能够逻辑上关联,换言之,在一个面板上的对象的选取将影响其他所有面板上的对象.面板间的逻辑关联Logical connections between sheets在你的文件中有2个面板:Geography和Sales.Geography是当前活动的面板.1 点击标签Sales.2 在列表框Country中,选择China.China便变成绿色,其他列表中相关的values则以白色显示.3 点击标签Geography,切换到Geography.Geography中的各列表亦做出相关性的选取,显示相关联的values.4 回到Sales.5 在列表框Salesman中,选择Cezar Sandu.你立刻看到Cezar Sandu在法国,德国和蒙古国活动.中国没有在相关联的条目中出现.6 切换到Geography.Geography再度做出关联反应.特别的,当一个大文件中包含许多的选取,一些选取将不可避免地影响面板中的显示结果.添加面板Adding a sheet1 在工具栏中点击Clear,清除你之前的选取操作.2 选择工具栏中的Add Sheet按钮.一个新的面板出现了.3 右键点击新的面板,在出现的菜单中选择Properties,打开Properties对话框.4 在General页,改变Title,把Sheet2改成Customer.5 点击Fields标签.6 这个对话页包含一个可用filds的列表.选择Customer,然后点击Add>按钮.field被移入到显示栏位中,意思是,将会在你的面板中产生一个列表.7 你也可以通过双击fields,将左边的column移动到右边(Fields Displayed in Listboxes).双击Customer ID.8 点击OK,关闭对话框.现在,你创建了一个新的面板,其中包含2个列表.创建一个新的面板用于更改,也可以在一个已经存在的面板上使用右键,然后在出现的菜单中选择Copy Sheet.改变面板的布局设置Changing layout properties for a sheet让新面板的标签使用之前相同的色度.1 在新面板里的空白处点击右键,选择Properties...打开Properties对话框.2 在General页,选择Tab Settings下的Custom Colors,点击Tab Color按钮.打开Color Area对话框.3 选择Base Color下的Fixed,点击有色按钮.4 在颜色对话框中,进行如下设置:色调[Hue]:59 红[Red]:109饱和度[Sat]:139 绿[Green]:168亮度[Lum]:100 蓝[Blue]:455 点击OK,直至关闭所有的对话框.现在你的新面板标签已更新为绿色.使标签上的文字变成白色:To make the tab text white:1 在新面板里的空白处点击右键,选择Properties...打开Properties对话框.2 在General页,选择Tab Settings下的Custom Colors,点击Tab Text Color按钮.打开Color Area对话框.3 选择Base Color下的Fixed,点击有色按钮.4 在颜色对话框中选择白色.5 点击OK,直至关闭所有的对话框.现在你的新面板标签的文字已更新为白色.移动面板Moving a sheet新的面板Customer,包含列表框Customer和Customer ID,该面板位于Sales的右侧.你希望将Customer放到中间的位置:右键单击Customer的标签,在浮动菜单中选择Promote Sheet.现在Customer的位置被放在Geography和Sales中间.善于观察的你,一定发现选项Demote Sheet正好用于执行相反的操作.添加新的面板对象Adding new sheet objects如果你在面板Customer的空白处单击右键,选择New Sheet Object,你将看到一个列表,它包含了所有能够在QlikView中所使用的面板对象.这些面板对象能够支持数据的选取操作,除了按钮,文本对象和线条/箭头对象.所有的面板对象均能被用于选取结果的显示.在早前的课程中我们创建了Customer面板,其中包含2个列表Customer和Customer ID.现在添加第3个面板对象:一个列表,包含了国家信息.1 在面板Customer中的空白处单击右键,选择New Sheet Object下的列表.打开New List Box对话框.2 在General页,从下拉列表Field中选取Country.Country将会自动的作为新列表框标题的名称.如果你喜欢,你也可以在这个页面自定义标题名称.3 点击OK.在你的面板Customer上出现了一个新的列表框Country.在接下来的课程中,会逐一介绍许多重要的面板对象,包括列表.但首先你需要学习如何在面板中呈现和布置面板对象.移动面板对象Moving a sheet object为了移动一个面板对象,你需要用鼠标左键点击面板对象的标签,保持按下状态,拖动它.1 在面板Customer上,移动新的列表框Country.使用CTRL+方向键能够让你一步步微调对象的位置.使用CTRL+SHIFT+方向键能够让你以较大的步伐调整对象的位置.取消布局改变Undo Layout Change取消布局改变是一个非常有用的函数,它能使你取消之前的布局,包括面板对象的移动,大小和删除面板和面板对象的设置.QlikView维护一个布局改变列表.每一个取消布局的改变命令将使你在这个列表里向后一步.你将在之后的操作中使用这个命令.你也可以使用Windows命令CTRL+Z来实现同样的功能.1 取消你之前的布局改变.列表的移动将会一步步倒退.同时选取和移动数个面板对象Selecting and moving several sheet objects simultaneously为了在同一时刻移动数个面板对象,在一开始先得选取它们.操作如下:1 在面板Customer上,使用鼠标左键框选你希望进行移动操作的所有面板对象.被选中的面板对象标题条会变成深色.这说明它们已被选中,处于活动状态.2 使用鼠标左键拖动其中一个已选中的面板对象.所有的面板对象会一起移动.如果这些对象的排列不是很美观,别担心-你可以格式化它们的布局.你也可以使用SHIFT+鼠标左键逐一选取若干个sheep对象.拷贝面板对象Copying sheet objects为了在同一个面板中复制一个面板对象,先选中它,按下Ctrl键,拖动要复制的面板对象,光标处会多显示一个'+',松开鼠标,最后释放Ctrl键.你可以在同一个面板或是不同的面板间任意的对面板对象进行拷贝.在案例中,你希望添加一个面板对象,其拷贝蓝本来自另一个面板中,你能够轻松的完成它.列表框Country,它来自面板Geography:1 将面板Geography设为当前活动状态.2 选中列表框Country,按下Ctrl键.3 拖动列表框Country,至面板Customer的标签处.4 当出现带'+'的圆弧箭头时,释放鼠标,释放Ctrl键.5 切换到面板Customer,复制过来的列表框Country出现在的位置与其蓝本在面板Geography中的位置相同.如果你更喜欢Windows的复制和粘贴命令,它们也能运行得很好.你能在Edit菜单里找到它们.标准的Wimdows快捷方式CTRL+C和CTRL+V也能够正常工作.调整面板对象的大小Sizing a sheet object你可以通过拖拉对象的边框来调它的大小.在面板上排列和分布面板对象Aligning and distributing sheet objects on the sheet在design 工具栏上有若干个命令来帮助调整面板对象的布局.1 选取面板下需要调整布局的列表.2 点击相应的命令按钮即可.Align Left 左对齐Center Vertically 垂直居中Align Right 右对齐ALign Bottom 底对齐Center Horizontally 水平居中Align Top 顶对齐Space Vertically 垂直间隔Space Horizontally 水平间隔Adjust Left 横向自适应Adjust Top 纵向自适应面板对象的最小化与还原Minimizing and restoring a sheet object列表和其他面板对象能够被最小化,操作如下:1 在列表上点击右键,在浮动菜单上选择Properties...2 在Caption页选择Allow Minimize,点击OK.最小化标签出现在列表的右上角.3 点击最小化标签或是双击列表的标题.列表变成一个图标,这个图标可以自有的移动.4 双击图标,恢复列表.你也可以在Caption页选择Allow Maximize来添加最大化的图标,Auto Minimize是自动最小化.自动最小化Auto Minimize自动最小化在特定条件下是实用的命令,用于在给定的时刻只有一个图表在面板中全尺寸显示的时候,其他的图表则自动最小化在面板上.面板Geography上的图表Area和Population均被设置了Auto Minimize.1 双击Population.图表Population展开,Area自动最小化为图标.2 双击Area.图表Area展开,Population自动最小化为图标.删除面板对象Removing a sheet object在面板Customer上有2个Country列表框.你只需要一个:1 右键点击其中一个Country列表框2 选择浮动菜单上的Remove.3 确定你真的要删除它,点击OK.列表在屏幕上消失了.使用DELETE键也能够达到相同的目的.改变面板对象的边框Changing the border of a sheet object1 在列表上点击右键,在浮动菜单上选择Properties...2 选择Layout页.3 在Use Borders下选择边框样式.Border Width处设置边框宽度.4 点击OK.如果你希望所有的面板对象设置成统一的边框,你需要在Setting菜单下的Document Properties中的Layout页进行相应设置.改变面板对象的字体Changing the font of a sheet object1 在列表上点击右键,在浮动菜单上选择Properties...2 选择Font页.3 在Font下选择字体.Font Style处设置字体样式.Size处设置字体大小.4 点击OK.如果你希望所有的面板对象设置成统一的边框,你需要在Setting菜单下的Document Properties中的Font 页进行相应设置.在面板对象间复制字体和边框样式Copying font and border formats between sheet objects1 选择一个面板对象,作为正确格式的来源.2 点击工具栏上的格式刷[Format Painter]按钮.3 点击需要更新的面板对象.该面板对象的样式被更新了.你能够在任何面板对象上使用格式刷[Format Painter].你也能够同时对多个面板对象进行操作.只要点击来源对象,然后双击格式刷[Format Painter],再逐一格式化目标对象.保存,关闭和退出Saving, closing and exiting第三课列表和统计表LESSON 3 LIST BOXES AND STATISTICS BOXES打开文档Opening the document1 启动QlikView.2 打开MyTutorial.qvw.列表框The list box列表是屏幕上出现最常见的对象,包含一列来自数据库的字段值.如果没有足够的空间显示出所有的值,在列表的右侧会出现一个滚动条.一个值在列表里只保留一个,即使这个值在数据库中的栏位里出现过多次.更新列表的选项Changing the properties of a list box每一个sheep对象都有一个properties对话框,包含若干个你能够改变这个对象设置的页面.显示频率Showing frequency你对'有多少国家使用货币卢比[Rupee]?'很感兴趣.1 在工具栏中点击Clear,清除你之前的选取操作.2 切换至面板Geography.3 在列表框Currency上点击右键,在浮动菜单上选择Properties...4 在General页,选择Show Frequency.5 点击OK.现在所有的货币后都跟随了一个数字.货币卢比[Rupee]后的数字是5,说明有5个国家使用它作为货币单位.改变和排列数字Changing the number and order of columns是列表显示若干列:1 清除你之前的选取操作.2 切换到面板Sales.右键点击列表框Day,,在浮动菜单上选择Properties...3 选择Presentation页.4 取消选择Single Column,点击OK.5 拖放Day的边框,直至它已7列显示日期.这些值是按列排序的,换言之,是垂直排列.你也许喜欢这些日期按照行来水平排列.6 右键点击列表框Day,,在浮动菜单上选择Properties...7 选择Presentation页.8 取消选择Order by Column,点击OK.现在这些日期按行水平的排列显示.改变排列类型Changing the sort order在每一个列表中数字存在不同的排列方式.数字通常按照它的值来排序,如果包含文本则按照字母表顺序排列.这些值的排列依照他们的逻辑类型[数据类型]1 在Sales面板上,右键点击列表框Sales,在浮动菜单上选择Properties...2 选择Sort页.列表框Sales就像我们看到的那样,按照数据类型[State]和数值升序排列.列表会选择合适的排列种类. 因此,不用特别地选取,列表框Sales里的这些值已按照数值升序排列[Ascending].亦可自定义排列类型,但数据类型[State]将最终决定排序的种类.3 保持Numeric Value为选中状态,但改变排列方式为降序排列[Descending].4 点击OK.现在最高的数字排在了顶部,改变数字的显示格式Changing the number format数值数据能够以不同方式和不同的格式加以显示.1 右键点击列表框Sales,在浮动菜单上选择Properties...2 选择Number页.Sales的数字格式化选项没有打开,因为所有的数据格式均继承自文档的默认设置.而且文档的默认设置会受到你计算机的区域设置[控制面板->区域和语言设置]的影响.为了将列表框Sales中的数据格式化加上美圆$符号,这么做:3 选中Override Document Settings来在列表中创建一个带分隔符的数字格式.4 选取Money选项,点击OK.现在这些列表框Sales中的值以另一种的格式显示:一个逗号作为千位分隔符出现,在数值的前面出现了$.添加了2位十进制小数.5 再次打开Properties对话框.6 研究Number页.Format下的Preview显示出当前格式的示例.这个格式是可以被自定义的.在Format Pattem中去掉2位小数[将$#,##0.00;($#,##0.00)改成$#,##0;($#,##0.00)],同时观察Preview中显示结果的变化.如果你不能将0去掉,或者默认显示的是另一种数字格式,这也许跟你计算机的区域设置[控制面板->区域和语言设置]有关.7 点击OK,关闭对话框.排列这些值Aligning the values文本通常是左对齐,数字右对齐.这个设置是可以在Properties对话框下的Presentation页来改变.1 右键点击列表框Year,在浮动菜单上选择Properties...2 选择Presentation页.3 在Alignment中为Number点击Left选项.4 点击OK.统计表The statistics box统计表是当计算总数和平均值时以紧凑方式显示一栏分隔好的数值记录.统计表能够实现不同的数据统计功能.也能够在统计表中选择其他的函数,如:最小值,最大值等等.在面板Geography中包含了一个统计表Area(km.sq)在未选取的时候,统计表使用了所有可能参与计算的相应列表框的值来做运算,进而显示.一旦你在其他列表中选择了某个值,统计表会像其他面板对象一样产生关联反应,更新显示的数据.1 在列表框Country中选择Albania,Algeria,Andorra和Angola,观察统计表的反应.统计表能够被移动,调整大小和关闭,就像列表那样.创建统计表Creating a statistics box1 在工具栏中点击Clear,清除你之前的选取操作.2 切换到面板Sales,右键点击列表框Sales,在浮动窗口上选择Create Statistics Box显示出一个与列表名称相同的统计表.你也许需要调整它的大小来显示所有的数据:1 将光标放在统计表中,靠近右侧边框的位置.当光标变成'←|→',便可以开始拖动了.你可以限制每个值的小数位位数:1 右键点击统计表,打开Properties对话框.2 在Number页.在Functions下,点击Average选择Override Default Settings.3 选取Fixed to,在Decimals选取2.点击OK.你将立即看到公司销售产品的总金额为2317233,总计713个销售等等.你也能够选择新的面板对象来创建统计表,统计表来自新面板对象的菜单或是在工具栏上点击Create Statistics Box按钮.在本案中,New Statistics Box对话框看起来和创建列表时的对话框很相似,但它只包含4个页面.在General页,你选取自己需要的统计功能.在统计表中选取Making selections in a statistics box你能够在统计表中通过点击非计算函数来进行选取操作,例如:最小值或最大值1 通过点击函数Max来查找消费最大的购买者[Customer].选取动作导致列表框Customer关联的显示出该统计值相应的归属者.2 在工具栏中点击Clear,清除你之前的选取操作.保存,关闭和退出Saving, closing and exiting第四课柱状图和饼图LESSON 4 BAR CHARTS AND PIE CHARTS打开文档Opening the document1 启动QlikView.2 打开MyTutorial.qvw.使用快速类型更迭图标来改变图表类型Changing chart types using a fast type change icon在QlikView中有些图表会准备多个不同的类型来展示数据.这些展示通过一个小图标来完成,如果你点击该图标,它将显示下一个图表类型的微缩图.1 切换到面板Geography,观察Area这个柱状图.在标签栏上的最小化图标的左侧你将找到fast typechange图标.2 左键点击该图标.图形将会转变成一个线形图3 这个图表会在3种图表类型间做转换:柱状,线条和饼.如果你再度点击图标将使得图表转换成饼图显示.4 现在右键点击fast type change图标.一个下拉菜单将列出所有可选的图表类型.点击柱状图表的图标,我们将图表的展示退回到原点.所有图表均能通过在图表上点击右键选择Properties对话框,通过相关设置进而转换成可用的7种图表类型中的任意一种.在图表种进行选取操作Making selections in a chart知道现在,我们只学习了在列表中的选取操作.然而在图表中也可以对数据进行选取.回到面板Geography中的柱状图Area.它显示了10个最大的国家.1 在图表中用鼠标框选出一个色块区域用于选取其中一些柱图[不必全部框住,只要框出的色块和柱图存在重叠即可选中].选好后,释放鼠标.2 你已通过色块选择了一些国家.检查列表框Country.也可以通过在列表框Country中点击国家名称来间接的在柱状图Area中对国家进行选取:3 在列表框Country中选取一个或多个国家名称.观察柱状图Area的反应.4 清除你之前的选取操作.移动和调整大小Moving and sizing通过Quick Chart Wizard来创建柱状图Creating a bar chart using the Quick Chart Wizard工具栏包含了2个按钮用于创建图表.叫做Quick Chart Wizard的按钮帮助你用少而简单的步骤来创建一些常用的图表类型.叫做Create Chart的按钮,它提供完整的设置步骤来创建各种图表.如果你不做任何设置,你将得到一个具有完全特征的图表,当然你可以在任何时候来修改这些设置.如果工具栏没有出现,你可以通过View - Toolbars - Design来得到.你将要开始创建一个简单的图表,用于显示每个国家的销售总数.1 切换到面板Sales,在工具栏上点击Quick Chart Wizard按钮.打开Quick Chart Wizard的开始页.点击Next >.2 Quick Chart Wizard的Step 1包含了不同图表类型的图标.默认选择的是柱状图Bar Chart.点击Next >.下一个页面,定义维度[Define dimension(s)],这里你定义每一个柱体在柱状图中的含义.在本案中每一个柱体代表一个国家.3 在First Dimension选取Country,点击Next >.在下一个页面,定义表达式[Define Expression],你定义柱体的高度在柱状图中代表的意义.答案,在本案中表示的是每个国家的销售总数.4 为了得到每个国家的销售总数,选取Sum.在下拉列表中选取Sales,点击Next >.5 在第四个页面你可以通过分别点击Style,Orientation和Mode下的图标来选取一个图表格式.保持默认的选项,选中Show Numbers以在每个柱体上显示相应的数值.6 点击Finish.新的图表出现在你的屏幕上.你可以在任何时候通过Properties对话框来调整现有的图表.7 右键点击图表,在浮动菜单上选择Properties...8 在General页,Window Title下填入Sales, Show Title in Chart下填入Sales per Country.9 点击OK.图表的布局不是很理想:不同的数字重叠在了一起.你能够改变这一现状.不管怎样,你可以在图表里选取或是通过其他选取方式来让图表显示结果:10 在列表框Salesman中选取Ann Lindquist.图表立即显示出Ann Lindquist有销售记录的国家,而且包含了销售总金额.通过Create Chart来创建柱状图Creating a bar chart using the full chart wizard现在你将再度创建相同的图表- 这一次将使用完整的创建过程.1 还是在面板Sales,点击工具栏上的Create Chart按钮.第一页General.在这个页面你能够为作业选择你喜欢的图表类型.柱状图是被默认选取的.2 Window Title下填入Sales, Show Title in Chart下填入Sales per Country.3 点击Next >.第二页,维度[Dimensions].这里你能够设置在X轴[横坐标]上的维度,在本案中你希望每个柱体代表一个国家.左侧的列表包含了所有可用的条目和分组.4 在Available Fields/Groups下选择Country,点击Add>将它移动到Used Dimensions下用于显示.5 点击Next >.6 打开对话框Expression和Edit Expression.使用它们来设置一个或多个表达式在Y轴[纵坐标]上显示其结果,在本案中你希望每个柱体的高度代表国家销售的总数.你能够在Expression OK下直接输入表达式,也可以使用在Aggregation和Field下预设的函数.7 在Aggregation的下拉列表中选取Sum,然后在Field的下拉列表中选取Sales.8 点击Paste.Expression OK下出现了表达式.你也可以在Expression OK下直接书写表达式.9 点击OK.关闭Edit Expression对话框.你刚刚定义的表达式出现在Expressions dialog对话框中Definition下方.你现在已经选取了一个变量一个表达式,换言之,已完成创建图表的基本步骤.10 在Label下填入Sales.11 点击Next >,花点时间研究剩下的页面.12 点击Finish.如果列表框Salesman中的Ann Lindquist没有被选取,那么选取她.将这个图表和之前快速创建的图表比较一下.你将注意到柱体的顶部没有数值显示.这是由于不同的设置造成的.删除图表Removing a chart你只需要保留其中一个你创建的图表.1 右键点击第一个图表,在浮动菜单上选择Remove.改变排列种类Changing the sort order图表一般情况下按照字母表顺序排列.你也许希望将最大的客户国家放在左侧: You may prefer to put the main customer country furthest to the left:1 右键点击图表Sales,在浮动菜单上选择Properties...2 切换至Sort页.3 选择Y-value,让国家按照它们的总销售来排列.4 选择Y-value为Descending,来将最高的柱体放在左侧.5 点击OK.6 清除你之前的选取操作.限定柱体的数量Limiting the number of bars改进图表为概要显示,你能够限定柱体的最大显示数量.1 右键点击图表Sales,在浮动菜单上选择Properties...2 切换至Presentation页3 选中Dimension Limitations下的Max Visible Number(1 - 100).输入10.4 点击OK.清除你之前的选取操作.图表中显示经过改良剩下10个柱体.在柱体上显示数字Displaying numbers on the bars接下来我们希望在我们图表的柱体顶部显示相应的数字.1 右键点击图表Sales,在浮动菜单上选择Properties...2 切换至Expressions页.3 选取Display Options下的Numbers on Data Point.4 点击OK.你现在给每个柱体的顶部添加了Y轴[纵坐标]上相应的数字.改变数字的显示格式Changing the number format。
翻包工岗位说明书范例

岗 位 说 明 书 Job Description岗位报告与督导关系 Reporting Line and Directing Line岗位主要协调关系 Main Coordinative Relationship of the Position部 门协 调内部协调:班组在叉车工的配合下确保润叶切片工序中物料的连续性。
外部协调:工艺质量科、设备信息部 与工艺质量科配合共同确保烟包的质量,并同设备信息部协调以保障设备的正常运转。
岗位名称 Position Name翻包操作工所属部门 Department卷烟制造部岗位等级 Position Grade6岗岗位编码 Position Code岗位概述 Position Summary负责确保烟包的物料的连续性,避免异物进入下一工序。
翻包操作工生产主任生产班长职责与任务Responsibilities(一)主要职责:1、根据本岗位《作业指导书》进行规范操作,确保烟包的物料的连续性,避免异物进入下一工序。
2、负责对翻包的烟包质量监控,不得让不合格物料进入下工序。
3、维护设备、现场的清洁卫生。
4、积极参与班组建设,提合理化建议。
5、严格遵守工厂、制造中心制定的各项规章制度。
(二)主要任务:1、查看上一班的相关记录,并解决上一班遗留问题。
2、做好生产前的准备工作,检查设备是否正常,有异常及时通知维修工。
3、生产中,按照《作业指导书》进行规范操作,发现问题及时处理。
4、生产结束,按要求清洁设备与现场卫生。
5、填写相关记录。
岗位安全职责Responsibilities Of Safety1、严格按照工厂关于本岗位的《安全技术操作规程》、《作业指导书》进行作业,做到不违章指挥,不违章作业,不违反劳动纪律,拒绝违章指挥,纠正违章行为。
2、进入工作场所,正确佩戴和使用劳动防护用品,避免职业伤害;3、积极参加各类安全培训,掌握本职工作所需的安全生产知识,提高安全生产技能,增强事故预防和应急处理能力;4、发现事故隐患或者其他不安全因素,立即向安全生产管理人员或者现场负责人报告;并积极参与应急救援工作考核目标Objective of Responsibilities1.完成部门下达的年度任务考核目标。
KDView软件V2.0.1使用手册说明书

KDView软件V2.0.1 KDView软件V2.0.1用户手册广州市科缔智能科技有限公司二0二三年一月文件修改记录目录文件修改记录 (2)1.产品简介 (3)1.1产品概述 (3)1.2产品主要功能 (3)2.软件安装 (4)2.1运行环境要求 (4)2.2 获取软件 (4)3.软件操作说明 (5)3.1登录界面简介 (5)3.2 设备管理 (7)3.3 实时预览 (12)3.4 远程回放 (14)3.5 报警管理 (15)3.6 通用/功能设置 (17)3.7 图像浏览/分享 (19)3.8 个人中心 (21)3.9 注销登录 (22)3.10 语言切换 (22)1.产品简介1.1产品概述“KDView”监控软件为互联网时代最佳的手机视频监控解决方案,由前端采集设备、平台服务器和远程观看端三部分构成。
1.2产品主要功能主要功能:⚫注册登录、忘记密码⚫设备管理(添加、删除、修改、设置)⚫实时预览(对讲、转动摄像机、回放、报警信息)⚫远程回放(云存/SD卡)⚫报警管理⚫通用/功能设置⚫图像浏览和分享⚫个人中心(用户管理、系统设置、我的分享、关于)⚫注销登录⚫语言切换2.软件安装2.1运行环境要求苹果手机客户端要求ios9.0以上的系统;安卓手机客户端要求android 4.2及以上的系统。
2.2 获取软件苹果手机用户:在苹果应用市场(appstore)上搜索“KDView”安装。
安卓手机用户:在谷歌市场(google play)、应用宝、安卓市场等各大应用市场上搜索“KDView”安装。
3.软件操作说明3.1登录界面简介安装成功后,在程序列表点击KDView软件图标,软件就可以运行了。
启动程序进入登录界面,如图3.1a:⚫用户注册首次使用需要注册一个账号,该账户用于云存储我们的用户信息及相关设备列表,在登录菜单中,点击“注册账号”按钮,默认跳转到手机注册界面(如图3.1 b),点击右下角可切换到邮箱注册界面(图3.1 c),可点击左下角可切换回手机注册界面:图 3.1 b 图 3.1c⚫忘记密码在登录界面中,点击“忘记密码”按钮,跳转到“忘记密码”手机找回界面,可点击右下角的通过邮箱方式找回密码,可点击左下角可切换回手机找回密码界面。
training view 用法

training view 用法"Training view"这个词组在不同的上下文中可能有不同的含义。
以下是一些可能的用法:1、数据科学和机器学习中的训练视图:在数据科学和机器学习中,"training view"通常指的是用于训练模型的数据子集或特定视图。
这可以帮助研究人员或开发者专注于训练数据的一部分,例如,只查看特定特征、筛选出特定样本或者对数据进行预处理后的版本。
用法示例:pythonimport pandas as pd//假设我们有一个完整的数据集dfdf = pd.read_csv('dataset.csv')//创建一个训练视图,只包含部分特征和过滤后的样本training_view = df[['feature1', 'feature2', target']].loc[df['sample_condition'] == True]2、软件开发中的训练视图:在软件开发中,"training view"可能是指一种用户界面或报告,用于展示与培训或学习相关的信息。
例如,一个在线教育平台可能有一个"training view",显示课程进度、学习资源和评估结果。
用法示例(假设使用HTML和JavaScript):html<div id="trainingView"><h1>Training View</h1><p>Course Progress: <span id="courseProgress"></span></p><ul id="learningResources"></ul><div id="assessmentResults"></div></div><script>// 使用JavaScript获取和更新培训视图的内容function updateTrainingView() {document.getElementById('courseProgress').textContent = getCourseProgress();document.getElementById('learningResources').innerHTML = generateResourceList();document.getElementById('assessmentResults').innerHTML = displayAssessmentResults(); }// 示例函数,实际代码会根据具体需求实现function getCourseProgress() {return '50%';}function generateResourceList() {return '<li>Resource 1</li><li>Resource 2</li>';}function displayAssessmentResults() {return '<p>Assessment Result: Pass</p>';}updateTrainingView();</script>请根据你的具体需求和上下文来确定"training view"的正确用法。
job description 翻译
job description 翻译
job description.名词(企业管理用语)工作说明,职务说明;工作职责说明;岗位责任说明;职位说明(书)
复数:job descriptions
例句
1.Job description: teaching english, computer basic knowledge& information system.
职位描述:职位描述:教授英语、计算机基础以及计算机信息系统。
2.Or we could design another contract for such a job description.
或者我们可以重新设计一个针对这种工作的合同。
3.It's a key part of nearly every job description.
这在几乎所有的招聘要求里都是关键的一部分。
4.Please click the left image to see the job description.
请点击左边的图片,查看招聘需求。
5.Internal organization architecture and job description of the applying organization.
申请机构内部组织架构及其职掌。
jobdetail用法
jobdetail用法介绍在招聘和求职过程中,了解职位的详细信息非常重要。
JobDetail是一个用于描述职位的类,它包含了职位的各种属性和要求。
在这篇文章中,我们将探讨JobDetail的用法,并介绍如何使用它来更好地理解和应对职位需求。
JobDetail的作用JobDetail是一个非常重要的类,它提供了职位的详细信息,包括职位名称、公司名称、薪资待遇、工作地点、工作职责、任职要求等。
通过阅读JobDetail,求职者可以更好地了解职位的具体要求,从而决定是否适合自己。
JobDetail的属性JobDetail包含了多个属性,下面是一些常见的属性:1.职位名称:描述职位的名称,如”软件工程师”、“市场营销经理”等。
2.公司名称:描述公司的名称,如”ABC科技有限公司”、“XYZ市场营销有限公司”等。
3.薪资待遇:描述职位的薪资待遇,如”10k-15k”、“面议”等。
4.工作地点:描述职位的工作地点,如”北京”、“上海”等。
5.工作职责:描述职位的具体工作职责,包括日常工作内容、项目参与等。
6.任职要求:描述职位的具体任职要求,包括学历要求、工作经验要求、技能要求等。
如何使用JobDetail要充分利用JobDetail,求职者需要进行以下步骤:1. 仔细阅读首先,求职者需要仔细阅读JobDetail,了解职位的各个方面。
这包括职位名称、公司名称、薪资待遇、工作地点、工作职责和任职要求等。
通过仔细阅读,求职者可以获得对职位的整体了解。
2. 分析匹配度在阅读JobDetail的过程中,求职者应该将自己的能力和经验与职位要求进行对比。
求职者可以将职位要求分为基本要求和附加要求,然后评估自己是否满足这些要求。
如果求职者满足大部分基本要求,那么这个职位可能适合他们。
3. 准备面试如果求职者对职位感兴趣并决定申请,他们应该使用JobDetail来准备面试。
通过分析JobDetail中的工作职责和任职要求,求职者可以准备相关的面试答案,并展示自己的能力和经验。
fameview使用手册

fameview使用手册摘要:一、引言二、FameView 概述1.FameView 的定义2.FameView 的特点三、FameView 的使用1.安装与配置2.功能模块介绍3.操作步骤四、FameView 的高级应用1.定制化开发2.与其他系统的集成五、FameView 的维护与升级1.常见问题及解决方法2.版本更新与升级六、结论正文:一、引言FameView 是一款功能强大的可视化工具,广泛应用于各种行业领域。
本使用手册旨在帮助用户更好地理解和使用FameView,充分发挥其潜能。
二、FameView 概述2.1 FameView 的定义FameView 是一款基于Web 的可视化工具,通过简单的拖拽操作,用户可以轻松地构建出复杂的数据可视化效果。
2.2 FameView 的特点- 丰富的可视化效果:支持多种图表类型,满足不同场景的数据展示需求。
- 高度定制化:提供丰富的主题样式和组件,满足个性化展示需求。
- 强大的交互功能:支持多种交互方式,如数据区域缩放、数据过滤、动态更新等。
- 良好的兼容性:支持多种设备和浏览器,适应不同环境下的展示需求。
三、FameView 的使用3.1 安装与配置本节将介绍如何在不同环境下安装FameView,以及如何进行基本配置。
3.2 功能模块介绍本节将详细介绍FameView 的主要功能模块,包括数据导入、可视化配置、主题设置等。
3.3 操作步骤本节将给出使用FameView 的具体操作步骤,包括如何导入数据、创建可视化效果、设置交互功能等。
四、FameView 的高级应用4.1 定制化开发本节将介绍如何进行FameView 的定制化开发,包括自定义主题、组件和交互效果等。
4.2 与其他系统的集成本节将介绍如何将FameView 与其他系统进行集成,实现数据的互通和功能的扩展。
五、FameView 的维护与升级5.1 常见问题及解决方法本节将列举并解答FameView 使用过程中可能遇到的一些常见问题。
- 1、下载文档前请自行甄别文档内容的完整性,平台不提供额外的编辑、内容补充、找答案等附加服务。
- 2、"仅部分预览"的文档,不可在线预览部分如存在完整性等问题,可反馈申请退款(可完整预览的文档不适用该条件!)。
- 3、如文档侵犯您的权益,请联系客服反馈,我们会尽快为您处理(人工客服工作时间:9:00-18:30)。
MebesCruiser 3.5 User Guide 1. Introduction2. About This Guide3. Upload Database4.Login5. Launch Application6. Application Page6a. Database Frame6a-1 Display Window6a-2 Database Message Window6b. Menu Frame6b-1 Left Navigation Panel- Fit- Pan(8 directions)- Refresh- Pan/Zoom- Zoom In- Zoom Out- Ruler- Marker- Show Coordinates- Show Central Coordinates- Previous View- Stop- Coordinate6b-2 Top Menu Panel 6b-2.1 File - Load - Insert - Remove - Exit 6b-2.2 View - Goto - Set Level - Set Chip - Mirror - Rotate - Offset - Scale - Set Origin - Options 6b-2.3 Window - Zoom In - Zoom Out - Fit - Pan/Zoom - Set Marker - Set Ruler - Erase All 6b-2.4 Conference - Register7. Join a Conference1. IntroductionMebesCruiser is designed to view Jobdeck database. MebesCruiser empowers engineers to work at a productive and proactive pace in the last step before manufacturing. MebesCruiser helps our clients to possess more control over their own database sharing and increases flexibility in the design schedule. The power of precise communication provided by MebesCruiser enables users to posit themselves in the latest technology environment.MebesCruiser allows instantaneous multi-party online viewing and discussion. MebesCruiser also facilitates real-time collaboration between engineers. The conference mode allows all parties to have visual verification and exchange information while browsing the same database and immediately resolve ambiguity.2. About This GuideThis manual is currently available in HTML format. Conventions used in this guide:boldface : Button Representationitalic: Emphasis of"like this"3. Upload DatabaseAs a user logs into SpaceCruiser Server successfully, the user needs to first click on the MebesCruiser folder. Then, if the user has the privilege to upload database to the SpaceCruiser Server, he/she can click on Upload Database to go to Upload Files Page. On theUpload Database page, the user can choose the directory in which the file will be located.qSub folders list: The user can go to one of these listed sub-folders and upload the database.qSub folders list: The user can upload the database to the current directory or go to one of theselisted sub-folders to upload the database.Upload Database[Current database directory]qUpload a local file: In order to upload a local file, the user needs to click on the Browse buttonfirst to locate files on his/her local machine.with a new filename: To use a existing local file name, the user should leave this field blank.To give the uploaded file a new name, the user can type a desired name into this text field.Click Upload to complete the action of uploading, or click Reset to clear all text fields andre-enter desired information.Move/Copy/Delete/UnzipqMove/Copy a file : The user needs to highlight the particular file from the drop-down menu.to a directory: Select a new directory where the file will be relocated.with a new filename: Give the moved/copied file in the destined directory a new name.Click Move to moved the file from the current directory to the new one accordingly. Click Copyto copy the file to the new folder. Or, click Reset to re-enter the above information.Delete/Unzip a file: The user can select a file from the drop down menu to delete or upzip thefile.Click Delete or Unzip to delete or upzip the file. Or, click Reset to erase the choice that wasjust been made.Note: Folders cannot be deleted unless they are empty.4. LoginBefore logging into SpaceCruiser Server system, the user needs to acquire a Sign-In name and a password from the system administrator. Without the Sign-In name and password, he/she cannot access the server. According to the user's environment, he/she may access through various IP addresses to engage with the server.Following are steps to log into MebesCruiser:1.The user types the URL or IP address in the browser URL area.2.The browser will bring up a login page which requests the password and the Sign-In name.3.The user enters the requested information and click on the icon to login or click on the icon to clear all text fields and re-enter desired information.4.After authentication, the user successfully logs into SpaceCruiser Server.5. Launch ApplicationAfter the user logs into SpaceCruiser Sercer successfully, all applications available will be shown. He/She needs to click on the MebesCruiser folder to get into the MebesCruiser home page.Following are steps to log in to MebesCruiser:1.Click on the MebesCruiser folder to get into the MebesCruiser home page.2.On the GDSCruiser page, click on Launch Application to launch MebesCruiser.6. Application PageAfter launching MebesCruiser, the Application Pageappears. The Application Page is partitioned into twoframes. This manual will refer to these two frames asDatabase Frame and Menu Frame.6a. Database FrameThe Database Frame, the vertical space at the right area of the Application Page, has two portions:6a-1 Display WindowThe Display Window shows the graphical image of thedesign.6a-2 Database Message WindowThe Database Message Window includes the DatabaseMessage Window itself and the Monitor Window on theleft hand side. The Database Message Window reportsthe information for Ruler and Show Coordinate.Monitor Window: (Displayed on theupper-left side of the Database MessageWindow)Monitor Window displays a global view ofthe image in the Display Window.6b. Menu FrameThe Menu Frame includes two portions:6b-1 Left Navigation Panel6b-2 Top Menu Panel6b-1 Left Navigation PanelAfter loading a design database, a MEBES database appears in the Database Frame.It is very important to be able to look at different parts of the database and view the database in details. TheLeft Navigation Panel has different options to selectively show different parts of the display area. ThePan/Zoom mode is default for the operation. The user can change the mode by clicking the options within theLeft Navigation Panel.If the user wants to navigate the database, there are several actions that can be taken:Fit: Use this Fit button to fit the whole database content into the Display Window.Pan(Eight Directions): To navigate the database image, use the pan function by clicking on any of the eight direction arrow buttons to move the database image in the desired direction.Refresh: Refresh the current Display Window.Pan/Zoom: As the user clicks the Display Window , the Display Window initiates a pan action in the appropriate direction. The framework will take the location of the click as the center of the Display Window forthe next refreshing of the database.Free Hand Zoom: Drag-and-drop over a part of the image to zoom in. The selected area will appear at thehighest possible magnification.Right button Pan/Zoom: User who uses IE on Windows can use right mouse button click anddrag-and-drop to perform Pan/Zoom without changing the current mode.Zoom In: The current layout content in the Display Window will be magnified 2 times when the Zoom In button is clicked.Zoom Out: The current layout content in the Display Window will be reduced 2 times when the Zoom Out button is clicked.Ruler: When the Ruler is clicked, the user can draw a physical line at the intended area in the Display Window. The length of the line will be measured and shown at the center of the line as well as in theDatabase Message Window at the bottom of the Database Frame.The ruler is drawn based on the current setting. To change the setting of the Ruler feature, please chooseWindow > Set Ruler.Marker: By clicking on the Marker mode button, the user is able to draw markers with the mouse at the intended area in the Display Window.Markers are drawn based on the current marker mode. When a user wants to make any changes, pleasechoose Window > Set Marker.Show Coordinates:This option will provide the absolute location of the clicking point in the Display Window. To show the coordinates, click on the Show Coordinates button first, then click a point in theDisplay Window. The Display Window will mark a point, and x and y coordinates of the clicking point will beshown in the Database Message Window.Show Central Coordinates: This option will provide the central location of the polygon the user clicks in the Display Window. To show the central coordinates, click on the Show Central Coordinatesbutton first, then click a point of the polygon in the Display Window. The Display Window will mark the centralpoint of the polygon, and x and y coordinates of this point will be shown in the Database Message Window.Previous View: The user can click on Previous View to toggle the database display between the current view and the previous view.Stop: The Stop button stops drawing the image in process when the user wants to stop it.Coordinates: While moving the mouse over in the Display Window, the coordinate of the point that mouse is on will be shown on the coordinate fields in the left navigation panel.6b-2 Top Menu Panel6b-2.1 FileLoad : To load the MEBES database, choose File > Load. A pop-up window will appear. By clicking on Dir Tree, the system will list all sub-folders which are allowed to be accessed by this user. The user can choose the sub-folder that he or she would like to access. After the user enters the sub-folder, all MEBES/Jobdeck files that are allowed to be access will be listed. The user can choose the MEBES/Jobdeck file that he or she would like to view. The user also can click JB Files to list all Jobdeck files that are available. Or, the user can click All Files. On the drop-down menu, the system will automatically list all MEBES/Jobdeck files which are allowed to be accessed by this user.Please be patient about the database loading time since it depends on the size of the database and thespeed of the server. When the loading process is finished, a physical design image will be shown in theDisplay Window of the Database Frame.Insert: To insert a MEBES database or Jobdeck file, choose File > Insert.Remove: To remove a loaded MEBES database or Jobdeck file, choose File > Remove.Exit : Choose File > Exit to close the application and go back to the MebesCruiser home Page.6b-2.2 ViewGoto : The Goto feature is an absolute control which will move the center of Display Window to a specified location and zoom in/out according to user specified window size. To access the Goto feature, choose View > Goto. The user types the coordinates into the "x" window and the "y" window, specify the window size to zoom in, and submits the request by clicking on the Apply button to view the result or clicking on the Close button to close the pop-up window.Set Level : After loading a database, users can select levels of a Jobdeck file or a MEBES database to be shown in the Display Window by choosing View > Set Level. A pop-up window will appear for users tochoose. In a jobdeck, each level can be selected to draw Border, Fill, or Highlight using designated color and pattern. For Mebes file, user can choose to draw Reverse tone. Users may click on the Change-Level to change the display color and pattern for each level. The user can view the result by clicking on theApply-Color-Pattern button to view the result or click on the Close button to close the pop-up window.Set Chip : After loading a database, users can select chips of a Jobdeck file or a MEBES database to be shown in the Display Window by choosing View > Set Chip. A pop-up window will appear for users tochoose. In a jobdeck, each chip can be selected to draw and highlight. Users may click on the Change-Chip to change the display color for each chip. The user can view the result by clicking on the Apply button to view the result or click on the Close button to close the pop-up window.Mirror: To view the mirror of a Jobdeck file, choose View > Mirror. Checking Mirror on the pop-up window will display the mirror of the database after clicking the Apply button.Rotate: To rotate a Jobdeck file or MEBES database, choose View > Rotate. 0, 90, 180 and 270 degree angles are avaliable.Offset: Choose View > Offset and type in OffsetX and OffsetY on the pop-up window to offset the Jobdeck or MEBES database. The pop-up window also shows the current offset applied previously.Scale: Choose View > Scale to scale the Jobdeck file or MEBES database.Set Origin : Choose View > Set Origin to set origin to the lower left corner or center. User can specifydesired offset while setting the origin. Default is Lower Left Corner.Options : Users can click Options to set "Color by Level/Chip", "Resolution" ,"Grid" or "Snap to".Color by Level/Chip:qUsers can choose to have the display colored by Level or by Chip. This option only appearswhen a jobdeck is available and default is Color by Level.Resolution:qUsers can select a desired resolution for the image in the Display Window by choosing theappropriate number. The higher the number of resolution, the less time it will take to draw theimage.Grid:q1.This will set grid to the Display Window. The selections of the number indicate the distance betweendots. In other words, if you choose the smaller number, the grid density will be higher.Note: The grid will not show if it is too dense for the current view in the Display Window.2."Grid" can be disabled by setting the "Grid" to be zero.Snap to:qUsers can set snap to "Grid", "Corner", or "Edge". The default setting is snap to "Edge".6b-2.3 WindowZoom In : Choose Window > Zoom In to magnify the current layout content in the Display Window 2 times.Zoom Out : Choose Window > Zoom Out to reduce the current layout content in the Display Window 2times.Fit : Choose Window > Fit to fit the whole database content into the Display Window.Pan/Zoom : Choose Window > Pan/Zoom. As the user clicks the Display Window, the Display Windowinitiates a pan/zoom action in the appropriate direction. The framework will take the location of the click as the center of the Display Window for the next refreshing of the database.Free Hand Zoom: Drag-and-drop over a part of the image to zoom in. The selected area will appear at the highest possible magnification.Right button Pan/Zoom: User who uses IE on Windows can use right mouse button click anddrag-and-drop to perform Pan/Zoom without changing the current mode.Set Marker :By choosing Window > Set Marker, the user will see two sections in the pop-up window. The Color section consists of six colors: white, red, yellow, blue, green and cyan. The Type section consists of five types of markers: check, cross, arrow, square and line plus one eraser. Also, users can erase markers by clicking on the Erase All button.Set Ruler :By choosing Window > Set Ruler, a list of the available colors, including white, red, yellow, blue, green and cyan, will be shown in the pop-up window. At the same time, Type of Ruler, consists of Horizontal, Vertical and Anyangle, will also be shown. And, users also can erase rulers by clicking on the Erase Allbutton.The user can draw a physical line at the intended area in the Display Window after choosing the color and the type of the ruler of his/her preference. The length of the line will be measured and shown at the center of the line as well as in the Database Message Window at the bottom of the Database Frame.Erase All :This function will erase all markers and rulers that have been placed in the Display Window.6b-2.4 ConferenceRegister : The conference mode allows different parties to exchange comments while browsing the same database. To setup a conference, the host has to register a conference by choosing Conference > Register.Then there will be two blank text fields for Subject and Attendee List in the pop-up window. The user can enter the subject of the conference in the text field of Subject. The user needs to key in the name(s) orgroup(s) of the users that he/she allows to access the conference in the text field of Attendee List. After the user clicks OK, a conference ID will be assigned to this particular conference session.7. Join a ConferenceUsers can follow the steps to join a conference:1.Login to the SpaceCruiser Server2.Click on the MebesCruiser folder to get into the MebesCruiser home page3.Click Join Conference on the MebesCruiser home page to access the conference center page4.Click on the conference ID or5.Type in the conference ID in the text area and click JoinCopyright 1997-2004 Oridus Inc. All Rights Reserved.Web contact: support@Last modified on:。