GOCAD讲义
GOCAD讲义

GOCAD地质建模Gocad是以工作流程为核心的一款地质建模软件,达到了半智能化建模的世界最高水平,具有功能强,界面友好,易学易用,并能在几乎所有平台上(Sun, SGI, PC-Linux, PC-Windows)运行的特点。
以下通过一个简单的例子,说明GOCAD地质建模的主要过程。
第一部分 GOCAD的启动1、双击桌面上的Gocad启动图标,即可启动Gocad程序。
2、选择New project建立新工程,给工程起个名字,选择路径在文件夹Project中,点击保存,打开下图:3、选择Select All,点击OK即可。
4、弹出选择工程单位窗口如下。
此处选择平面上单位是英尺(Feet),深度单位也是英尺(Feet);时间选择毫秒;深度方向选择向上为增大;z值是时间域或深度域,选择深度域(最终如下图)。
选择完后点击OK。
5、打开如下Gocad主窗口。
第二部分 GOCAD数据加载一、地震数据加载以SEGY格式为例,加载三维地震数据选择File > Import objects >Seismic Data > SEG-Y 3D as Voxet。
在Data文件夹下选择文件“tornado.sgy”,点击OK即可加载,如下图。
二、井数据加载1、井位数据加载不同的数据格式有不同的加载方法。
以普通的文本格式为例,包括井名、x坐标、y坐标、补心海拔、井深等。
(1)加载方式是:File > Import objects > Well data > (path)Locations from column-based File ,在Data\Wells文件夹中选择文件“WellPaths”,接受默认,按next两次,打开下图:(2)对问题What information do you have for the path? 选择X-Y-TVDSS-MD。
下来的两个问题各选Feet和Use a Column。
GOCAD(外文资料) (20)
Tetrahedral Volume Mesh
− concatenate T−surf point distribution w/ octree point distribution − Apply 3D Delaunay tetrahedralization algorithm − Break edges that cross material boundary by point addition at location where edge intersects boundary
EES−6 Hydrology Geochemistry & Geology
Exploded View of Five Blocks
EES−6 Hydrology Geochemistry & Geology
GOCAD block model and close−up of triangulation
EES−6 Hydrology Geochemistry & Geology
Uniform finite difference grid to test geometry definition.
51**3 nodes
11**3 nodes
101**3 nodes
EES−6 Hydrology Geochemistry & Geology
EES−6 Hydrology Geochemistry & GeologyS1来自S4¡¡
¡
¡
¡
S2
¡
¡
¡
¡
¡
¡
¡
¡
¡
¡
R1
¡ ¡ ¡ ¡ ¡ ¡
EES−6 Hydrology Geochemistry & Geology
gocad教程
GOCAD综合地质与储层建模软件简易操作手册美国PST油藏技术公司PetroSolution Tech,Inc.目录第一节 GOCAD综合地质与储层建模软件简介┉┉┉┉┉┉┉┉┉┉┉┉┉┉1一、GOCAD特点┉┉┉┉┉┉┉┉┉┉┉┉┉┉┉┉┉┉┉┉┉┉┉┉┉1二、GOCAD主要模块┉┉┉┉┉┉┉┉┉┉┉┉┉┉┉┉┉┉┉┉┉┉┉1 第二节 GOCAD安装、启动操作┉┉┉┉┉┉┉┉┉┉┉┉┉┉┉┉┉┉┉┉2一、GOCAD的安装┉┉┉┉┉┉┉┉┉┉┉┉┉┉┉┉┉┉┉┉┉┉┉┉2二、GOCAD的启动┉┉┉┉┉┉┉┉┉┉┉┉┉┉┉┉┉┉┉┉┉┉┉┉3 第三节 GOCAD数据加载┉┉┉┉┉┉┉┉┉┉┉┉┉┉┉┉┉┉┉┉┉┉┉5一、井数据加载┉┉┉┉┉┉┉┉┉┉┉┉┉┉┉┉┉┉┉┉┉┉┉┉┉5二、层数据加载┉┉┉┉┉┉┉┉┉┉┉┉┉┉┉┉┉┉┉┉┉┉┉┉┉11三、断层数据加载┉┉┉┉┉┉┉┉┉┉┉┉┉┉┉┉┉┉┉┉┉┉┉┉11四、层面、断层面加载┉┉┉┉┉┉┉┉┉┉┉┉┉┉┉┉┉┉┉┉┉┉12五、地震数据加载┉┉┉┉┉┉┉┉┉┉┉┉┉┉┉┉┉┉┉┉┉┉┉┉12 第四节 GOCAD构造建模┉┉┉┉┉┉┉┉┉┉┉┉┉┉┉┉┉┉┉┉┉┉┉13一、准备工作┉┉┉┉┉┉┉┉┉┉┉┉┉┉┉┉┉┉┉┉┉┉┉┉┉┉13二、构造建模操作流程┉┉┉┉┉┉┉┉┉┉┉┉┉┉┉┉┉┉┉┉┉┉14三、构造建模流程总结┉┉┉┉┉┉┉┉┉┉┉┉┉┉┉┉┉┉┉┉┉┉40 第五节建立GOCAD三维地质模型网格┉┉┉┉┉┉┉┉┉┉┉┉┉┉┉┉41一、新建三维地质模型网格流程┉┉┉┉┉┉┉┉┉┉┉┉┉┉┉┉┉┉41二、三维地质模型网格流程┉┉┉┉┉┉┉┉┉┉┉┉┉┉┉┉┉┉┉┉41三、三维地质模型网格流程总结┉┉┉┉┉┉┉┉┉┉┉┉┉┉┉┉┉┉47 第六节 GOCAD储层属性建模┉┉┉┉┉┉┉┉┉┉┉┉┉┉┉┉┉┉┉┉┉48一、建立属性建模新流程┉┉┉┉┉┉┉┉┉┉┉┉┉┉┉┉┉┉┉┉┉48二、属性建模操作流程┉┉┉┉┉┉┉┉┉┉┉┉┉┉┉┉┉┉┉┉┉┉48三、属性建模后期处理┉┉┉┉┉┉┉┉┉┉┉┉┉┉┉┉┉┉┉┉┉┉66四、网格粗化┉┉┉┉┉┉┉┉┉┉┉┉┉┉┉┉┉┉┉┉┉┉┉┉┉┉74 第七节 GOCAD地质解释和分析┉┉┉┉┉┉┉┉┉┉┉┉┉┉┉┉┉┉┉┉78GOCAD综合地质与储层建模软件操作手册第一节GOCAD综合地质与储层建模软件简介Gocad是国际上公认的主流建模软件,在众多油公司和服务公司得到了广泛的应用。
基于GOCAD的三维地质模型构建方法

谢谢观看
2、导入数据:将准备好的地质数据导入到GOCAD软件中,支持多种数据格式, 如CSV、Excel、DBF等。
3、编辑数据:在软件中对数据进行清洗、过滤和整理,以确保数据的质量和 准确性。
4、创建地层实体:利用软件提供的工具,创建地层实体并设置其属性,如厚 度、颜色等。
5、添加断裂构造:利用软件的断裂工具,添加断裂构造信息,并设置其属性, 如方向、倾角等。
2、二维切片图:通过将三维模型进行二维切片,生成各种专业图表,如柱状 图、平面图等,满足不同领域的需求。
3、三维可视化效果:利用GOCAD的强大可视化功能,对生成的三维地质模型 进行实时三维可视化操作,提供更直观的地质信息展示效果。
结论基于GOCAD的三维地质模型构建方法是一种高效、精确的建模技术,已广 泛应用于地质领域。该方法通过数据采集、数据处理和模型构建等步骤,能够 生成高精度的三维地质模型。通过质量控制和成果展示,这种方法具有较高的 实用价值和使用价值。
研究方法
本次演示采用文献调研和案例分析相结合的方法,首先对现有的地质数据管理 和三维地质模型构建方法进行梳理和评价,然后通过实际案例深入探讨这些方 法的优缺点及改进方向。此外,我们还引入了大数据和人工智能技术,开发了 一套全新的基础地质数据管理和三维地质模型构建系统。
结果与讨论
通过对文献的梳理和案例分析,我们发现现有的地质数据管理方法主要面临数 据格式不统一、数据冗余和数据更新困难等问题。而三维地质模型的构建方法 则存在建模过程复杂、计算精度不高和可视化效果不佳等问题。针对这些问题, 我们提出了全新的解决方案:首先,我们通过统一数据格式、引入数据挖掘技 术和建立动态更新机制等手段,
三维地质模型构建的第一步是数据采集。数据采集包括地面测量、钻孔数据、 遥感影像等多种来源的数据。这些数据经过处理和筛选,为后续建模提供基础 数据支撑。
GOCAD 软件三维地质建模方法
GOCAD 软件三维地质建模方法1建模方法GOCAD 三维地质建模主要包括两类:一类是构造模型(structural modeling)建模,一类是三维储层栅格结构(3D Reservoir Grid Construction)建模。
(1)构造模型(structural modeling)建模建立地质体构造模型具有非常重要的意义。
通过建立构造模型能够模拟地层面、断层面的形态、位置和相互关系;结合反映地质体的各种属性模型的可视化图形,还能够用于辅助设计钻井轨迹。
此外,构造模型还是地震勘探过程中地震反演的重要手段。
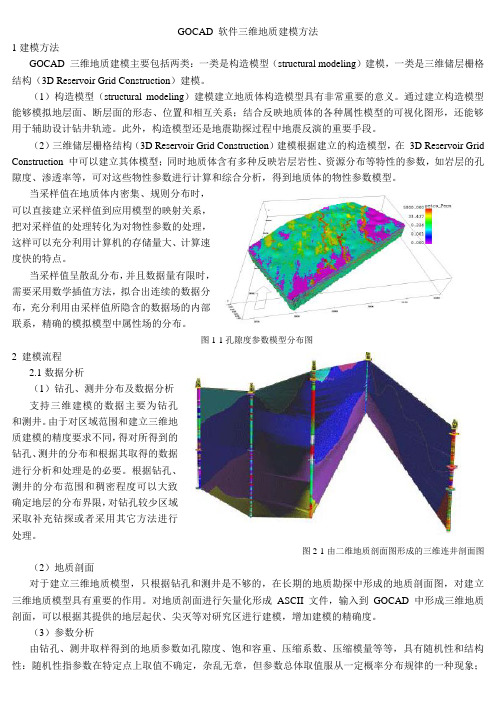
(2)三维储层栅格结构(3D Reservoir Grid Construction)建模根据建立的构造模型,在3D Reservoir Grid Construction 中可以建立其体模型;同时地质体含有多种反映岩层岩性、资源分布等特性的参数,如岩层的孔隙度、渗透率等,可对这些物性参数进行计算和综合分析,得到地质体的物性参数模型。
当采样值在地质体内密集、规则分布时,可以直接建立采样值到应用模型的映射关系,把对采样值的处理转化为对物性参数的处理,这样可以充分利用计算机的存储量大、计算速度快的特点。
当采样值呈散乱分布,并且数据量有限时,需要采用数学插值方法,拟合出连续的数据分布,充分利用由采样值所隐含的数据场的内部联系,精确的模拟模型中属性场的分布。
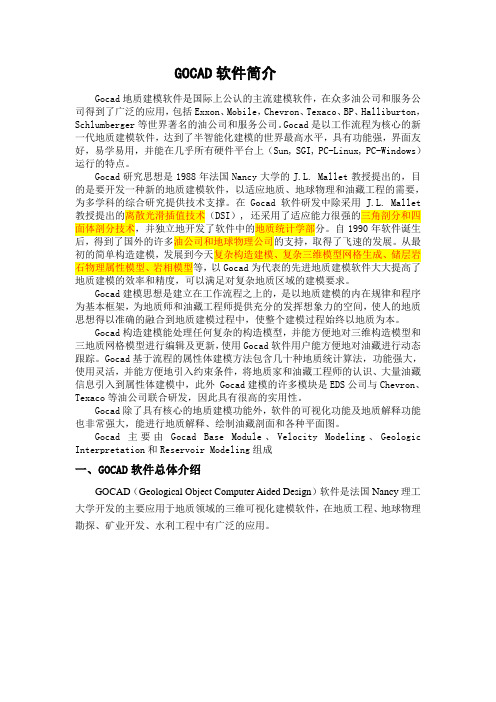
图1-1孔隙度参数模型分布图2 建模流程2.1数据分析(1)钻孔、测井分布及数据分析支持三维建模的数据主要为钻孔和测井。
由于对区域范围和建立三维地质建模的精度要求不同,得对所得到的钻孔、测井的分布和根据其取得的数据进行分析和处理是的必要。
根据钻孔、测井的分布范围和稠密程度可以大致确定地层的分布界限,对钻孔较少区域采取补充钻探或者采用其它方法进行处理。
图2-1由二维地质剖面图形成的三维连井剖面图(2)地质剖面对于建立三维地质模型,只根据钻孔和测井是不够的,在长期的地质勘探中形成的地质剖面图,对建立三维地质模型具有重要的作用。
gocad教程

.GOCAD综合地质与储层建模软件简易操作手册美国PST油藏技术公司PetroSolution Tech,Inc.目录第一节 GOCAD综合地质与储层建模软件简介┉┉┉┉┉┉┉┉┉┉┉┉┉┉1一、GOCAD特点┉┉┉┉┉┉┉┉┉┉┉┉┉┉┉┉┉┉┉┉┉┉┉┉┉1二、GOCAD主要模块┉┉┉┉┉┉┉┉┉┉┉┉┉┉┉┉┉┉┉┉┉┉┉1 第二节 GOCAD安装、启动操作┉┉┉┉┉┉┉┉┉┉┉┉┉┉┉┉┉┉┉┉2一、GOCAD的安装┉┉┉┉┉┉┉┉┉┉┉┉┉┉┉┉┉┉┉┉┉┉┉┉2二、GOCAD的启动┉┉┉┉┉┉┉┉┉┉┉┉┉┉┉┉┉┉┉┉┉┉┉┉3 第三节 GOCAD数据加载┉┉┉┉┉┉┉┉┉┉┉┉┉┉┉┉┉┉┉┉┉┉┉5一、井数据加载┉┉┉┉┉┉┉┉┉┉┉┉┉┉┉┉┉┉┉┉┉┉┉┉┉5二、层数据加载┉┉┉┉┉┉┉┉┉┉┉┉┉┉┉┉┉┉┉┉┉┉┉┉┉11三、断层数据加载┉┉┉┉┉┉┉┉┉┉┉┉┉┉┉┉┉┉┉┉┉┉┉┉11四、层面、断层面加载┉┉┉┉┉┉┉┉┉┉┉┉┉┉┉┉┉┉┉┉┉┉12五、地震数据加载┉┉┉┉┉┉┉┉┉┉┉┉┉┉┉┉┉┉┉┉┉┉┉┉12 第四节 GOCAD构造建模┉┉┉┉┉┉┉┉┉┉┉┉┉┉┉┉┉┉┉┉┉┉┉13一、准备工作┉┉┉┉┉┉┉┉┉┉┉┉┉┉┉┉┉┉┉┉┉┉┉┉┉┉13二、构造建模操作流程┉┉┉┉┉┉┉┉┉┉┉┉┉┉┉┉┉┉┉┉┉┉14三、构造建模流程总结┉┉┉┉┉┉┉┉┉┉┉┉┉┉┉┉┉┉┉┉┉┉40 第五节建立GOCAD三维地质模型网格┉┉┉┉┉┉┉┉┉┉┉┉┉┉┉┉41一、新建三维地质模型网格流程┉┉┉┉┉┉┉┉┉┉┉┉┉┉┉┉┉┉41二、三维地质模型网格流程┉┉┉┉┉┉┉┉┉┉┉┉┉┉┉┉┉┉┉┉41三、三维地质模型网格流程总结┉┉┉┉┉┉┉┉┉┉┉┉┉┉┉┉┉┉47 第六节 GOCAD储层属性建模┉┉┉┉┉┉┉┉┉┉┉┉┉┉┉┉┉┉┉┉┉48一、建立属性建模新流程┉┉┉┉┉┉┉┉┉┉┉┉┉┉┉┉┉┉┉┉┉48二、属性建模操作流程┉┉┉┉┉┉┉┉┉┉┉┉┉┉┉┉┉┉┉┉┉┉48三、属性建模后期处理┉┉┉┉┉┉┉┉┉┉┉┉┉┉┉┉┉┉┉┉┉┉66四、网格粗化┉┉┉┉┉┉┉┉┉┉┉┉┉┉┉┉┉┉┉┉┉┉┉┉┉┉74 第七节 GOCAD地质解释和分析┉┉┉┉┉┉┉┉┉┉┉┉┉┉┉┉┉┉┉┉78GOCAD综合地质与储层建模软件操作手册第一节GOCAD综合地质与储层建模软件简介Gocad是国际上公认的主流建模软件,在众多油公司和服务公司得到了广泛的应用。
GOCAD功能简介及应用实例
GOCAD软件简介Gocad地质建模软件是国际上公认的主流建模软件,在众多油公司和服务公司得到了广泛的应用,包括Exxon、Mobile,Chevron、Texaco、BP、Halliburton,Schlumberger等世界著名的油公司和服务公司。
Gocad是以工作流程为核心的新一代地质建模软件,达到了半智能化建模的世界最高水平,具有功能强,界面友好,易学易用,并能在几乎所有硬件平台上(Sun, SGI, PC-Linux, PC-Windows)运行的特点。
Gocad研究思想是1988年法国Nancy大学的J.L. Mallet教授提出的,目的是要开发一种新的地质建模软件,以适应地质、地球物理和油藏工程的需要,为多学科的综合研究提供技术支撑。
在Gocad软件研发中除采用J.L. Mallet 教授提出的离散光滑插值技术(DSI), 还采用了适应能力很强的三角剖分和四面体剖分技术,并独立地开发了软件中的地质统计学部分。
自1990年软件诞生后,得到了国外的许多油公司和地球物理公司的支持,取得了飞速的发展。
从最初的简单构造建模,发展到今天复杂构造建模、复杂三维模型网格生成、储层岩石物理属性模型、岩相模型等,以Gocad为代表的先进地质建模软件大大提高了地质建模的效率和精度,可以满足对复杂地质区域的建模要求。
Gocad建模思想是建立在工作流程之上的,是以地质建模的内在规律和程序为基本框架,为地质师和油藏工程师提供充分的发挥想象力的空间,使人的地质思想得以准确的融合到地质建模过程中,使整个建模过程始终以地质为本。
Gocad构造建模能处理任何复杂的构造模型,并能方便地对三维构造模型和三地质网格模型进行编辑及更新,使用Gocad软件用户能方便地对油藏进行动态跟踪。
Gocad基于流程的属性体建模方法包含几十种地质统计算法,功能强大,使用灵活,并能方便地引入约束条件,将地质家和油藏工程师的认识、大量油藏信息引入到属性体建模中,此外 Gocad建模的许多模块是EDS公司与Chevron、Texaco等油公司联合研发,因此具有很高的实用性。
gocad
A GOCAD Object file consists of three parts: the Header, the Body and the End marker. A GOCAD Object file may also containused to call up the correct GOCAD Object Reader when the file isvalues, which include the0.44704*meters/seconds0.3048*meters/seconds0.3048*seconds*metersRestrictions: at most one scalar in front, at most one division.A.2 ObjectThe Object file elements define the Object style and the Object coordinate space and Units. Style AttributesThe HEADER block, delimited by {and}, contains the Style definition. Each line defines an Attribute of an Object. Attributes are strictly optional, except for the name of the Object. An Object must have a name.If preferred, an Attribute can be given on a separate line outside of the HEADER block; in that case the line should begin with the HDR keyword as shown in Example 3 (page 4).An example of Object Style element is:A.2.1 Coordinate SystemThe Object Coordinate System paragraph is optional for allobjects. If the paragraph is not present, the object is loaded inthe default coordinate system in the current session.The coordinate system description must be given after theHEADER block and before any other keyword giving the geometryof the object such as VRTX, PVRTX, ORIGIN, AXIS ....The Coordinate System must be given as follows:GOCAD_ORIGINAL_COORDINATE_SYSTEMNAME nameAXIS_NAME name_u name_v name_wAXIS_UNIT unit_u unit_v unit_wZPOSITIVE keywordEND_ORIGINAL_COORDINATE_SYSTEMIt is imperative that the Coordinate System definition is enclosed between the keywordsGOCAD_ORIGINAL_COORIDNATE_SYSTEM and END_ORIGINAL_COORDINATE_SYSTEM.The NAME and AXIS_NAME values are information string which gives the name of the local object coordinate system and its axes. The values must be specified by strings of characters enclosed in double-quotes, i.e. AXIS_NAME "X" "Y" "Z" or AXIS_NAME "X" "Y" "T"The AXIS_UNIT specifies the unit for each axes. The axis unit for the U and V axes must be identical, the axis unit for the W axis can be different from the unit of the U and V. It is possible to define units as AXIS_UNIT "m" "m" "m" or AXIS_UNIT "m" "m" "ft" but a definition such as AXIS_UNIT "m" "ft" 'km" is invalid. The AXIS_UNIT values must be specified by strings of characters enclosed by double-quotes.The ZPOSITIVE value indicates the direction of the Z axis. The values allowed for the keyword after ZPOSITIVE are either Depth (Z is increasing downwards) or Elevation (Z is increasing upwards)The coordinates are read in double precision converted to simple precision after coordinate system conversion. When an object is loaded into Gocad, its local coordinate system is compared with the current global coordinate system: if needed, the object geometrical coordinates are converted internally. When the coordinates are displayed, for example, for a picking in the 3D camera, the coordinates displayed are in the session coordinate system. When the object is saved back to a stand alone file, its geometrical coordinates are restored in its original coordinates system.A.3 AtomicThe Atomic data format defines the points, locations and Property values, of an Atomic (currently, this includes PointsSet, Curve, Surface, Solid and GShape). The Atomic inherits all of the Object file format elements, plus Atomic data.A.3.1 AtomicThis section describes the recommended Atomic file format.Since Property values are optional, a basic Atomic data line consists of three parts: Type, ID number, and data: VRTX ID X Y Z [CN]where the XYZ describes the location of that point. Additional information maybe attached at the end of each VRTX line to specify the Interpolation Restriction on that Atom (Control Node information).For example:A.3.1.1 Properties definitionIf there are Properties, they must bedeclared after the HEADER block andbefore the first point data line as:PROPERTIES Pname1 Pname2...PROPERTY_CLASSES class_name1class_name2 (optional, but if youdeclare one, you must declare all)UNITS unit1 unit2...(optional, but if youdeclare one, you must declare all)NO_DATA_VALUES v1 v2...(optional,but if you declare one, you mustdeclare all)ESIZES esize_1 esize_2... (optional, but if you declare one, you must declare all)The PROPERTIES line list all the properties that will be attached to the point. The ordering of the properties on the line correspond to the ordering of the properties values associated to the point definition.The PROPERTY_CLASSES line lists the property class names for each property defined in the PROPERTIES list. If one property class must be listed all property classes must be listed.The NO_DATA_VALUES line lists the no-data-values for each of the property defined in the property list. For vectorial properties, there is only one no-data-value and each property vector element should be equal to this value if it is to be treated as a no-data-value vectorial property.The UNITS line lists the units for each of the property defined in the property list (See Units for format specification of Units).The ESIZES line lists the dimension of each property defined in the property list. By default the dimension of a property is 1, but for example a property representing a 3D vector will be of dimension 3. For example. if you have a set of points with a 1 dimensional property (called "porosity") and a 3D vectorial property called "throw", the definition of the properties and one point will look like:PROPERTIES porosity throw ESIZES 1 3 PVRTX 1 X Y Z porosity_value throw_x throw_y throw_zwhere throw_x, throw_y and throw_z are the three components of the throw vector at the specified location.A.3.1.2 Point location and properties definitionThe data line which defines a point location and its properties look likes:PVRTX ID X Y Z PV1 PV2...where PV1, PV2... are Property values. For example.A.3.2 Parts (Subset)An Atomic Object can have its VRTXgrouped into subsets. In a VSet, the keywordis SUBVSET; in PLine, it is ILINE; in TSurf, itis TFACE; and in TSOLID, it is TVOLUME.A.3.3 Atomic-Old from C-GOCADThis section describes an older Atomicformat, mainly made to be compatiblewith C-GOCAD file format.The format consists of two sections, thelocation section and the Propertysection. The Property section isoptional.The location section is identical to thenew format:VRTX ID X Y ZThe Property value section contains a header and the list of Property values associated to a point defined in the previous section. The header defines the names of the DataPack Fields (Properties) associated with the Atomic. The following example Example 5 (page 8)declares three properties.FIELDS Pname1 Pname2(or PROPERTIES Pname1 Pname2...)PROPERTY_CLASSES class_name1 class_name2 (optional, but if you declare one, you must declare all)UNITS unit1 unit2...(optional, but if you declare one, you must declare all)NO_DATA_VALUES v1 v2...(optional, but if you declare one, you must declare all)ESIZES esize_1 esize_2... (optional, but if you declare one, you must declare all)The Property section define, for each point defined in the location section, the Property values associated with the Atomic's DataPackFields.REC ID1 ID2 PV1 PV2...Associated with a REC definition are two identifiers needed to be specified for compatibility reasons with earlier version. The two identifiers must be identical.An example of a Object file identical to the one given in Example 5 (page 8), but in this old data format is given below:.A.4 TSurf (Surface)The data file of a TSurf includes the inherited file elements of a Object and of an Atomic. The Atoms (Vertices) of the TSurf must be defined before the triangles.A.4.1 Geologic InformationBefore defining vertices and triangles, geologic information can be given.Geological information consists of GEOLIGICAL_TYPE, GEOLOGICAL_FEATURE and STRATIGRAPHIC_POSITION.The geological type of a TSurf can be specified using the following format:GEOLOGICAL_TYPE geological_type_namewhere geological_type_name can be one the following: top, intraformational, fault, unconformity, intrusive, topography, boundary, and ghost. The information is used during layer construction.The stratigraphic position is specified as follow:STRATIGRAPHIC_POSITION age timewhere age is the name of a stratigraphic unit. time is the numerical value of age (35000, etc.). This information is used during layer computation.The geological feature is specified as follow:GEOLOGICAL_FEATURE geologic_feature_namewhere geologic_feature_name is the name of the geologic feature that the surface represents. This information is used to associate surface to well markers (the geologic feature should have the same name than the well marker). A.4.2 TrianglesTriangles definition must occur after vertices definitions. Each Triangle is then defined by its three Vertices (Atoms) in the following format:TRGL id1 id2 id3where ids are the IDs of the already-defined Atoms (Vertices). For example, the ascii file corresponding to a TSurf named SQUARE, containing four vertices, and two triangles is shown in Figure1.A.4.3 Special Points: VRTX vs. ATOMIn addition to the VRTX or PVRTX point/vertex descriptor find in the Atomic format definition, on can find the additional line inside a TSurf ascii file:ATOM id1 id2 (where id1 > id2)where id1 is the index of the new ATOM and id2 is the index of the already existing VRTX node which XTZ this Atom shares.The goal of the ATOM keyword is to create a new ATOM but which shares an already existing vertex. An Atom node has its one Property values but it is spatially linked to the existing VRTX node. In other word, an ATOM and its referenced VRTX are collocated, but not connected. Triangles construction will use the vertex id or the atom id.An example of the use of such Atom record is given below:The input Tsurf file on the left will create a Surface shown at the center. The Surface has two TFaces, because two Triangles need to share an edge to be considered connected. When the Surface is saved, GOCAD will output the file on the right. It recognizes that the two Triangles both have one vertex at an identical location, but topologically, they can not be the same point. So, GOCAD creates a new point, ATOM 6, that shares the identical location of VRTX 3, but is an independent point in the sense that it has its own Property values (not in this case). However, had you have two more triangles in your input file, TRGL 2 4 3 and TRGL 6 5 1, the ATOM line would not have been created because the four triangles are then connected through direct or indirect edge-sharing.A.4.4 Parts/TFaceThe TFACE keyword is proposed to ensure identical indexing of the VRTX every time you save an Surface whose mesh you have not modified.In Figure2 the file on the right (the one output by GOCAD) not only has the extra ATOM line, it also two TFACE lines to separate VRTX (and ATOM) and TRGL from different TFaces. They arecurrently commented out for their full implementation is still to be determined by the GOCAD Committee.GOCAD will accept the simpler format shown on the right of Figure2 (where all the triangles and VRTX definition of all parts are all merged into one block) but will output the file shown on the right of Figure2.A.4.5 BordersAn edge of a TSurf can be a single piece or can be divided into multiple pieces. Each piece is called a Border, and it is separated from its neighboring Border by a Border Extremity. A Border Extremity is a designated node (VRTX, ATOM) on an edge of a TSurf that separates two Borders.Borders definition should appear at the end of the TSurf file format, in the format shown below:BSTONE atom_vrtx_idBORDER border_id bstone_id_1 bstone_id_2The BSTONE line defines an ATOM/VRTX as a Border Extremity.The BORDER line defines the border, border_id, as starting at vrtx_id1, which must have been declared as a Border Extremity in proceeding BSTONE lines, and continuing in the direction of vrtx_id2, which must be adjacent to vrtx_id1 (this border ends when it runs into another Border Extremity).The Border Extremities are always included in the list of points along the border.A.5 PLine (Curve)The Ascii PLine format inherits from the Object and from the Atomic formats. As for the TSurf, geologic information can be specified (See Geologic Information (PageA10)). For PLine geologic feature is used to relate multiple PLine to the same horizon.The Atoms of the Lines must be defined first. Each Segment in the PLine is then defined by its 2 apices in the following format:SEG id1 id2where ids are the IDs of the already-defined Atoms.For example, the ascii file corresponding to he PLine represented in Figure3 may look like:If no segments information is given, the atoms are assumed to form an open line, from the first atom to the last atom in the file order.If the PLine is composed of multiple parts, the parts can be combined or can be separated into ILines (or Isolated Lines). Each ILine is separated by a ILINE keyword and each ILine specify its own points and segments. In the same manner as for the TSurf, an ILINE keyword is proposed to ensure identical indexing of the VRTX every time you save a line which topology has not modified.A.6 TSolid (Solid)The Ascii TSolid format inherits from the Object and from the Atomic formats. The Atoms of the Atomic must be defined first. Each Tetrahedron in the Solid is then defined by its 4 apices in the following format.: TETRA id1 id2 id3 id4where ids are the IDs of the already-defined Atoms.For example, the ascii file corresponding to he Solid represented in Figure4 may look like:If the TSolid is composed of multiple parts, the parts can be combined or can be separated into TVolumes (or Tetrahedralize volumes). Each TVolume is separated by a TVOLUME keyword and each TVolume specify its own points and tetrahedras.[DIP azimuth dip][NORM X Y Z][MREF horizon_name][UNIT >rock_layer_name]Additional information (between [and]) can be attached to each Marker. This extra information includes the orientation (given as DIP or NORM) of the Marker, the Marker Reference Horizon (currently not utilized by GOCAD) and the Rock Unit (currently not utilized by GOCAD).The DIP information is given in Grads.What are Grads? It is an ancient French measurement of angles; there are 100 grads in a right angle (as opposed to 90 degrees in a right angle).The NORM information is always given in XYZ, representing the normal vector of the Marker. This is the preferred representation for Marker orientation (this is the way GOCAD will output Marker orientation information, instead of DIP).The optional information can be on the same line as the marker itself, or on lines that immediately follow the marker ascii code (MRKR).New WellMarker dip specificationsDIP angles are to be given in Grads, which is not a unit a lot of people are familiar with. GOCAD introduced a new dip specification DIPDEG where the two angles are given in degree.DIPDEG azimuth dipA.7.3 WellCurvesThe WellCurves section consists of two parts, the WellCurve Header section and the WellCurve Internal Data section. The header section defines the format of the Well Curves. The WellCurve data can be given in the same file, or in an external binary or ascii file.External Binary Data DeclarationIf the WellCurve data are stored in an external binary file, you must provide the name of the file, before any WellCurve Header information, using the following statement:BINARY_DATA_FILE filenameThe above statement gives the name of the binary file in which Well Curves are stored as a series of Z (measured depth) values and data values:P1Z1, P1Z2,...,P1Z20, P1V1, P1V2,...P1V20, P2Z1, P2Z2,...,P2Z12, P2V1, P2V2,..., P2V12, P3Z1,...etc.External ASCII Data DeclarationIf the data are stored in an external ASCII file, you must provide the following information before any WellCurve Header information:ASCII_DATA_FILE filenameDEPTH_COLUMN indexNCOLUMNS ncolNROWS nrowThe data are read in as a matrix of floating-point numbers and records are separated by blanks. The dimension of the matrix is defined by NCOLUMN and NROWs.Each column is a Property and NROWS specifies the number of data points per Property. The DEPTH_COLUMN specifies which column contains the measured depth data, which also means that in the external ASCII format, different Properties must all have data values at the same measured depth point.For example, the following file, named AsciiExample.wl.dat,P1V1 P2V1 P3V1 Z1 P4V1P1V2 P2V2 P3V2 Z2 P4V2P1V3 P2V3 P3V3 Z3 P4V3.....P1200 P2V200 P3V200 Z200 P4V200should be specified asASCII_DATA_FILE AsciiExampleDEPTH_COLUMN 4NCOLUMNS 5NROWS 200WellCurve HeaderEach WellCurve is defined inside a block beginning with WELL_CURVE and ending with END_CURVE. The format of the header is:NPTS nptsThis information will be used to read npts z values and npts data values from the binary file starting at Byte position seekpos. See Well with an External Binary Data File Example.A.7.4 Single Well File ExampleThe first example is a well file that includes the WellCurve data:A.7.5 Well with an External Binary Data File ExampleThe second example is a well with the WellCurve data stored in the external binary file described in External Binary Data Declaration:A.7.6 Well with an External ASCII Data File ExampleThe third example is a well with the WellCurve data stored in the external ASCII file described in External Binary Data Declaration:A.8 Grid3d or VoxetA Voxet is a rigid 3D Grid Object; it can carry multiple Properties. A Property in a Voxet is often referred to as a grid3d. It is derived from the Object Class.A common confusion comes from not realizing that UVW can mean the (i,j,k) indexing of the Voxet Nodes, but it can also mean the coordinate system in which the Voxet resides.In addition to its inherited Object file elements, a Voxet is further defined in two parts: the header section, which defines the geometry, and the grid3d sections which defines the Properties (grid3ds) and the Region section (which gives Region storage and Region information). Each Property in the Voxet has its own grid3d section that defines the Property and Property values.A.8.1 Geometry SectionUVW Coordinate System and Voxet DimensionAXIS_V, AXIS_W are required definitions. They define the coordinate system of the Voxet: represents the origin of the Voxet coordinate system, not the Voxet the origin.).For example, in Seismic AXIS_U represents typically the time or depth axis. An example will be: AXIS_U 0. 0.0004 (in A common confusion comes from not realizing that this set of vectors, AXES_OUVW, only defines the UVW coordinateThe upper two are the most common cases; i.e. the AXES UVW either define the entire volume dimension or they define a cell dimension. When GOCAD outputs a Voxet file, it uses the upper most format; i.e. the UVW axes define the entire volume.REGION region_name region_bit_marker_position_number (must be less than number_of_bits) An example of an Voxet ASCII file with Region information is given below:....AXIS_N 10 10 10FLAGS_ARRAY_LENGTH 1000FLAGS_BIT_LENGTH 10FLAGS_ESIZE 2FLAGS_OFFSET 0FLAGS_FILE v1__flags@@REGION RegionExample 6REGION HighPorosity 7REGION LowPerm 8REGION BadBuy 9ENDA.8.3 Grid3d/Property SectionThe grid3d section defines the property. Currently, Region information must be given before Property information.For each property there is a unique identifier, id, which is used to relate different Property statements to the same Property. The data can be in an external file in a binary format, or inside the file in ascii format.For each Property, the declaration must be the first line (PROPERTY id "property name") and the Property file name (PROP_FILE id filename) or data (DATA) must be the last line.PROPERTY id "property name"PROPERTY_CLASS id "property-class_name"PROP_UNIT id "unit"PROP_LEGAL_RANGE id min max (where min/max is a float or **none**PROP_SAMPLE_STATS id n x x2 min maxPROP_NO_DATA_VALUE id valuePROP_SAMPLE_STATS id n x x2 min maxPROP_ETYPE id data_type (either IEEE or IBM)PROP_FORMAT id file_format (either RAW or SEGY)PROP_ESIZE id element_size (either 1 or 4)PROP_FILE id filenamePROP_OFFSET id offsetDATAPROP_OFFSET indicates that the array of float value begins at the given offset (in bytes, = number of data points x PROP_ESIZE) in the PROP_FILE.PROP_ETYPE specifies the type of floating point value that is in the file. It can be IBM floating point value or IEEE floating point value.PROP_FORMAT specifies the format of the file. SEGY format implies that the data resides in a standard SEGY file. RAW specifies that the data is formatted as a C array where the fast axis is the Axis_U.The token DATA, if present, indicates that the Property data is to be read following that token. If this is the case, the floating point array of data must be in ascii RAW format.A.8.4 ExampleAn example of a Voxet file with an external Property file:GOCAD Voxet 0.01AXIS_O 2128403. -79200. 0.AXIS_U 0. 0. 55.AXIS_V 0. 220. 0.AXIS_W 220. 0. 0.AXIS_MIN 0.0 0.0 0.0AXIS_MAX 549. 227. 149.AXIS_N 550 228 150AXIS_D 1. 1. 1.AXIS_NAME "Z" "Y" "X"AXIS_UNIT "m" "m" "m"AXIS_TYPE even even evenPROPERTY 1 "Seismic"PROP_UNIT 1 " "PROP_ESIZE 1 4PROP_ETYPE 1 IEEEPROP_FILE 1 /tmp/seismic.nohdrA.9.1 Header SectionREGION_FLAGS_ARRAY_LENGTH length_of_the _array REGION_FLAGS_BIT_LENGTH number_of_bits (at least 1greater than the number of Regions) REGION_FLAGS_ESIZE number_of_bytes (should equal (number_of_bits+1)/8rounded up) REGION_FLAGS_OFFSET offset_inside_the_binary_file_for_the_first_data_point REGION_FLAGS_FILEbinary_file_name (values in the file increase first in U, then V, then W)An example of an SGrid file with Region information is given below:AXIS_N 41 21 31.....FLAGS_FILE MySGrid__flags@@REGION Reg_top_1 0REGION Reg_1_2 1REGION Reg_2_bot 2REGION Facies_Region_1 3REGION Facies_Region_2 4REGION Facies_Region_3 5REGION Facies_Region_4 6REGION Facies_Region_5 7REGION Facies_Region_6 8REGION BM_Inactive_Region 9REGION_FLAGS_ARRAY_LENGTH 26691REGION_FLAGS_BIT_LENGTH 10REGION_FLAGS_ESIZE 2REGION_FLAGS_OFFSET 0REGION_FLAGS_FILE MySGrid__region_flags@@PROPERTY 1 "Geol_Facies_1"PROPERTY_CLASS 1 "facgm".....A.9.3 Property SectionThe Property section defines the property at each node. Currently, Region information must be given before Property information. Each Property has its unique identifier, id, which is used to relate different Property statements to that Property. The data can be in an external file in a ascii or binary format.For each Property, the declaration must be the first line (PROPERTY id "property name") and theProperty file name (PROP_FILE id filename) or data (DATA) must be the last line.The definitions of the Property format is identical to Voxet. Please see Grid3d/Property Section (PageA31).PROPERTY id "property name"PROPERTY_CLASS id "property_class_name"PROP_UNIT id "unit"PROP_LEGAL_RANGE id min max (where min/max is a float or none)PROP_NO_DATA_VALUE id valuePROP_SAMPLE_STATS id n x x2 min maxPROP_ETYPE id data_type (must be IEEE, IBM, or SEGY)PROP_ESIZE id element_size (either 1 or 4)PROP_FILE id filenamePROP_NO_DATA_VALUE id no_data_valuePROP_OFFSET id offsetDATAThe fast axis is Axis_U. The data are specified as a C array.If the SGrid is cell-centered the size of the point array will be NX*NY*NZ but the size of the Property arrays will be (NX-1)*(NY-1)*(NZ-1).A.9.4 Ascii External FileThe geometry and the properties can both be read from an ASCII data file. First this file must be specified in the header as follows:ASCII_DATA_FILE filenameThe format of that file is:x y z p1 p2 p3... flag u v wwhere x, y, z specifies the location of that node; p1, p2, p3,... are the Property values at that node; flag specifies the connectivity flag of that node; and u, v, w specifies the index of the node.A.9.5 Split NodesIntroductionA node is a corner of a cell that is usually shared between 8 cells except when a fault affect this area (and on theborder where less cells are available).Faulting introduces split nodes.The ascii or binary file describing the geometry contains one x,y,z location. When a grid is faulted the nodes affected by the faulting have several x,y,z ; additional x,y,z information (the first one is in the ascii or binary file describing the geometry) is stored in the SGrid header file (usually defined with the extension ?s .sg ?t). The following set of examples are linked with the following SGrid depicted in Figure10FormatHere is an example of split node description :SPLIT 59 19 3 -225.76 177.902 1407.1 36 1 0 0 0 1 0 0 0 1This corresponds to the following information :SPLIT U V W X Y Z id Cell(u,v,w) Cell(u-1,v,w) Cell(u,v-1,w) Cell(u-1,v-1,w), Cell(u,v,w-1) Cell(u-1,v,w-1) Cell(u,v-1,w-1) Cell(u-1,v-1,w-1)This split node is attached to the grid regular node U V W. The first occurrence of a split node U V W means that the regular node is split. There can be up to 7 SPLIT lines per U V W.All the Cell(u,v,w) are boolean values (0 or 1).If Cell(u-1,v-1,w) is equal to 1, then this node (SPLIT) is a corner of the Cell(u_1,v-1,w).Remark : when a node is on the external border of the grid, it does not have 8 neighbor cells. For the missing cells the boolean value is set to 1Split FaceNodes are split along faces. When a face is split, split faces can be gathered in FaceSets. A FaceSet is described as: FACET_SET name number_of_faces cell_uvw_1 face_dir_1.... cell_uvw_2 face_dir_2where cell_uvw represents the cell number (U+V*NU+W*NU*NV) and face_dir is the face indicator (U=0, V=1, W=2).A.9.6 ExamplesA.9.6.1 External Binary filesAn example of an SGrid with one Property and external binary files (lines that start with an * are optional Attribute lines):GOCAD SGrid 0.01HEADER {name:s3}AXIS_N 32 32 32PROP_ALIGNMENT CELLSPOINTS_OFFSET 0POINTS_FILE s3__points@@FLAGS_OFFSET 0FLAGS_FILE s3__flags@@PROPERTY 1 "SGS_simulation_1"PROPERTY_CLASS 1 "porndx"PROP_UNIT 1 nonePROP_SAMPLE_STATS 1 62883 0.24624 0.000661522 0 0.415PROP_ESIZE 1 4PROP_ETYPE 1 IEEEPROP_ALIGNMENT 1 CELLSPROP_OFFSET 1 0PROP_FILE 1 s3_SGS_simulation_1@@ENDA.9.6.2 External Ascii FileBelow is the header file for the SGrid with one property.GOCAD SGrid 0.01 HEADER { name:s3 *painted:on } AXIS_N 32 32 32 PROP_ALIGNMENT CELLS ASCII_DATA_FILE s3__ascii@@ PROPERTY 1 "SGS_simulation_1" PROPERTY_CLASS 1 "porndx" PROP_UNIT 1 nonePROP_SAMPLE_STATS 1 29791 0.247145 0.000618586 0.154 0.414999 PROPERTY_CLASS_HEADER 1 "porndx" {*low_clip:0.183077 *high_clip:0.311214 *pclip:99 } ENDBelow are the first lines off an ASCII external file* * X Y Z SGS_simulation_1 Flag I J K * 145745 9416230 -3458.3147 0.229000002 1031 0 0 0 145995 9416230 -3459.58105 0.229790032 1039 1 0 0 146245 9416230 -3460.82251 0.229000002 1039 2 0 0 146495 9416230 -3462.18555 0.228938624 1039 3 0 0。
- 1、下载文档前请自行甄别文档内容的完整性,平台不提供额外的编辑、内容补充、找答案等附加服务。
- 2、"仅部分预览"的文档,不可在线预览部分如存在完整性等问题,可反馈申请退款(可完整预览的文档不适用该条件!)。
- 3、如文档侵犯您的权益,请联系客服反馈,我们会尽快为您处理(人工客服工作时间:9:00-18:30)。
GOCAD地质建模Gocad是以工作流程为核心的一款地质建模软件,达到了半智能化建模的世界最高水平,具有功能强,界面友好,易学易用,并能在几乎所有平台上(Sun, SGI, PC-Linux, PC-Windows)运行的特点。
以下通过一个简单的例子,说明GOCAD地质建模的主要过程。
第一部分 GOCAD的启动1、双击桌面上的Gocad启动图标,即可启动Gocad程序。
2、选择New project建立新工程,给工程起个名字,选择路径在文件夹Project中,点击保存,打开下图:3、选择Select All,点击OK即可。
4、弹出选择工程单位窗口如下。
此处选择平面上单位是英尺(Feet),深度单位也是英尺(Feet);时间选择毫秒;深度方向选择向上为增大;z值是时间域或深度域,选择深度域(最终如下图)。
选择完后点击OK。
5、打开如下Gocad主窗口。
第二部分 GOCAD数据加载一、地震数据加载以SEGY格式为例,加载三维地震数据选择File > Import objects >Seismic Data > SEG-Y 3D as Voxet。
在Data文件夹下选择文件“tornado.sgy”,点击OK即可加载,如下图。
二、井数据加载1、井位数据加载不同的数据格式有不同的加载方法。
以普通的文本格式为例,包括井名、x坐标、y坐标、补心海拔、井深等。
(1)加载方式是:File > Import objects > Well data > (path)Locations from column-based File ,在Data\Wells文件夹中选择文件“WellPaths”,接受默认,按next两次,打开下图:(2)对问题What information do you have for the path? 选择X-Y-TVDSS-MD。
下来的两个问题各选Feet和Use a Column。
点击下一步,出现下图窗口,(3)对各个参数,用Column number后的选择对应的列(参考下图),点击OK即可加载。
2、测井曲线加载:以las格式为例,选择File > Import objects > Well data > (Logs) LAS,出现下图。
在文件夹Data\Wells中选择s到s的所有文件。
点击OK。
3、井分层数据加载:以文本格式为例,数据可以包含井名、分层名、深度以及倾角和方位角等。
选择File > Import objects > Well data > (Markers) Column-based File。
在文件夹Data\Wells 里选择文件“WellMarkers”,点击两次默认next,选择分层测量深度(yes),点击下一步。
选择有方位角和倾角,以及Dip_Azimuth(如下图),点击下一步。
如果有一个marker已经存在,选择overwrite it,点击下一步,得到下图:参考下图选择对应的列,然后点击OK,即加载完成。
第三部分 GOCAD构造建模的建立1、在主窗口左侧选择,单击右键,选择新建(New),创建一个构在建模的工作流程。
输入一个流程名字。
点击OK。
如下图,再点击Next,准备添加构造建模所需要的数据。
2、点击下一步,出现下图:依次选择深度depth;不添加断层数据,选No;添加层数据,选Yes。
出现下图:3、选择A1到B3所有层(如上图所示),点,再点击OK。
4、接下来提示是否定义工区范围,选择Yes;是否用地质层序分层,选择No。
点击Next。
7、开始定义工区范围(感兴趣区域),选择Next。
定义工作区域分两种方式:一种是默认方式,一种是高级方式。
选择高级定义方式,如下图,按Next。
定义平面工区范围,分六种方式:一是通过原点和矢量方向定义;二是用已经存在的线;三是手工画工区;四是利用地震体定义;五是利用其他数据体的的轮廓界面;六是利用数据的外部凸起边界。
选择第三种,手工画线的方式定义工区,按Next。
选择所有层数据,让其在3D显示区中显示出来,点击图标,从顶部俯视层,以便于画工区范围线。
选择Draw polygonal curve图标,鼠标在3D显示区中变成+号,用左键点击画工区范围线,点击鼠标右键结束编辑。
如果画的不是很满意,可以重画,自动删除上次画的线。
也可以编辑线和节点。
8、点击两次下一步,开始定义纵向工作范围。
再点击下一步。
将所有层数据选中显示出来,点击Set north view图标,分别点击顶底范围选择图标,鼠标变成+号,选择3D显示区中的顶底线,拖动到正确的位置即可。
或者输入适当的数值。
最后点击 Create/re-create volume of interest,定义工区范围完毕。
点击进入下一步。
9、再点下一步,回到主窗口,开始层模型的建立,如下图。
10、点击下一步。
出现如下界面,将所有层数据显示出来,点击 Build horizon surfaces 图标,建立层面,点击下一步。
可以选择质量控制和编辑数据,对错误的数据进行修改,重新再做层面。
此处请再点击下一步。
11、进入用井分层约束层面步骤:点击下一步,出现:依上图选择。
然后检查吻合程度,点击 Cumpute well marker mismatch,弹出新窗口。
输入纵向上的约束范围,超过这个范围的分层数据将不参加约束计算。
点击 Disable well markers with error more than,最后点击Close关闭窗口。
返回上个窗口点击下一步。
接下来用井分层约束层面。
点击下一步。
进入窗口:选择所有层面和井数据。
点击 Define wells area of influence 定义平面约束范围,弹出新的窗口,输入范围值,点击OK返回。
点击 Compute error map 计算偏差图。
最后点击Fit to well markers。
点下一步返回主窗口。
12、检查修改层面间的相互交叉关系。
点击下一步。
选择 Check crossings between horizons 检查,如果两层之间有交叉,前面显示红色的×号,如果没有交叉显示绿色的对号。
如果有交叉,输入两层间最小厚度值,按Remove crossings between horizons 即可去掉交叉部分。
点击下一步返回主窗口。
至此,构造模型建立完毕。
总结:构造建模流程共分以下几步:1、添加断层和层数据;2、定义工区范围;3、断层面模型建立;4、层面模型建立;5、井分层约束断层面;6、修改断层之间的接触关系;7、修改层面与断层之间的接触关系;8、用井分层约束层面;9、检查修改各层面之间的交叉关系;10、利用定义的地质层序建立中间层。
第四部分 GOCAD三维模型网格的建立1、新建三维地质模型网格流程右键点击图标,弹出下图窗口,输入新流程名,点击OK。
2、下图列出了两种建立三维地质模型网格的方法,一种是用面来建立,一种是用已经存在的二维网格来建立。
另外可以对加载进来的网格进行编辑。
最常用的是第一种。
故直接点击下一步。
3、选择顶底面,可以设置网格方向和网格化范围,如下图设置后,点击下一步。
4、开始设置网格:点击下一步。
设置网格有三种方式:自动、交互式、用已经建立好的。
此处选择交互式的,并点击下一步。
定义顶面,下一步。
首先选择自动计算图标,如果有不满意的地方,可以修改、添加、删除断层断过层面的轨迹线及其端点。
下一步。
同设置顶面一样设置底面,首先选择自动计算图标,修改满意后点击下一步。
设置顶底面之间的连接:点击自动计算图标,有不满意的地方可以选择其他键修改。
点击删除图标,在3D显示区点击连接线,可以删掉单个连接线。
选择添加图标,在3D显示区中点击顶面边界,再点击底面边界,就建立了一个新的连接。
满意后点下一步。
5、设置平面网格方向,有三种方式:一种是平行于X、Y方向;一种是平行外边界;另一种是定义矢量方向(可以直接输入一个角度值或用鼠标点击箭头,在3D区中画一个矢量方向)。
选择第一种,点击图标,点击下一步。
让网格线依照层走向分布,点击自动分布网格走向。
或者选择其他图标修改网格分布。
点击下一步。
6、点击 Initialize Pillars 图标,自动初始化两层之间的连接线。
点击下一步。
接下来是定义中间层,跳过这一步,直接创建网格即可。
点下一步。
7、定义纵方向上层与层之间的网格数,输入适当的值,点击下一步。
定义平面方向上的网格数,输入I、J方向上不同的网格数,点击 Create Grid 图标,建立三维地质网格,点击下一步结束。
总结:三维地质模型网格流程共分以下几步:1、选择顶底面,分别设置顶、底面;2、设置顶底面之间的连接;3、设置平面网格方向;4、设置纵向上网格方向;5、创建中间层单元(可选);6、定义纵向上网格数;7、定义平面上网格数;8、创建三维地质模型网格。
第五部分 GOCAD储层属性模型的建立1、建立属性建模流程鼠标右键点击图标,弹出新窗口,输入流程名字,点击OK。
2、下面的窗口是属性建模操作的主窗口,在Reservoir Grid/Voxet中选择已经建立好的三维地质模型网格,在Number of Prorerties中输入准备做属性建模的属性数量,此处输入3。
然后分别添加属性名和类型。
例如,上图添加的是相(Facies),类型是离散属性(Categorical);孔隙度(Porosity),类型是连续属性(Continuous);渗透率(Permeability),类型是连续属性。
如果添加错误,可以删除,移动等等。
点击下一步。
进入相模型建立。
3、相模型建立。
(1)是否添加条件数据,选择是;(2)是否已经添加到网格体中去,选择否;(3)选择数据源,选择所有井数据;(4)选择数据区域,选择Everywhere;(5)选择建模属性;(6)是否要添加到附近的网格,选择是;(7)选择赋值到网格体的方法(一种是最近原则,一种是最大比例,一种是随机);(8)是否在网格中创建数据井点区域,选择否(也可以建立)。
下一步。
选择模拟区域(Everywhere)。
下一步。
(1)选择建模方法(常值,计算程序,插值,随机模拟);选随机模拟;(2)选择是否基于地质目标模拟;选择否;(3)选择模拟方法:序贯指示模拟、截断高斯模拟(对嵌套地质现象);(4)是否添加第二套约束数据。
如果有,以后会提示添加。
选择否。
点击下一步,出现下图。
点击图标,新建岩相分类列表。
弹出新窗口,选择Classificatuion > New,建立新列表。
点击新建立的列表名,可以修改名字。
点击插入图标,插入多个相类型。