PDF异质性的检验和处理
造血干细胞的异质性

造血干细胞是一类具有自我更新和多向分化潜能的细胞。
越来越多的证据表明,从细胞增殖、分化、自我更新及寿命等多个角度来看,HSC是一个具有异质性特征的细胞群体。
HSC异质性的存在增加了我们了解HSC功能及其在疾病中作用的难度。
因此,本文讲述HSC异质性的特征、检测方法与技术、与疾病发生的关系和在治疗中的应用。
一、HSC异质性1.HSC表型异质性:HSC表型异质性主要表现在其纯化方案的局限性与非特异性。
自20世纪50年代FORD等发现移植的供体骨髓在致死剂量照射的受体上具有重要的造血重建作用起,骨髓HSC的活性和功能开始受到广泛关注。
20世纪80年代,Spangrude等根据细胞表面标志表达,利用荧光激活细胞分选(FACS)技术,首次从小鼠骨髓中富集得到HSC(Thy-1loLin-Sca-l+)。
此后,其他实验室也开始用不同的表面标志组合对HSC的纯化方法进行改良和优化。
Okada等于1992年提出经典的c-Kit+Sca-1+Lin-(KSL)富集HSC的方案,KSL细胞约占全骨髓有核细胞的0.1%。
至此,HSC已可被相对富集。
但通过移植实验发现,在该群体中具有自我更新能力的长周期HSC(LT-HSC)仅占20%,仍是一个非常异质性的群体,其中包括多能祖细胞(multipotent progenitor,MPP)、短周期HSC(ST-HSC)和LT-HSC。
因此,研究人员不断增添一些附加标志以排除分化的祖细胞,降低HSC异质性。
Morrison和Weissman于1994年在KSL的基础上附加Thy1.1阴性表达,该标志在B6背景小鼠品系骨髓HSC上多不表达,即用KSL Thy1.1-(KTSL)组合纯化小鼠HSC。
接着,Krause等提出附加CD34-表达纯化小鼠HSC,即KSL CD34-;2001年Christensen和Weissman又在之前的组合上附加了Flk-2-表达,即KSL Thy1.1loFlk-2-。
Meta分析中的异质性评价、敏感性分析和发表偏倚及漏斗图不对称性检测

Meta分析中的异质性评价What is heterogeneity? Variation or differences•Meta分析中异质性分类三类•Clinical•Methodological•StatisticalClinical diversity•participants•e.g. condition, age, gender, location, study eligibility criteria •interventions•intensity/dose, duration, delivery, additional components,experience of practitioners, control (placebo, none,standard care)•outcomes•follow‐up duration, ways of measuring, definition of anevent, cut‐off pointsMethodological diversity•design•e.g. randomised vs non‐randomised, crossover vs parallel,individual vs cluster randomised•conduct•e.g. risk of bias (allocation concealment, blinding, etc.),approach to analysisStatistical heterogeneity•there will always be some random (sampling) variation between the results of different studies •heterogeneity is variation between the effects beingevaluated in the different studies•caused by clinical and methodological diversity•alternative to homogeneity (identical true effects underlyingevery study)•study results will be more different from each other than ifrandom variation is the only reason for the differencesbetween the estimated intervention effectsHow to detect the heterogeneity?I 2统计量I 2统计量是描述由研究间变异占总变异的百分比,计算公式为:⎪⎩⎪⎨⎧≤>-=dfQ df Q Qdf Q I 如果如果02其中,Q 为I 2统计量,df 是它的自由度(即研究总数-1)‐Fixed‐effect vs.random‐effects•Two models for meta‐analysis available in RevMan& Stata software•Make different assumptions about heterogeneity •Pre‐specify your planned approach in your protocolFixed ‐effect model•Assumes all studies are measuring the same treatment effect•Estimates that one effect •If not for random (sampling) error, all results would be identicalCommon Random (sampling)errortrue effectStudy resultSource: Julian HigginsRandom ‐effects model•Assumes the treatment effect varies between studies•Estimates the mean of the distribution of effects •Weighted for both within ‐study (SE) and between ‐study variation (tau 2, 2)Random errorStudy-specific effectMean of true effectsSource: Julian HigginsNo heterogeneityAdapted from Ohlsson A, Aher SM. Early erythropoietin for preventing red blood cell transfusion in preterm and/or low birth weight infants. Cochrane Database of Systematic Reviews 2006, Issue 3.FixedRandomSome heterogeneityFixed RandomAdapted from Adams CE, Awad G, Rathbone J, Thornley B. Chlorpromazine versusplacebo for schizophrenia. Cochrane Database of Systematic Reviews2007, Issue 2.Small study effectsFixed RandomAdapted from Li J, Zhang Q, Zhang M, Egger M. Intravenous magnesium for acutemyocardial infarction. Cochrane Database of Systematic Reviews 2007, Issue 2.Which to choose?•Plan your approach at the protocol stage•Do you expect your results to be very diverse?•Consider the underlying assumptions of the model •fixed‐effects•may be unrealistic –ignores heterogeneity•random‐effects•allows for heterogeneity•estimate of distribution of studies may not be accurate if biasesare present, few studies or few eventsIdentifying heterogeneity•Visual inspection of the forest plots •chi‐squared (c2) test (Q test)•I2statistic to quantify heterogeneityVisual inspectionForest plot A Forest plot BThe chi‐squared (c2) test•Tests the null hypothesis of homogeneity•low power with few studies•may detect clinically unimportant differences with manystudies•narrow question (yes/no) not useful if heterogeneity isinevitable•Calculated automatically by RevManThe I2statistic•I2statistic describes the percentage of variability due to heterogeneity rather than chance(0% to 100%)•low values indicate no, or little, heterogeneity•high values indicate a lot of heterogeneity •Calculated automatically by RevMan•Be cautious in interpretingThe I2statisticchi2= 29.55 df= 13 P = 0.0055 chi2= 6.14 df= 3 P = 0.11I2= 56% I2= 51%Source: Julian HigginsWhat to do about heterogeneity •check that the data are correct•consider in your interpretation•especially if the direction of effect varies•if heterogeneity is very high•interpret fixed‐effect results with caution•consider sensitivity analysis –would random‐effects have made animportant difference?•may choose not to meta‐analyse•average result may be meaningless in practice•consider clinical & methodological comparability of studies •avoid•changing your effect measure or analysis model•excluding outlying studies•explore heterogeneityExploring your results•what factors appear to modify the effect?•clinical diversity (population, interventions, outcomes)•methodological diversity (study design, risk of bias)•plan your strategy in your protocol•identify a limited number of important factors to investigate •have a scientific rationale for each factor chosen•declare any post‐hoc investigationsTwo methods available•subgroup analysis•Group studies by pre‐specified factors•look for differences in results and heterogeneity•meta‐regression•examine interaction with categorical and continuous variables •not available in RevManProceed with caution•results are observational, not randomised•be wary of multiple and post hoc comparisons •may not be useful with few studies•may not be able to investigate aggregate data •look for confounding factors•follow the plan specified in the protocol without over‐emphasising particular findingsResults are rarely definitiveInterpreting subgroup analyses•look at results and heterogeneity within subgroups •are the subgroups genuinely different?•if only 2 subgroups –do the confidence intervals overlap?•statistical tests for subgroup difference•can be more confident about:•pre‐specified analyses•within‐study analyses•effect is clinically plausible and supported by indirect evidence •effect is clinically important and will alter recommendationsParticipant subgroupsBased on Stead LF, Perera R, Bullen C, Mant D, Lancaster T. Nicotine replacement therapy for smoking cessation. Cochrane Database of Systematic Reviews 2008, Issue 1. Art. No.: CD000146. DOI: 10.1002/14651858.CD000146.pub3.Intervention subgroupsSensitivity analysis•not the same as subgroup analysis•testing the impact of decisions made during the review •inclusion of studies in the review•definition of low risk of bias•choice of effect measure•assumptions about missing data•cut‐off points for dichotomised ordinal scales•correlation coefficients•repeat analysis using an alternative method orassumption•don’t present multiple forest plots –just report the results•if difference is minimal, can be more confident of conclusions •if difference is large, interpret results with cautionWhat to include in your protocol •Assessment of heterogeneity•assessment of comparability of studies before meta‐analysis •visual inspection and use of statistics such as I2•Data synthesis•fixed‐effect or random‐effects model (or both)•Subgroup analyses and investigation of heterogeneity •planned subgroup analyses•any other strategies for investigating heterogeneityTake home message•statistical heterogeneity is the presence of differencesbetween estimated intervention effects greater than expected because of random (sampling) variation alone•it can be caused by clinical and methodological diversity•fixed and random‐effects models make different assumptions about heterogeneity•explore any heterogeneity you findStata进行异质性评价Stata进行异质性评价•图示法•拉贝图(labbe)•Galbraith星状图(galbr)•定量判断•亚组分析•Meta回归(metareg)•hetredL’Abbe图•拉贝图是以每项研究中的干预组事件发生率相对于对照组事件发生率作图,若研究间同质,则所有点呈直线分布,或者说不能偏离效应线太远•具有主观性,偏离多远算远?•以例5_数据为例•首先执行metan命令,计算合并效应量metan ntdeath ntalive ncdeath ncalive, label(namevar=study, yearvar=year) random or nograph•绘制拉贝图labbe ntdeath ntalive ncdeath ncalive, percent null or(0.851)Galbraith星状图•Galbraith星状图是以标准化估计值(如logor/lnrr)相对于其标准误的倒数作图,若散点斜率较为接近则说明研究间同质•主观性较大•以例5_数据为例•首先执行metan命令,计算合并效应量,生成中间变量_ES, _selogESmetan ntdeath ntalive ncdeath ncalive, label(namevar=study, yearvar=year) random or nograph•计算logor,selogorgen logor=log(_ES)gen selogor=_selogES•绘制Galbraith星状图galbr logor selogorStata实现亚组分析•亚组分析是探索异质性来源的一个重要方法•如何确定亚组?需要从专业角度寻找•应避免过度的亚组分析•合理的亚组分析应该在研究的设计阶段就确定,写在研究方案中•以例6_数据为例命令语句•metan a b c d, label(namevar=authors, yearvar=year) by(lati_grp)random rr counts group1(experiment)group2(control) xlabel(0.03,1,5) force texts(140) boxsca(60)结果。
Meta分析中的异质性检验方法

抗原
角蛋白 角蛋白 角蛋白 其他 其他 其他 角蛋白 其他 其他
分层因素
分层情况
文献 (篇)
Q 检验
Q值
P
I 2 ( %)
H (95 %CI)
OR (95 %CI) 3 3
≤50 月
4
71325
01062
591044
11563 (21708~01902)
51732 (41264~71705)
随访时间 3
Chinese Journal of Healt h Statistics ,Dec 2006 ,Vol. 23 ,No . 6
·487 ·
~11459) ,统计量 I2 = 751579 % 。对随访时间 、研究 541901 % ;研究年份在 1995 年以前的研究异质性 Q 年份 、染色技术和抗原等可能影响异质性因素分层后 检验 无 统 计 学 意 义 , P > 0105 , H 为 11452 , I2 为 进行异质性检验 , 结果如表 2 所示 。随访时间分层后 521584 % ;染色技术分层中 ,其他 (非 AP 法) 的层内异 层内研究间异质性 Q 检验无统计学意义 , P > 0105 , 质性 Q 检验无统计学意义 P > 0105 , H 为 11185 , I2 H 分 别 为 11563 ( 95 % CI : 21708 ~ 01902 ) 和 11489 为 281741 % , 其他各层内异质性 Q 检验均有统计学 (95 % CI : 21588 ~ 01857 ) , I2 分 别 为 591044 % 和 意义 , P < 0105 ,且有 H > 115 , I2 > 56 % 。
I2
循证医学试题及答案大全01
循证医学试题及标准答案一选择题1、循证医学又称实证医学,即以证据为基础的临床医学,它的思想原理起源于()中叶.A.17世纪B.18世纪C.19世纪D.20世纪E.21世纪2、循证医学的()是要求任何医疗措施的实施都应建立在最新、最好的医学科学研究信息的基础上。
A.基础B.理论C.要点D.目的E.核心3、()是指在疾病的诊治过程中,将个人的临床经验与现有的最好临床科学证据(current best evidence)相结合,同时考虑病人的价值观,最后为每个病员作出最佳诊治决策。
A、循证医学B、实验医学C、现代医学D、基础医学E、临床医学4、个人的临床经验是指临床医生通过临床实践获得的处理临床问题的熟练能力和判断能力,也就是说临床医生应具备通过()的临床表现来发现临床问题的能力。
A、证据B、随机对照实验C、医生D、护士E、病员5、循证医学显示了现代医学的进展,不仅有利于临床医学由经验型向科学型的转变,还将在医疗卫生领域引入人性化服务。
传统医学是以经验为主,即根据医师的(医学全在线、()或()原理来处理病人。
A、经验B、实验C、直觉D、大家的讨论结果E、病理生理答案:1、C2、E3、A4、E5、ACE二、名词解释1、循证医学:是遵循科学证据的医学,指的是临床医生在获得患者准确的临床依据的前提下,根据自己的临床经验和知识技能,分析并抓住患者的主要临床问题(诊断、治疗、雨后、康复等),应用最佳的和最新的科学证据,做出科学的诊治决策,联系具体的医疗环境,并取得患者的合作和接受,以实践这种诊治决策的具体医疗过程。
2、成本-效益分析:将不同的结果换算成流通货币的形式,用货币量作为共同的获利单位进行比较。
3、效用:即用社会效益和个人主观满意度来测量和评价健康效果。
4、药物不良反应:在预防、诊断、治疗疾病或调节生理机能过程中,人接受正常剂量的药物时出现的任何有害的和用药目的无关的反应。
5、证据:主要是指经过试验所得出的结论。
有关stata操作
有关stata操作先是实验组存活,实验组死亡。
然后是对照组。
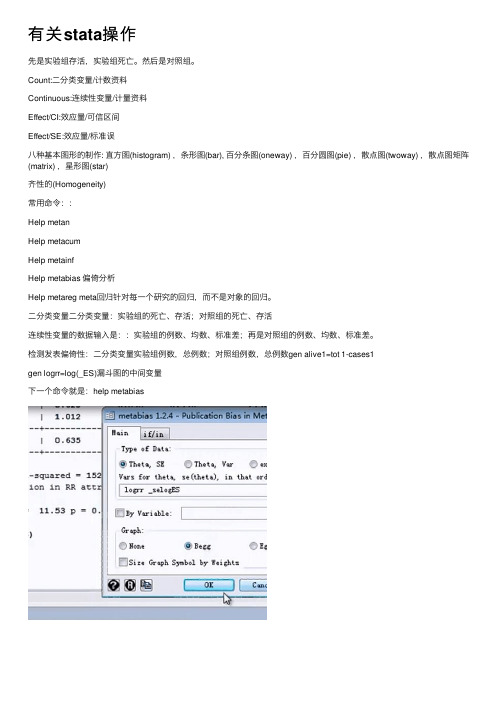
Count:⼆分类变量/计数资料Continuous:连续性变量/计量资料Effect/CI:效应量/可信区间Effect/SE:效应量/标准误⼋种基本图形的制作: 直⽅图(histogram) ,条形图(bar), 百分条图(oneway) ,百分圆图(pie) ,散点图(twoway) ,散点图矩阵(matrix) ,星形图(star)齐性的(Homogeneity)常⽤命令::Help metanHelp metacumHelp metainfHelp metabias 偏倚分析Help metareg meta回归针对每⼀个研究的回归,⽽不是对象的回归。
⼆分类变量⼆分类变量:实验组的死亡、存活;对照组的死亡、存活连续性变量的数据输⼊是::实验组的例数、均数、标准差;再是对照组的例数、均数、标准差。
检测发表偏倚性:⼆分类变量实验组例数,总例数;对照组例数,总例数gen alive1=tot 1-cases1gen logrr=log(_ES)漏⽃图的中间变量下⼀个命令就是:help metabias连续性变量:::异质性的来源:则量指标的⽅法不同;种族、国籍等,更应该从专业⾓度分析meta回归、亚组分析重要的问题:能够改变治疗策略的问题。
勤于思考Meta统计分析可以分为确定性模型分析⽅法和随机模型分析⽅法。
较常⽤的确定性模型Meta分析有Mantel-Haeszel统计⽅法(仅适⽤于效应指标为OR)和General-Variance-Based统计⽅法。
然⽽所有的确定性模型统计⽅法都要求Meta分析中的各个研究的总体效应指标(如:两组均数的差值等)是相等的,并称为齐性的(Homogeneity),⽽随机模型对效应指标没有齐性要求。
因此Meta分析可以采⽤下列分析策略:1)如果各个研究的效应指标是齐性的,则选⽤确定性模型统计⽅法:OR,则采⽤Mantel-Haeszel统计⽅法新市场营销法则助推企业成长电⼦商务营销⾷品餐饮营销建筑房产营销消费品营销确定性模型进⾏解释的,则采⽤随机模型进⾏Meta统计分析。
PDF异质性的检验和处理
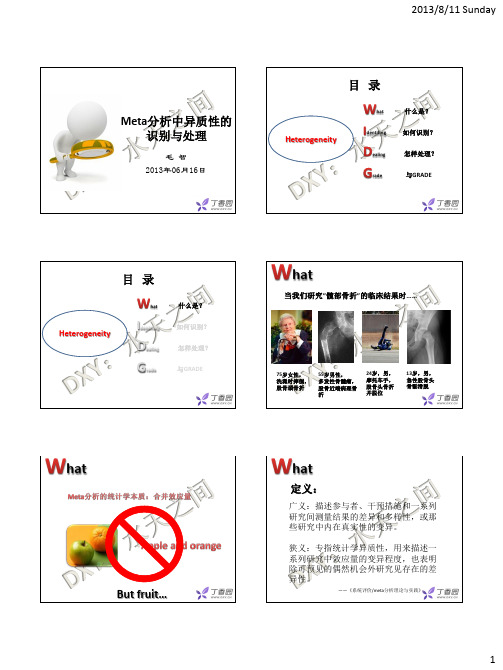
2013/8/11 Sunday
hat
临床异质性(clinical heterogeneity):
试验对象的差异:纳入及排除标准; 干预方式差异:内置物不同,用药剂量; 结局指标差异:测量工具不同;
hat
方法学异质性(clinical heterogeneity):
研究设计的差异:前瞻性,回顾性,随机化; 偏倚风险:分配隐藏,盲法等; 结局完整性:随访时间等;
ealing
4. 探索异质性来源敏感性分析:方法
改变研究的纳入标准、研究对象、干预措施或终点指标 纳入或排除某些含糊不清的研究 使用某些结果不太确定的研究估计值重新分析数据 对缺失数据合理分析后重新分析数据 使用不同统计方法重新分析数据 提出治疗较差的研究后再meta分析看结果稳定程度
按不同研究特征如统计方法、研究质量、样本量是否包括未发表研究等进行分层
dentifing
统计量法之二:I2检验
2013/8/11 Sunday
dentifing
统计量法之一:Q检验
Q检验的缺陷: 1、对研究个数敏感
研究个数少——检验效能低——假阴性 研究个数多——检验效能高——假阳性 故检验水准常定为α=0.10 2、只能检验是否存在异质性,而不能检验异质性的分布。
dentifing
《系统评价/meta分析理论与实践》
6
2013/8/11 Sunday
ealing
3. 探索异质性来源之meta回归:
软件实现:
• Stata软件:“metareg”宏命令; • R软件:metafor程序包中的“rma”; • Comprehensive Meta Analysis V2、Meta-Disc1.4、
Meta分析中的异质性及其处理方法

© 2009 中国循证医学杂志编辑部 C JEBMMeta分析中的异质性及其处理方法王 丹1翟俊霞2牟振云3,*宗红侠1赵晓东2王学义4顾 平51. 河北医科大学图书馆(石家庄 050017);2. 河北省医学情报研究所(石家庄 050021);3. 河北医科大学公共卫生学院流行病与卫生统计教研室(石家庄 050017);4. 河北医科大学第一医院精神卫生研究所(石家庄 050031);5.河北医科大学第一医院神经内科(石家庄 050031)摘要介绍Meta分析中异质性研究,包括Meta分析中异质性的定义,并将异质性分为临床异质性、方法学异质性、统计学异质性三类,介绍减少纳入临床异质性和方法学异质性研究的措施,统计学异质性的五种检验方法(Q统计量、I2统计量、H统计量、Galbraith图法、L’Abbe图)、实例分析及适用情况。
根据异质性的有无将Meta分析分为探索型Meta分析和分析型Meta分析,存在异质性时可采取的措施及其流程图。
关键词 Meta分析;异质性;分类;检验方法;措施Discussing on the Research of Heterogeneity in Meta-analysisWANG Dan1, ZHAI Jun-xia2, MOU Zhen-yun3,*, ZONG Hong-xia1, ZHAO Xiao-dong2, WANG Xue-yi4, Gu Ping51. Library of Hebei Medical University, Shijiazhuang 050017, China;2. Hebei Institute of Medical Information, Shijiazhuang 050021, China;3. Department of Epidemiology and Health Statistics, School of Public Health, Hebei Medical University, Shijiazhuang 050017, China;4. Mental Health Center, The First Hospital, Hebei Medical University, Shijiazhuang 050031, China;5. Department of Neurology, The First Hospital, Hebei Medical University, Shijiazhuang 050031, ChinaAbstract This paper is to discuss the research of heterogeneity in Meta-analysis, including the defi nition of the heterogeneity in Meta-analysis and classifi cation it into clinical heterogeneity, methodological heterogeneity and statistical heterogeneity, the strategies for diminishing clinical heterogeneity and methodological heterogeneity, the fi ve testing methods in statistical heterogeneity (Q statistic, I2 statistic, H statistic, Galbraith plot and L’Abbe plot) and the examplesand applying conditions of the fi ve testing methods, classifi cation of meta-analysis into exploratory meta-analysis andanalytic meta-analysis according if the meta-analysis has heterogeneity, and the strategies and the fl owchart when existingthe heterogeneity in meta-analysis.Key words Meta-analysis; Heterogeneity; Classifi cation; Testing methods; Strategies基金项目:河北省2007年医学科学研究重点课题计划指令性课题(07025)。
线粒体DNA异质性研究进展及其法医学应用
线粒体DNA异质性研究进展及其法医学应用发布时间:2022-02-14T07:57:15.021Z 来源:《中国医学人文》(学术版)2021年11月11期作者:王泊文[导读] 线粒体DNA(mitochondria DNA, mtDNA)作为人类第二套基因组DNA,具有母系遗传、拷贝数多、突变率高等特点。
同一个细胞、组织或个体发现存在两种及以上不同的线粒体DNA序列时,称之为异质性,这一现象的存在使线粒体DNA在法医学的应用趋于复杂。
本文综述了线粒体DNA的特点、异质性的组织特异性及检测方法,并探讨了异质性在法医学中的应用价值。
许昌莲城司法鉴定所河南许昌 461000【摘要】线粒体DNA(mitochondria DNA, mtDNA)作为人类第二套基因组DNA,具有母系遗传、拷贝数多、突变率高等特点。
同一个细胞、组织或个体发现存在两种及以上不同的线粒体DNA序列时,称之为异质性,这一现象的存在使线粒体DNA在法医学的应用趋于复杂。
本文综述了线粒体DNA的特点、异质性的组织特异性及检测方法,并探讨了异质性在法医学中的应用价值。
一、人类mtDNA的特点及法医学应用价值人类mtDNA位于细胞质中,是一套独立于核染色体之外的完整的遗传物质,作为真核细胞内的重要细胞器,能量生成的场所,参与了脂肪酸及某些蛋白质的合成。
1981年,安德森等人在英国剑桥桑格实验室完成了线粒体的全序列测定,称为安德森序列(Anderson sequence);之后改进后称为剑桥参考序列(Cambridge Reference Sequence,rCRS)。
mtDNA呈闭环双链结构,其全长包含16,569 bp,序列可分为编码区和非编码区两个部分。
其中,编码区较为保守,共包含37个基因,分别是2个rRNA基因,22个tRNA基因和13个蛋白质编码基因;非编码区(也叫控制区)既是mtDNA转录和复制的起点,又是突变发生的热点,其中D环区及复制起始点附近的多态性较高,即常见的高变区Ⅰ、Ⅱ和Ⅲ(HV-Ⅰ、HV-Ⅱ和HV-Ⅲ)。
- 1、下载文档前请自行甄别文档内容的完整性,平台不提供额外的编辑、内容补充、找答案等附加服务。
- 2、"仅部分预览"的文档,不可在线预览部分如存在完整性等问题,可反馈申请退款(可完整预览的文档不适用该条件!)。
- 3、如文档侵犯您的权益,请联系客服反馈,我们会尽快为您处理(人工客服工作时间:9:00-18:30)。
2013/8/11 Sunday
ealing
2. 探索异质性来源之亚组分析:
分亚组方法:可按不同年龄、性别、病情严重程度、 设计方案、参加人群特征、治疗时间、随访时间等分 成亚组,进行亚组分析。
ealing
2. 探索异质性来源之亚组分析:
如:按照不同患者类型分亚组:
ealing
2. 探索异质性来源之亚组分析:
2013/8/11 Sunday
hat
临床异质性(clinical heterogeneity):
试验对象的差异:纳入及排除标准; 干预方式差异:内置物不同,用药剂量; 结局指标差异:测量工具不同;
hat
方法学异质性(clinical heterogeneity):
研究设计的差异:前瞻性,回顾性,随机化; 偏倚风险:分配隐藏,盲法等; 结局完整性:随访时间等;
《系统评价/meta分析理论与实践》
6
2013/8/11 Sunday
ealing
3. 探索异质性来源之meta回归:
软件实现:
• Stata软件:“metareg”宏命令; • R软件:metafor程序包中的“rma”; • Comprehensive Meta Analysis V2、Meta-Disc1.4、
ealing
4. 探索异质性来源敏感性分析:举例:
Gu WJ, Chest. 2012 Oct;142(4):859-68
ealing
4. 探索异质性来源敏感性分析:
注意: • 去除统计学有异质性的研究进行敏感
性分析时可能会缺失有价值的信息而 造成偏倚。 • 因此敏感性分析用于判断结果的稳定 性,而不是得出新的结论。
《系统评价/meta分析理论与实践》
ealing
异质性检验:Q检验 or I2检验
异质性
固定效应模型
异质性原因
亚组分析
Meta回归/敏感性分析
随机效应模型
目录
Heterogeneity
What
Identifing Dealing
rade
什么是? 如何识别? 怎样处理? 与GRADE
8
2013/8/11 Sunday
回答:真实效应的最准确估计是什么?
《系统评价/meta分析理论与实践》
ealing
6. 合并异质性——随机效应模型:
要点:随机效应模型假定个独立研究分别来自不同 的总体,不同研究中处理因素不一定产生相同的效 应,其研究结果的差异可由研究内变异(随机抽样) 和研究间差异(总体不同)而造成。
当异质性来源不能用临床异质性和方法学异质性来 解释是,常可用随机效应模型合并效应量。
ealing
4. 探索异质性来源敏感性分析:方法
改变研究的纳入标准、研究对象、干预措施或终点指标 纳入或排除某些含糊不清的研究 使用某些结果不太确定的研究估计值重新分析数据 对缺失数据合理分析后重新分析数据 使用不同统计方法重新分析数据 提出治疗较差的研究后再meta分析看结果稳定程度
按不同研究特征如统计方法、研究质量、样本量是否包括未发表研究等进行分层
dentifing
图示法之一:森林图
3
2013/8/11 Sunday
dentifing
图示法之二:拉贝图(L‘abbe plot)
dentifing
图示法之三:加尔布雷斯图 (Galbraith plot)
王丹,等,Meta分析中异质性极其处理方法,中国循证医学杂志,2009,9(10):1115-1118
GRADE
GRADE中的异质性
点估计一致,异质性检验显示无显著性异质性
不降级
GRADE
GRADE中的异质性
异质性强,结果方向的相反
降级
GRADE
GRADE中的异质性
GRADE
GRADE中的异质性
异质性存在,置信区间重叠较小, 并无法用研究设计、纳入人群差异、 干预方式、及随访时间来解释。
降级
异质性存在,并无法用研究设计、纳入 人群差异、干预方式、及随访时间来解 释。 除1个研究外,所有研究都有利于治疗组。 这种情况的不一致性是否引起降级需要 判断。
hat
概念要点:
异质性用来表示各个研究间随机误差 以外的差异性;
当显著异质性存在时候,对合成结果 的解释是有问题的。
目录
What
Heterogeneity
dentifing
Dealing Grade
什么是? 如何识别? 怎样处理?
与GRADE
dentifing
异质性的识别方法:
Q检验
统计量法
《系统评价/meta分析理论与实践》
ealing
3. 探索异质性来源之meta回归:
《系统评价/meta分析理论与实践》
ealing
3. 探索异质性来源之meta回归:
Meta回归的局限性: 观察性研究-协变量不能表示个体真实水平-聚合偏倚
数据挖掘—假阳性结果 不可能充分解释所有异质性——异质性剩余
GRADE
GRADE中的异质性
(Grades of Recommendation, Assessment, Development, and Evaluation)
GRADE
GRADE中的异质性
Inconsistency refers to an unexplained heterogeneity of results.
ealing
3. 探索异质性来源之meta回归:
《系统评价/meta分析理论与实践》
2013/8/11 Sunday
ealing
3. 探索异质性来源之meta回归:
Meta回归:Meta回归(Meta-regression)是通过建 立回归方程,来反应1个或多个解释变量 (explanatory variable)与结果变量(outcome variable)之间的关系,以试图明确各研究间异质 性的来源,从而筛选出导致异质性的重要影响因素。 一般认为,meta回归为亚组分析的扩大,主要 通过对多因素的效应量进行联合分析实现, 仅当纳入研究数量达到10个以上时才进行此 分析
《系统评价/meta分析理论与实践》
7
2013/8/11 Sunday
ealing
5. 忽略异质性——固定效应模型:
要点:固定效应模型meta分析中所有观察到的变异 都是由偶然机会引起的一种合并效应量的计算模型, 假定测量相同的总体效应。
当一致性检验无显著性差异时,适用于各独立研究 间无差异活差异较小的情况。
dentifing
统计量法之二:I2检验
2013/8/11 Sunday
dentifing
统计量法之一:Q检验
Q检验的缺陷: 1、对研究个数敏感
研究个数少——检验效能低——假阴性 研究个数多——检验效能高——假阳性 故检验水准常定为α=0.10 2、只能检验是否存在异质性,而不能检验异质性的分布。
dentifing
通过对统计量Q进行自由度(文献数)的校正,结果方差分布的参数估 计可得:
H
H值为1表示个研究间无异质性; H>1.5则提示研究间存在异质性; H<1.2则认研究同质; H为1.2-1.5之间,当H值95%置信区间包含1,在
α=0.05的检验水准下无法确定是否存在异质性,若 不包含1,则可认为存在异质性。
David, et al. J Orthop Trauma. 2012 Jul;26(7):386-94.
ealing
2. 探索异质性来源之亚组分析:
亚组分析注意事项: 1. 亚组分析是观察研究,而非随机化比较; 2. 亚组分析后,假阳性和假阴性概率大大增
加; 3. 亚组分析应该是预先设定的(a priori),
如:按照不同干预方式分亚组:
Chopra, et al. Lancet. 2013 May 17. pii: S0140-6736(13)60592-9.
ealing
2. 探索异质性来源之亚组分析:
如:按照不同随访时间分亚组:
David, et al. J Orthop Trauma. 2012 Jul;26(7):386-94.
What
Identifing
ealing
Grade
什么是? 如何识别? 怎样处理? 与GRADE
ealing
1.
ealing
2. 探索异质性来源:
亚组分析 Meta回归 敏感性分析
4
ealing
2. 探索异质性来源之亚组分析:
亚组分析(subgroup analysis)是在出现异质性或要 回答特定患者、特定干预措施或特定研究时,从临床 异质性和方法学异质性的角度探讨异质性的来源,从 根本上解决同质性研究才能合并效应量的问题。
狭义:专指统计学异质性,用来描述一 系列研究中效应量的变异程度,也表明 除可预见的偶然机会外研究见存在的差 异性。
——《系统评价/meta分析理论与实践》
1
hat
分类:
Clinical diversity
Methodological diversity
Statistical heterogeneity
回答:所有人群中的平均处理效应是多少?
《系统评价/meta分析理论与实践》
ealing
7. 改变效应量:
1993年哥伦比亚大学公卫学院 的Joseph L. Fleiss发现仅仅改变 效应量也可去除异质性
《系统评价/meta分析理论与实践》
ealing
8. 放弃meta:
若异质性过于明显,特别是具有明显的临 床异质性、方法学异质性而无法通过上诉方法 结局时,可考虑放弃做meta分析,只对结果进 行一般的统计描述,即定性分析或狭义的系统 评价。