模拟音频参数和测试.doc
音频参数测试的方法以及步骤
测试中发现的问题及对策
• 关于STMR
• 从送话器到受话器的声传输称之为侧音。
• 使用META工具修改Side Tone的数值或者进入工程 模式在音频中的正常中找到Side Tone选项修改其数值使其Βιβλιοθήκη 在13 +/- 5 dB 内。
测试中发现的问题及对策
• 针对:稳定度储备
对手持机,将手持机防在坚硬平面上,传感器面向平面。如有音 量控制器,将其置为最大。 注要控制手机的接收和发送的增益,以使的手机不要啸叫。
式在音频中的正常中找到Speech选项修改其数值使
其在2 +/- 3 dB的范围内。
测试中发现的问题及对策
• 针对SFR 发送频响
MIC的质量
主要受MIC本身和手机的物理结构影响。另外于电路也有一定的关系。
具体的调试方法在META中将给出。
测试中发现的问题及对策
• 针对RFR 接收频响
主要受本身和手机的物理结构影响。另外于电路也有一定的关系。
不同仪表之间的差异
不同仪表之间的差异
GSM 11.10 30. 1 R ec eiv ing f requency res pons e AVGL//dRB[FPa/V] 30
20
10
0
-10
R CV(2)-R ef
lower
-20
upper
-30 120 200 300 400 f / Hz 1000 1600 2400 4000
dB relative to ARL
35 dB -30 dB -20 dB -10 dB
0 dB 7 dB 10 dB
Level ratio
17,5 dB 22,5 dB 30,7 dB 33,3 dB 33,7 dB 31,7 dB 25,5 dB
音频客观测量指标概念(全)
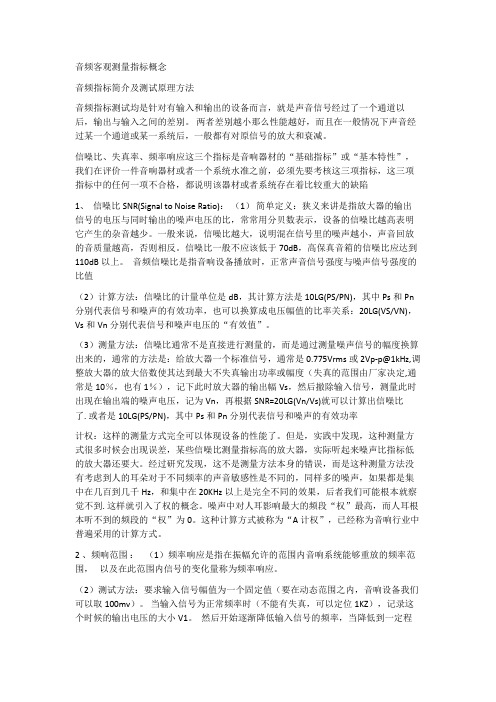
音频客观测量指标概念音频指标简介及测试原理方法音频指标测试均是针对有输入和输出的设备而言,就是声音信号经过了一个通道以后,输出与输入之间的差别。
两者差别越小那么性能越好,而且在一般情况下声音经过某一个通道或某一系统后,一般都有对原信号的放大和衰减。
信噪比、失真率、频率响应这三个指标是音响器材的“基础指标”或“基本特性”,我们在评价一件音响器材或者一个系统水准之前,必须先要考核这三项指标,这三项指标中的任何一项不合格,都说明该器材或者系统存在着比较重大的缺陷1、信噪比SNR(Signal to Noise Ratio):(1)简单定义:狭义来讲是指放大器的输出信号的电压与同时输出的噪声电压的比,常常用分贝数表示,设备的信噪比越高表明它产生的杂音越少。
一般来说,信噪比越大,说明混在信号里的噪声越小,声音回放的音质量越高,否则相反。
信噪比一般不应该低于70dB,高保真音箱的信噪比应达到110dB以上。
音频信噪比是指音响设备播放时,正常声音信号强度与噪声信号强度的比值(2)计算方法:信噪比的计量单位是dB,其计算方法是10LG(PS/PN),其中Ps和Pn 分别代表信号和噪声的有效功率,也可以换算成电压幅值的比率关系:20LG(VS/VN),Vs和Vn分别代表信号和噪声电压的“有效值”。
(3)测量方法:信噪比通常不是直接进行测量的,而是通过测量噪声信号的幅度换算出来的,通常的方法是:给放大器一个标准信号,通常是0.775Vrms或2Vp-p@1kHz,调整放大器的放大倍数使其达到最大不失真输出功率或幅度(失真的范围由厂家决定,通常是10%,也有1%),记下此时放大器的输出幅Vs,然后撤除输入信号,测量此时出现在输出端的噪声电压,记为Vn,再根据SNR=20LG(Vn/Vs)就可以计算出信噪比了. 或者是10LG(PS/PN),其中Ps和Pn分别代表信号和噪声的有效功率计权:这样的测量方式完全可以体现设备的性能了。
《数字音频处理技术》在线理论测试
《数字音频处理技术》在线理论测试适用于数字媒体技术2021级一.单选题(共20题,每题0.5分)1.人耳所能听到的声音波长范围是多少?() [单选题] *A.0.017m~17m(正确答案)B.0.016m~16mC.0.015m~15mD.0.014m~14m2.要录制来自话筒的声音,需要将话筒的连接线与声卡的()接口连接? [单选题] *A.Line inB.Mic(正确答案)C.SpkD.Midi3.将模拟音频转换为数字音频,又将数字音频转换为模拟音频的设备是()。
[单选题] *A.音响B.音箱C.声卡(正确答案)D.PCI卡4.在常温下,声音在空气中的传播速度是?() [单选题] *A.120m/sB.180m/sC.260m/sD.340m/s(正确答案)5.信号源S={S1,S2,S3,S4,S5,S6,S7},对应的概率为P={0.2,0.19,0.18,0.17,0.15,0.1,0.01},对其进行霍夫曼编码后的平均码字长度为()[单选题] *A.3.38B.2.72(正确答案)C.1.96D.3.226.实现侧链效果需要对音频轨道添加什么效果器?() [单选题] *A.调制效果B.动态处理(正确答案)C.多普勒换档器D.母带处理7.下面关于Audition的描述错误的是() [单选题] *A.在多轨编辑中可以实现与视频的集成B.在多轨编辑中可以实现多条音频轨道的混缩C.可在单轨编辑下实现侧链效果(正确答案)D.可在单轨编辑下查看波形的频谱特性8.对立体声的某波形声音进行数字化时,采样频率为4KHz,量化位数为16位,则其未压缩时的数据传输速率为()? [单选题] *A.16kbpsB.32kbpsC.64kbpsD.128kbps(正确答案)9.CD音频的标准采样率是多少()? [单选题] *A.96KHzB.22.05KHzC.48KHzD.44.1KHz(正确答案)10.录制来自外接设备的声音时,录制声音来源应该选择()设备。
音频测试指标与测试经验
FTA音频测试及测试经验厦门厦新移动通讯有限公司研发中心测试部厦门海沧新阳工业区厦新电子城 361022狄德海didehai@Tel: 86-0592-*******-32741. 音频测试项目在FTA音频测试中音频测试的项目有30.1,30.2,30.3,30.4,30.5.1,30.6.2,30.7.1参考GSM11.10注意事项所有的测试项目应在同一天的测试时间里通过但每一项的测试可以有多次测试直到测试通过为止30.1发送频率响应Sending Frequency Response30.1.1 定义发送灵敏度/频率响应用DB表示是指输入测试单音频时数字音频接口DAI的输出电平以PCM比特流代表与仿真嘴中的输入声压之比30.1.2 指标发送灵敏度/频率响应MRP-ÆDAI应处于表1给出的框罩内在对数频率/线形DB灵敏度坐标上对表1中的间断点之间画直线得到一个框罩如图1模板如下表1 发送灵敏度/频率响应Frequency (Hz) Upper Limit (dB) Lower Limit (dB)100 -12200 0300 0 -121000 0 -62000 4 -63000 4 -63400 4 -94000 030.1.3 测试方法a) 将手机装在LRGP中耳承密合于仿真耳的刃形边缘上b) 用仿真嘴在嘴参考点MRP送一个声压为 – 47dBPa的纯单音c) MS的DAI连接SS操作模式为音频设备及A/D D/A的测试d) 在100Hz~4000Hz频段内用1/2倍频间隔进行测试e) 在各个频率测DAI处PCM比特流代表的输出电平30.2 发送响度评定值Sending Loudness Rating SLR30.2.1 定义SLR是一种基于客观单音测试的表示发送频率响应的方法30.2.2 指标8 3 DB经验低dB值对应大的响度5dB对应最大的响度11dB代表最小的响度测试时通过调整手机的麦克风到人工嘴的距离使测试的值达到标准如果比标准值大则需调小手机麦克风到人工嘴的距离若比标准值小则调大其距离30.3 接收频率响应Receiving Frequency Response30.3.1 定义接收灵敏度/频率响应用DB表示是指仿真耳中的输出声压与DAI处PCM比特流代表的输入电平之比30.3.2 指标接收灵敏度/频率响应DAI至ERP应处于表2给出的框罩内在对数频率/线形DB灵敏度坐标上对下表中的间断点之间画直线得出框罩*的极限处于间断点之间所画的直线上30.3.3 测试方法a) 将手机装在LRGP中耳承应密合于仿真耳的刃行边缘上b) MS的DAI连接SS工作模式为音响设备与A/D D/A的测试c) SS通过DAI给MS发送一个相当于-16 dBm0纯单音的PCM比特流d) 在100HZ~40000HZ频段以1/2倍频间隔进行测试e) 在各个频率测仿真耳中耳参考点—ERP的声压经验手机与人工耳的密封性要整好表2 接收灵敏度/频率响应Frequency (Hz) Upper Limit (dB) Lower Limit (dB)100 -12200 0300 2 -7500 * -51000 0 -53000 2 -53400 2 -104000 230.4接收频率响应Receiving Loudness Rating RLR30.4.1 定义RLR是一种基于客观单音测试的表示接收频率响应的方法30.4.2 指标对于接收音量控制器对至少某一控制值RLR应满足dB当控制器置为最大时应不小于dB经验dB值较小对应较大的音量值dB代表最大发音量dB代表最小发音量在测试中通过调整手机的通话音量使达到标准值如果还不行就对SPEAK的发音孔进行大小调整比如用橡皮泥堵住其中的一个孔等等30.5.1 侧音掩蔽评定值(Side one Masking Rating, STMR30.5.1.1 定义侧音掩蔽评定值是基于客观单音的测试表示仿真嘴至仿真耳的通路损耗30.5.1.2 指标135dB经验如果STMR测试值与标准值相差较大则需要通过软件改变其参数若相差不大则可以通过调整音量来解决譬如比标准值大则需增大通话音量若比标准值小则需要调小通话音量30.6.2 稳定度储备Stability Margin30.6.2.1 定义稳定度储备是指产生震荡时需要的基准话音编译器的来去通路间插入的增益也就是用来反映手机音频是否容易出现自激振荡30.6.2.2 指标最小稳定度储备应为6dB并检测不到音频震荡30.6.2.3 测试方法a) 在中的基准话音编译器的来去通路的环路中插入一个相当于最小稳定度边际的增益并启动任一声回波控制器b) 将一个符合原建议.的测试信号在基准话音编译器的数字输入端插入环路观察稳定度测试信号的电平为dBm0,持续时间为c) 若存在用户控制的音量控制器应设置为最大值d) 将手机放在坚硬的平面上传感器面向平面经验稳定度储备一般情况下都会通过30.7.1 发送失真Sending Distortion30.7.1.1 定义发射信号与总失真之比是对发射设备不包括话音编译器线形度的量度30.7.1.2 指标用噪声加权滤波器在处测得的信号与总失真功率之比应高于表给出的极值30.7.1.3 测试方法a) 将手机装在中耳承要密合在仿真耳的刃行边缘上b) 的连接工作模式为音响设备及的测试c) 在中输入一个正弦波信号频率介于之间调节此信号的电平直到处输出的比特流等效为dBm0此时处的信号电平及为声参考电平d) 输入测试信号其电平相对于分别为-35dB -30dB -25dB -20dB -15dB -10dB -5dB 0dB 5dB 10dBe) 在每一个信号电平上用噪声加权滤波器测处信号于总失真的功率之比测试过程中声压不得超过dBPa表测出信号与总失真功率之比dB relative to ARL Level ratio-35 dB 17,5 dB-30 dB 22,5 dB-20 dB 30,7 dB-10 dB 33,3 dB0 dB 33,7 dB7 dB 31,7 dB10 dB 25,5 dB经验由于发送失真测试具有随机性只要在测试频点上的测试值与标准值相差不超过个dB多测试几次就会通过。
音频测试参数
Audio Specifications-Audio Specifications• Audio Distortion• THD - Total Harmonic Distortion• THD+N - Total Harmonic Distortion + Noise • IMD – SMPTE - Intermodulation Distortion • IMD – ITU-R (CCIF) - Intermodulation Distortion • S/N or SNR - Signal-To-Noise Ratio • EIN - Equivalent Input Noise• BW - Bandwidth or Frequency Response • CMR or CMRR - Common-Mode Rejection • Dynamic Range• Crosstalk or Channel Separation • Input & Output Impedance • Maximum Input Level • Maximum Output Level • Maximum Gain • Caveat EmptorDennis BohnRane CorporationRaneNote 145© 2000 Rane CorporationIntroductionObjectively comparing pro audio signal processing products is often impossible. Missing on too many data sheets are the conditions used to obtain the published data. Audio specifica-tions come with conditions. Tests are not performed in a vacuum with random parameters. They are conducted using rigorous procedures and the conditions must be stated along with the test results.To understand the conditions, you must first understand the tests. This note introduces the classic audio tests used to charac-terize audio performance. It describes each test and the condi-tions necessary to conduct the test.Apologies are made for the many abbreviations, terms and jargon necessary to tell the story. Please make liberal use ofRane’s Pro Audio Reference (/digi-dic.html ) to help decipher things. Also, note that when the term impedance is used, it is assumed a constant pure resistance, unless otherwise stated.The accompanying table (back page) summarizes common audio specifications and their required conditions. Each test is described next in the order of appearance in the table.Audio DistortionBy its name you know it is a measure of unwanted signals. Distortion is the name given to anything that alters a pure input signal in any way other than changing its magnitude. The most common forms of distortion are unwanted components or artifacts added to the original signal, including random and hum-related noise. A spectral analysis of the output shows these unwanted components. If a piece of gear is perfect the spectrum of the output shows only the original signal – nothing else – no added components, no added noise – nothing but the original signal. The following tests are designed to measure different forms of audio distortion.THD. Total Harmonic DistortionWhat is tested? A form of nonlinearity that causes unwant-ed signals to be added to the input signal that are harmonically related to it. The spectrum of the output shows added frequency components at 2x the original signal, 3x, 4x, 5x, and so on, but no components at, say, 2.6x the original, or any fractional multi-plier, only whole number multipliers.How is it measured? This technique excites the unit with a single high purity sine wave and then examines the output for evidence of any frequencies other than the one applied. Perform-ing a spectral analysis on this signal (using a spectrum, or FFT analyzer) shows that in addition to the original input sine wave, there are components at harmonic intervals of the input fre-quency. Total harmonic distortion (THD) is then defined as the ratio of the rms voltage of the harmonics to that of the funda-mental component. This is accomplished by using a spectrum analyzer to obtain the level of each harmonic and performing an rms summation. The level is then divided by the fundamental level, and cited as the total harmonic distortion (expressed in percent). Measuring individual harmonics with precision is dif-ficult, tedious, and not commonly done; consequently, THD+N (see below) is the more common test. Caveat Emptor: THD+N is always going to be a larger number than just plain THD. For this reason, unscrupulous (or clever, depending on your viewpoint) manufacturers choose to spec just THD, instead of the more mean-ingful and easily compared THD+N.Required Conditions. Since individual harmonic ampli-tudes are measured, the manufacturer must state the test signal frequency, its level, and the gain conditions set on the tested unit, as well as the number of harmonics measured. Hopefully, it’s obvious to the reader that the THD of a 10 kHz signal at a +20 dBu level using maximum gain, is apt to differ from the THD of a 1 kHz signal at a -10 dBV level and unity gain. And more different yet, if one manufacturer measures two harmonics while another measures five.Full disclosure specs will test harmonic distortion overthe entire 20 Hz to 20 kHz audio range (this is done easily by sweeping and plotting the results), at the pro audio level of +4 dBu. For all signal processing equipment, except mic preamps, the preferred gain setting is unity. For mic pre amps, the standard practice is to use maximum gain. Too often THD is spec’d only at 1 kHz, or worst, with no mention of frequency at all, and nothing about level or gain settings, let alone harmonic count.Correct: THD (5th-order) less than 0.01%, +4 dBu, 20–20 kHz, unity gainWrong:THD less than 0.01%THD+N. Total Harmonic Distortion + NoiseWhat is tested? Similar to the THD test above, except instead of measuring individual harmonics this tests measures everything added to the input signal. This is a wonderful test since everything that comes out of the unit that isn’t the pure test signal is measured and included – harmonics, hum, noise, RFI, buzz – everything.How is it measured? THD+N is the rms summation ofall signal components (excluding the fundamental) over some prescribed bandwidth. Distortion analyzers make this measure-ment by removing the fundamental (using a deep and narrow notch filter) and measuring what’s left using a bandwidth filter (typically 22 kHz, 30 kHz or 80 kHz). The remainder contains harmonics as well as random noise and other artifacts.Weighting filters are rarely used. When they are used, too often it is to hide pronounced AC mains hum artifacts. An exception is the strong argument to use the ITU-R (CCIR) 468 curve because of its proven correlation to what is heard. However, since it adds 12 dB of gain in the critical midband (the whole point) it makes THD+N measurements bigger, so marketeers prevent its widespread use.[Historical Note: Many old distortion analyzers labeled “THD” actually measured THD+N.]Required Conditions. Same as THD (frequency, level & gain settings), except instead of stating the number of harmon-ics measured, the residual noise bandwidth is spec’d, along with whatever weighting filter was used. The preferred value is a 20 kHz (or 22 kHz) measurement bandwidth, and “flat,” i.e., no weighting filter.Conflicting views exist regarding THD+N bandwidth mea-surements. One argument goes: it makes no sense to measure THD at 20 kHz if your measurement bandwidth doesn’t include the harmonics. Valid point. And one supported by the IEC, which says that THD should not be tested any higher than 6 kHz, if measuring five harmonics using a 30 kHz bandwidth, or 10 kHz, if only measuring the first three harmonics. An-other argument states that since most people can’t even hear the fundamental at 20 kHz, let alone the second harmonic, thereis no need to measure anything beyond 20 kHz. Fair enough. However, the case is made that using an 80 kHz bandwidth is crucial, not because of 20 kHz harmonics, but because it reveals other artifacts that can indicate high frequency problems. All true points, but competition being what it is, standardizing on publishing THD+N figures measured flat over 22 kHz seems justified, while still using an 80 kHz bandwidth during the design, development and manufacturing stages.Correct: THD+N less than 0.01%, +4 dBu, 20–20 kHz, unity gain, 20 kHz BWWrong:THD less than 0.01%IMD – SMPTE. Intermodulation Distortion – SMPTE MethodWhat is tested? A more meaningful test than THD, inter-modulation distortion gives a measure of distortion products not harmonically related to the pure signal. This is important since these artifacts make music sound harsh and unpleasant.Intermodulation distortion testing was first adopted in the U.S. as a practical procedure in the motion picture industry in 1939 by the Society of Motion Picture Engineers (SMPE – no “T” [television] yet) and made into a standard in 1941.How is it measured? The test signal is a low frequency (60 Hz) and a non-harmonically related high frequency (7 kHz) tone, summed together in a 4:1 amplitude ratio. (Other frequencies and amplitude ratios are used; for example, DIN favors 250 Hz & 8 kHz.) This signal is applied to the unit, and the output signal is examined for modulation of the upper frequency by the low frequency tone. As with harmonic distortion measurement, this is done with a spectrum analyzer or a dedicated intermodulationAudio Specifications-distortion analyzer. The modulation components of the upper signal appear as sidebands spaced at multiples of the lower fre-quency tone. The amplitudes of the sidebands are rms summed and expressed as a percentage of the upper frequency level.[Noise has little effect on SMPTE measurements because the test uses a low pass filter that sets the measurement bandwidth, thus restricting noise components; therefore there is no need for an “IM+N” test.]Required Conditions. SMPTE specifies this test use 60 Hz and 7 kHz combined in a 12 dB ratio (4:1) and that the peak value of the signal be stated along with the results. Strictly speaking, all that needs stating is “SMPTE IM” and the peak value used. However, measuring the peak value is difficult. Alternatively, a common method is to set the low frequency tone (60 Hz) for +4 dBu and then mixing the 7 kHz tone at a value of –8 dBu (12 dB less).Correct: IMD (SMPTE) less than 0.01%, 60Hz/7kHz, 4:1, +4 dBuWrong:IMD less than 0.01%IMD – ITU-R (CCIF). Intermodulation Distortion – ITU-R MethodWhat is tested? This tests for non-harmonic nonlinearities, using two equal amplitude, closely spaced, high frequency tones, and looking for beat frequencies between them. Use of beat fre-quencies for distortion detection dates back to work first docu-mented in Germany in 1929, but was not considered a standard until 1937, when the CCIF (International Telephonic Consulta-tive Committee) recommend the test. [This test is often mistakenly referred to as the CCI R method (as opposed to the CCI F method).A mistake compounded by the many correct audio references to the CCI R 468 weighting filter.] Ultimately, the CCIF became the radiocommunications sector (ITU-R) of the ITU (International Telecommunications Union), therefore the test is now known as the IMD (ITU-R).How is it measured? The common test signal is a pair of equal amplitude tones spaced 1 kHz apart. Nonlinearity in the unit causes intermodulation products between the two signals. These are found by subtracting the two tones to find the first location at 1 kHz, then subtracting the second tone from twice the first tone, and then turning around and subtracting the first tone from twice the second, and so on. Usually only the first two or three components are measured, but for the oft-seen case of 19 kHz and 20 kHz, only the 1 kHz component is measured.Required Conditions. Many variations exist for this test. Therefore, the manufacturer needs to clearly spell out the two frequencies used,and their level. The ratio is understood to be 1:1.Correct: IMD (ITU-R) less than 0.01%, 19 kHz/20 kHz, 1:1, +4 dBuWrong: IMD less than 0.01%S/N or SNR. Signal-To-Noise RatioWhat is tested? This specification indirectly tells you how noisy a unit is. S/N is calculated by measuring a unit’s output noise, with no signal present, and all controls set to a prescribed manner. This figure is used to calculate a ratio between it and a fixed output reference signal, with the result expressed in dB.How is it measured? No input signal is used, however the input is not left open, or unterminated. The usual practice isto leave the unit connected to the signal generator (with its low output impedance) set for zero volts. Alternatively, a resistor equal to the expected driving impedance is connected between the inputs. The magnitude of the output noise is measured us-ing an rms-detecting voltmeter. Noise voltage is a function of bandwidth – wider the bandwidth, the greater the noise. This is an inescapable physical fact. Thus, a bandwidth is selected for the measuring voltmeter. If this is not done, the noise voltage measures extremely high, but does not correlate well with what is heard. The most common bandwidth seen is 22 kHz (the extra 2 kHz allows the bandwidth-limiting filter to take affect without reducing the response at 20 kHz). This is called a “flat” measure-ment, since all frequencies are measured equally.Alternatively, noise filters, or weighting filters, are used when measuring noise. Most often seen is A-weighting, but a more accurate one is called the ITU-R (old CCIR) 468 filter. This filter is preferred because it shapes the measured noise in a way that relates well with what’s heard.Pro audio equipment often lists an A-weighted noise spec– not because it correlates well with our hearing – but because it can “hide” nasty hum components that make for bad noise specs. Always wonder if a manufacturer is hiding something when you see A-weighting specs. While noise filters are entirely appropri-ate and even desired when measuring other types of noise, it is an abuse to use them to disguise equipment hum problems. A-weighting rolls off the low-end, thus reducing the most annoying 2nd and 3rd line harmonics by about 20 dB and 12 dB respective-ly. Sometimes A-weighting can “improve” a noise spec by 10 dB.The argument used to justify this is that the ear is not sensi-tive to low frequencies at low levels (´ la Fletcher-Munson equal loudness curves), but that argument is false. Fletcher-Munson curves document equal loudness of single tones. Their curve tells us nothing of the ear’s astonishing ability to sync in and lock onto repetitive tones – like hum components – even when these tones lie beneath the noise floor. This is what A-weighting can hide. For this reason most manufacturers shy from using it; instead they spec S/N figures “flat” or use the ITU-R 468 curve (which actually makes their numbers look worse, but correlate better with the real world).However, an exception has arisen: Digital products using A/D and D/A converters regularly spec S/N and dynamic range using A-weighting. This follows the semiconductor industry’s practice of spec’ing delta-sigma data converters A-weighted. They do this because they use clever noise shaping tricks to create 24-bit con-verters with acceptable noise behavior. All these tricks squeeze the noise out of the audio bandwidth and push it up into the higher inaudible frequencies. The noise may be inaudible, but it is still measurable and can give misleading results unless limited. When used this way, the A-weighting filter rolls off the high frequency noise better than the flat 22 kHz filter and compares better with the listening experience. The fact that the low-end also rolls off is irrelevant in this application. (See the RaneNote Digital Dharma of Audio A/D Converters)Required Conditions. In order for the published figure to have any meaning, it must include the measurement bandwidth, including any weighting filters and the reference signal level.Audio Specifications-Stating that a unit has a “S/N = 90 dB” is meaningless without knowing what the signal level is, and over what bandwidth the noise was measured. For example if one product references S/N to their maximum output level of, say, +20 dBu, and another product has the same stated 90 dB S/N, but their reference level is + 4 dBu, then the second product is, in fact, 16 dB quieter. Likewise, you cannot accurately compare numbers if one unit is measured over a BW of 80 kHz and another uses 20 kHz, or if one is measured flat and the other uses A-weighting. By far how-ever, the most common problem is not stating any conditions.Correct: S/N = 90 dB re +4 dBu, 22 kHz BW, unity gainWrong: S/N = 90 dBEIN. Equivalent Input Noise or Input Referred NoiseWhat is tested? Equivalent input noise, or input referred noise, is how noise is spec’d on mixing consoles, standalone mic preamps and other signal processing units with mic inputs. The problem in measuring mixing consoles (and all mic preamps)is knowing ahead of time how much gain is going to be used. The mic stage itself is the dominant noise generator; therefore, the output noise is almost totally determined by the amount of gain: turn the gain up, and the output noise goes up accordingly. Thus, the EIN is the amount of noise added to the input signal. Both are then amplified to obtain the final output signal.For example, say your mixer has an EIN of –130 dBu. This means the noise is 130 dB below a reference point of 0.775 volts (0 dBu). If your microphone puts out, say, -50 dBu under normal conditions, then the S/N at the input to the mic preamp is 80 dB (i.e., the added noise is 80 dB below the input signal). This is uniquely determined by the magnitude of the input signal and the EIN. From here on out, turning up the gain increases both the signal and the noise by the same amount.How is it measured? With the gain set for maximum and the input terminated with the expected source impedance, the output noise is measured with an rms voltmeter fitted with a bandwidth or weighting filter.Required Conditions. This is a spec where test conditions are critical. It is very easy to deceive without them. Since high-gain mic stages greatly amplify source noise, the terminating input resistance must be stated. Two equally quiet inputs will measure vastly different if not using the identical input imped-ance. The standard source impedance is 150 Ω. As unintuitive as it may be, a plain resistor, hooked up to nothing, generates noise, and the larger the resistor value the greater the noise. It is called thermal noise or Johnson noise (after its discoverer J. B. Johnson, in 1928) and results from the motion of electron charge of the atoms making up the resistor. All that moving about is called thermal agitation (caused by heat – the hotter the resistor, the noisier).The input terminating resistor defines the lower limit of noise performance. In use, a mic stage cannot be quieter than the source.A trick which unscrupulous manufacturers may use is to spec their mic stage with the input shorted – a big no-no, since it does not represent the real performance of the preamp.The next biggie in spec’ing the EIN of mic stages is band-width. This same thermal noise limit of the input terminating resistance is a strong function of measurement bandwidth. For example, the noise voltage generated by the standard 150 Ω input resistor, measured over a bandwidth of 20 kHz (and room temperature) is –131 dBu, i.e., you cannot have an operating mic stage, with a 150 Ω source, quieter than –131 dBu. However, if you use only a 10 kHz bandwidth, then the noise drops to –134 dBu, a big 3 dB improvement. (For those paying close attention: it is not 6 dB like you might expect since the bandwidth is half. It is a square root function, so it is reduced by the square root of one-half, or 0.707, which is 3 dB less).Since the measured output noise is such a strong functionof bandwidth and gain, it is recommended to use no weighting filters. They only complicate comparison among manufacturers. Remember: if a manufacturer’s reported EIN seems too good to be true, look for the details. They may not be lying, only using favorable conditions to deceive.Correct: EIN = -130 dBu, 22 kHz BW, max gain, Rs = 150 ΩWrong: EIN = -130 dBuBW. Bandwidth or Frequency Response What is tested? The unit’s bandwidth or the range of frequencies it passes. All frequencies above and below a unit’s Frequency Response are attenuated – sometimes severely.How is it measured? A 1 kHz tone of high purity and precise amplitude is applied to the unit and the output measured using a dB-calibrated rms voltmeter. This value is set as the 0 dB reference point. Next, the generator is swept upward in frequen-cy (from the 1 kHz reference point) keeping the source ampli-tude precisely constant, until it is reduced in level by the amount specified. This point becomes the upper frequency limit. The test generator is then swept down in frequency from 1 kHz until the lower frequency limit is found by the same means.Required Conditions. The reduction in output level is relative to 1 kHz; therefore, the 1 kHz level establishes the 0 dB point. What you need to know is how far down is the response where the manufacturer measured it. Is it 0.5 dB, 3 dB, or (among loudspeaker manufacturers) maybe even 10 dB?Note that there is no discussion of an increase, that is, no mention of the amplitude rising. If a unit’s frequency response rises at any point, especially the endpoints, it indicates a funda-mental instability problem and you should run from the store. Properly designed solid-state audio equipment does not ever gain in amplitude when set for flat response (tubes or valve designs using output transformers are a different story and are not dealt with here). If you have ever wondered why manufacturers state a limit of “+0 dB”, that is why. The preferred condition here is at least 20 Hz to 20 kHz measured +0/-0.5 dB.Correct: Frequency Response = 20–20 kHz, +0/-0.5 dBWrong: Frequency Response = 20-20 kHzCMR or CMRR. Common-Mode Rejection or Common-Mode Rejection RatioWhat is tested? This gives a measure of a balanced input stage’s ability to reject common-mode signals. Common-mode is the name given to signals applied simultaneously to both inputs. Normal differential signals arrive as a pair of equal voltages that are opposite in polarity: one applied to the positive input and the other to the negative input. A common-mode signal drives both inputs with the same polarity. It is the job of a well designed bal-Audio Specifications-anced input stage to amplify differential signals, while simulta-neously rejecting common-mode signals. Most common-mode signals result from RFI (radio frequency interference) and EMI (electromagnetic interference, e.g., hum and buzz) signals induc-ing themselves into the connecting cable. Since most cables con-sist of a tightly twisted pair, the interfering signals are induced equally into each wire. The other big contributors to common-mode signals are power supply and ground related problems between the source and the balanced input stage.How is it measured? Either the unit is adjusted for unity gain, or its gain is first determined and noted. Next, a generator is hooked up to drive both inputs simultaneously through two equal and carefully matched source resistors valued at one-half the expected source resistance, i.e., each input is driven from one-half the normal source impedance. The output of the bal-anced stage is measured using an rms voltmeter and noted. A ratio is calculated by dividing the generator input voltage by the measured output voltage. This ratio is then multiplied by the gain of the unit, and the answer expressed in dB.Required Conditions. The results may be frequency-depen-dent, therefore, the manufacturer must state the frequency tested along with the CMR figure. Most manufacturers spec this at 1 kHz for comparison reasons. The results are assumed constant for all input levels, unless stated otherwise.Correct: CMRR = 40 dB @ 1 kHzWrong: CMRR = 40 dBDynamic RangeWhat is tested? First, the maximum output voltage and then the output noise floor are measured and their ratio expressed in dB. Sounds simple and it is simple, but you still have to be care-ful when comparing units.How is it measured? The maximum output voltage is mea-sured as described below, and the output noise floor is measured using an rms voltmeter fitted with a bandwidth filter (with the input generator set for zero volts). A ratio is formed and the result expressed in dB.Required Conditions. Since this is the ratio of the maxi-mum output signal to the noise floor, then the manufacturer must state what the maximum level is, otherwise, you have no way to evaluate the significance of the number. If one company says their product has a dynamic range of 120 dB and another says theirs is 126 dB, before you jump to buy the bigger number, first ask, “Relative to what?” Second, ask, “Measured over what bandwidth, and were any weighting filters used?” You cannot know which is better without knowing the required conditions.Again, beware of A-weighted specs. Use of A-weighting should only appear in dynamic range specs for digital products with data converters (see discussion under S/N). For instance, us-ing it to spec dynamic range in an analog product may indicate the unit has hum components that might otherwise restrict the dynamic range.Correct: Dynamic Range = 120 dB re +26 dBu, 22 kHz BW Wrong: Dynamic Range = 120 dB Crosstalk or Channel SeparationWhat is tested? Signals from one channel leaking into another channel. This happens between independent channels as well as between left and right stereo channels, or between all six channels of a 5.1 surround processor, for instance.How is it measured? A generator drives one channel and this channel’s output value is noted; meanwhile the other chan-nel is set for zero volts (its generator is left hooked up, but turned to zero, or alternatively the input is terminated with the expect source impedance). Under no circumstances is the measured channel left open. Whatever signal is induced into the tested channel is measured at its output with an rms voltmeter and noted. A ratio is formed by dividing the unwanted signal by the above-noted output test value, and the answer expressed in dB. Since the ratio is always less than one(crosstalk is always less than the original signal) the expression results in negative dB ratings. For example, a crosstalk spec of –60 dB is interpreted to mean the unwanted signal is 60 dB below the test signal.Required Conditions. Most crosstalk results from printed circuit board traces “talking” to each other. The mechanism is capacitive coupling between the closely spaced traces and layers. This makes it strongly frequency dependent, with a characteristic rise of 6 dB/octave, i.e., the crosstalk gets worst at a 6 dB/octave rate with increasing frequency. Therefore knowing the frequency used for testing is essential. And if it is only spec’d at 1 kHz (very common) then you can predict what it may be for higher frequencies. For instance, using the example from above of a –60 dB rating, say, at 1 kHz, then the crosstalk at 16 kHz probably degrades to –36 dB. But don’t panic, the reason this usually isn’t a problem is that the signal level at high frequencies is also reduced by about the same 6 dB/octave rate, so the overall S/N ratio isn’t affected much.Another important point is that crosstalk is assumed level independent unless otherwise noted. This is because the parasitic capacitors formed by the traces are uniquely determined by the layout geometry, not the strength of the signal.Correct: Crosstalk = -60 dB, 20-20kHz, +4 dBu, channel-to-channelWrong: Crosstalk = -60 dBInput & Output ImpedanceWhat is tested? Input impedance measures the load that the unit represents to the driving source, while output impedance measures the source impedance that drives the next unit.How is it measured? Rarely are these values actually mea-sured. Usually they are determined by inspection and analysis of the final schematic and stated as a pure resistance in Ωs. Input and output reactive elements are usually small enough to be ignored. (Phono input stages and other inputs designed for specific load reactance are exceptions.)Required Conditions. The only required information is whether the stated impedance is balanced or unbalanced (bal-anced impedances usually are exactly twice unbalanced ones). For clarity when spec’ing balanced circuits, it is preferred to state whether the resistance is “floating” (exists between the two lines) or is ground referenced (exists from each line to ground).The impedances are assumed constant for all frequencies within the unit’s bandwidth and for all signal levels, unlessAudio Specifications-。
音频测试方案

音频测试方案
一、前言
为确保音频设备在交付用户使用前具备卓越的性能和稳定的品质,本方案针对音频设备的功能、性能、可靠性和用户体验等方面进行系统性的测试。本方案旨在规范测试流程、方法和标准,为产品质量提升提供科学依据。
二、测试目标
1.确保音频设备的功能齐全,操作便捷;
2.评估音频设备的性能指标,满足国家和行业标准;
4.用户体验测试:模拟用户实际使用场景,评估音频设备的易用性、舒适度等。
六、测试流程
1.准备阶段:收集测试设备、标准、工具等;
2.测试计划:制定详细的测试计划,明确测试项目、方法、时间等;
3.测试执行:按照测试计划进行测试,记录测试数据;
4.数据分析:对测试数据进行分析,发现问题并提出改进措施;
5.撰写测试报告:整理测试结果,撰写测试报告;
3.用户需求:根据用户实际使用场景和需求进行测试。
五、测试方法
1.功能测试:检查音频设备的各项功能是否正常,如播放、暂停、停止、上一曲、下一曲等;
2.性能测试:评估音频设备的性能指标,如频率响应、失真度、信噪比等;
3.稳定性和可靠性测试:对音频设备进行长时间连续工作测试,检查设备在不同环境条件下的稳定性;
(3)信噪比:测试音频设备的信噪比,评估其抗干扰能力。
3.稳定性和可靠性测试:
(1)长时间连续工作测试:检查音频设备在长时间连续工作下的性能稳定性;
(2)环境适应性测试:检查音频设备在不同温度、湿度等环境条件下的性能稳定性。
4.用户体验测试:
(1)易用性测试:评估音频设备的操作便捷性、界面友好性等;
十、总结
本音频测试方案从功能、性能、可靠性和用户体验等方面对音频设备进行全面评估,旨在确保产品在交付用户前具备卓越的品质。通过严谨的测试流程和方法,为产品质量提升提供科学依据,助力企业提高市场竞争力。
音频测试参数详解

一、SLR=Lg(标准信号/麦克风接收到的信号);当测试结果大于11dB时,适当增加麦克风电路增益;当测试结果小于5dB时,适当降低麦克风电路增益;二、RLR=Lg(标准信号/听筒发出的音频信号)当测试结果小于-1dB时,适当降低听筒电路增益;当测试结果大于5dB时,适当增加听筒电路增益;三、SFR麦克风的质量,质量的好坏直接影响SFR的测试结果;手机物理结构;基带电路;四、RFR1>听筒的质量直接反映在测试结果上;2>听筒的声学中心如果与其物理中心不一致,也会影响测试结果;3>不正确的测试方法会导致测试结果的不可比;4>RF模式和DAI模式的不同,对测试结果有一定的影响;五、STMR=Lg(仿真嘴发出的音频信号/听筒发出的仿真嘴发出的音频信号)1>从麦克风到听筒的声传输称为侧音(Side tone);2>电话的侧音通道就是发话者讲话时能听到自己声音的一种通道,其他侧音通道还有头传导通道和嘴与耳朵之间经过耳承泄漏形成的声通道。
这些附加侧音通道的存在影响了用户对侧音的感觉,因此也影响了他对侧音的反映。
3>侧音从几个方面影响电话传输质量。
如果侧音损耗太小,则回到自己耳朵的话音声级太响;另一方面,若侧音损耗太大,还会使发话者趋于降低其讲话的声级或形成对方误以为发话者的麦克风远离嘴巴,从而使收话者的受听声级下降。
六、失真1>当系统的输入与输出不呈线性关系时,就要产生非线性失真;2>非线性失真对数据传输而言比语音传输更重要,但是对语音传送也很重要;3>量化失真:在数字系统中,当模拟信号被抽样,再把每个抽样信号编码为有限数字时就会出现量化失真。
把原始信号与量化后又复原的信号作比较,将差异叫做量化失真和非线性失真。
现在采用编码公式A律或者U律PCM都采用接近对数的压扩率。
七、稳定度余量将手机放在坚硬平面上,传感器面向平面,如果有音量控制器,将其置为最大。
音频性能测试指引
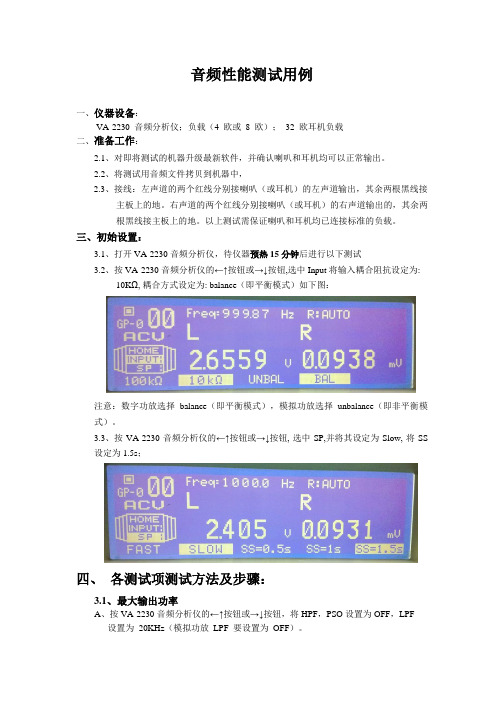
音频性能测试用例一、仪器设备:VA-2230音频分析仪;负载(4欧或8欧);32欧耳机负载二、准备工作:2.1、对即将测试的机器升级最新软件,并确认喇叭和耳机均可以正常输出。
2.2、将测试用音频文件拷贝到机器中,2.3、接线:左声道的两个红线分别接喇叭(或耳机)的左声道输出,其余两根黑线接主板上的地。
右声道的两个红线分别接喇叭(或耳机)的右声道输出的,其余两根黑线接主板上的地。
以上测试需保证喇叭和耳机均已连接标准的负载。
三、初始设置:3.1、打开 VA-2230 音频分析仪,待仪器预热 15 分钟后进行以下测试3.2、按 VA-2230 音频分析仪的←↑按钮或→↓按钮,选中 Input 将输入耦合阻抗设定为:10KΩ, 耦合方式设定为: balance(即平衡模式)如下图:注意:数字功放选择balance(即平衡模式),模拟功放选择unbalance(即非平衡模式)。
3.3、按 VA-2230 音频分析仪的←↑按钮或→↓按钮, 选中 SP,并将其设定为 Slow, 将 SS设定为 1.5s;四、各测试项测试方法及步骤:3.1、最大输出功率A、按 VA-2230 音频分析仪的←↑按钮或→↓按钮,将 HPF,PSO 设置为 OFF,LPF设置为20KHz(模拟功放LPF要设置为OFF)。
B、播放机器中的《08-1KHz-0dB》音频文件,并将音量调到最大。
按音频分析仪(中部上端)的AC-V按钮,音频分析仪屏幕左上方若出现ACV,表明已经选中,调节按钮选中UNIT 项,按钮F3 切换为V。
此时屏幕上显示的为左右声道输出的有效值。
最大输出功率必须满足总谐波失真的指标,如果总谐波失真超标,需将音量调小重新确认最大输出幅值。
总谐波失真测试方法见3.4。
注:屏幕左上方会显示Freq=1000Hz,或者频率很接近1000Hz。
如果此处未显示出数字,说明设置有误。
C、输出功率=输出幅值 /负载阻抗。
D、标准:不要超过喇叭或耳机的额定功率3.2、频率响应A、按照3.1 调节好仪器,播放机器中《08-1KHz-0dB》音频文件。
- 1、下载文档前请自行甄别文档内容的完整性,平台不提供额外的编辑、内容补充、找答案等附加服务。
- 2、"仅部分预览"的文档,不可在线预览部分如存在完整性等问题,可反馈申请退款(可完整预览的文档不适用该条件!)。
- 3、如文档侵犯您的权益,请联系客服反馈,我们会尽快为您处理(人工客服工作时间:9:00-18:30)。
模拟音频参数和测试1. 基本单位和概念dBu 以0.775V (有效值)为基准电压时的电压电平单位。
表示为:dBu=20lg(v/0.775)dBu 的计算只考虑电压电平本身,而不考虑与相应的电功率电平之间的关系,不考虑阻抗是否为600Ω。
---参照GY/T 192-2003dBu 采用接近0的源阻抗和接近无穷大的负载阻抗!基准信号的电平为0.775V RMS dBu=20log(Vx/0.775),Vx=0.775*10(Dbu/20),0.775V RMS 对应的电阻为600ohm,即1mW 在600ohm 产生0.77459的电压220.7750.001600U P WR ==注意dBu 表示的是电压值,在音频上并不是以1uV 作为基准电压,而是以0.775V RMS 作为基准 所以dBu 换算出来是RMS 值Vrms有效值,均方根值,正弦波时,均方根值Vrms为振幅Vm的0.707倍,为峰峰值的0.707/2倍Vpp峰峰值Vpp=2*Vm=2.828VrmsdBFs(dB below digital Full Scale)以满刻度的量值为0dB,常用于各种特性曲线上;数字音频信号测量中经常使用到单位“dbFS”。
0dbFS既是指满刻度的数字音频参考电平,即“数字满刻度电平”,它是指在数字域的音频系统中,A/D或D/A转换器可能达到的“数字过载”之前的最大可编码模拟信号电平。
0dbFS为数字音频信号最高峰的绝对值,与16bit线性编码PCM信号对应的最高值为7FFF(16进制),最高负值电平为8000(16进制),十进制数为32767。
不同国家对数字设备满度电平值OdBFS所对应的电平模拟信号的电平值不尽相同,目前还没有这个标准数字码的国际标准,常见的是SMPTE。
(美国电影电视工程师学会)和EBU(欧洲广播联盟)推荐的两个方案。
SMPTE推荐的转换基准规定为对于16bit的PCM声音信号,频率为lkHz的模拟正弦波信号的正、负峰值使A/D转换器分别产生OCCD,F333数字码时的幅度为参考电平。
OCCD和F333对应的十进制数为3277,因20lg3277/32767≈-20dBFS,所以SMPTE推荐的参考电平为-20dBFS。
EBU推荐的转换基准规定对于l6bit的PCM 声音信号,频率为lkHz的模拟正弦波信号的正、负峰值使A/D转换器分别产生0FFF,F000数字码时的幅度为参考电平。
0FFF,F000对应的十进制数为4095,因20lg4095/32767≈-18dBFS,所以EBU推荐的参考电平为-18dBFS。
针对不同的模拟基准电平,0dBFS所对应的模拟信号电压电平也不同。
由于中国广播系统中采用+4dBu 作为音频系统的校准电平,所以广播电影电视行业标准GY/T192规定数字设备的满度电平值0dBFS对应的模拟信号电平为24dBu,考虑到中国广播电台的实际情况,现阶段允许满度电平值0dBFS对应的模拟信号电压电平+22dBu的数字设备继续使用。
测试数字电视接收产品的音频输出电平时必须对测试码流中的音频信号电平进行规定。
GY/T-192规定中国的数宇音频满刻度电平0dBFS对应的模拟信号电平为+24dBu,但国际上对这个对应关系并没有统一的标准。
另外因应用场合不同,各种仪器设备的数字满引度所对应的模拟电平也不相同。
目前中国生产企业和测试机构多选用国外生产的数宇测试信号发生器,主要产品有美国泰克公司生产的MTG系列和R&S公司生产的DVRG等。
其中DVRG对音频信号有如下规定:0dBr=+6dBu=l.66V(DIN45406),0dBFS=满刻度,16bit编码,对应信号峰一峰的十进制数为65536;0dBr=- 6dBFS,16bit编码,对应信号峰一峰的十进制数为32768(土16384)。
可以看出,DVRG的数宇满刻度电平OdBFS对应的模拟电平不是+24dBu,而是+l2dBu,其参考电平是-6dBFS(+6dBu)。
《有线数字电视系统用户终端接收机入网技术条件和测量方法第一部分:透明传输电性能参数》(暂行)中规定:在测量数字有线电视接收机的音频输出电平时应采用-20dBFS(+4dBu)的信号,要求接收机的输出电平不小于-8dBu。
但是如果使用DVRG作为信号源,其-20dBFS所对应的不是+4dBu,而是-8dBu,如果仍采用-20dBFS的信号进行测试,会造成测试结果的不正确。
因此在使用数宇测试信号发生器前,应对其音频数字满刻度所对应的模拟信号电平进行确认,采用标准规定的信号电平进行测试,才能保证测试结果的准确性。
dBu和dBFS是有对应关系的FS Full Scale在美国ATSC系统中,0dBFS被定义为相当于模拟电平的24dBu(12.3V),在中国及欧洲备注对于16bit采样音频信号的动态范围是96DBdBFS = 20 * log (采样信号 / 1111 1111 1111 1111)20 * log (1111 1111 1111 1111 / 1111 1111 1111 1111) = 0 dBFS20 * log (0000 0000 0000 0001 / 1111 1111 1111 1111) = -96 dBFS(换成10进制)而24bit采样的采样音频信号的动态范围144.4943974 DB音频信噪比音频信噪比是指音响设备播放时,正常声音信号强度与噪声信号强度的比值。
当信噪比低,小信号输入时噪音严重,在整个音域的声音明显变得浑浊不清,不知发的是什么音,严重影响音质。
信噪比的大小是用有用信号功率(或电压)和噪声功率(或电压)比值的对数来表示的。
这样计算出来的单位称为“贝尔”。
实用中因为贝尔这个单位太大,所以用它的十分之一做计算单位,称为“分贝”。
对于便携式DVD来说,信噪比至少应该在70dB(分贝)以上,才可以考虑。
信噪比,即SNR(Signal to Noise Ratio),又称为讯噪比。
狭义来讲是指放大器的输出信号的电压与同时输出的噪声电压的比,常常用分贝数表示,设备的信噪比越高表明它产生的杂音越少。
一般来说,信噪比越大,说明混在信号里的噪声越小,声音回放的音质量越高,否则相反。
信噪比一般不应该低于70dB,高保真音箱的信噪比应达到110dB以上。
信噪比的测量及计算通过计算公式我们发现,信噪比不是一个固定的数值,它应该随着输入信号的变化而变化,如果噪声固定的话,显然输入信号的幅度越高信噪比就越高。
显然,这种变化着的参数是不能用来作为一个衡量标准的,要想让它成为一种衡量标准,就必须使它成为一个定值。
于是,作为器材设备的一个参数,信噪比被定义为了“在设备最大不失真输出功率下信号与噪声的比率”,这样,所有设备的信噪比指标的测量方式就被统一起来,大家可以在同一种测量条件下进行比较了。
信噪比通常不是直接进行测量的,而是通过测量噪声信号的幅度换算出来的,通常的方法是:给放大器一个标准信号,通常是0.775Vrms或2Vp-p@1kHz,调整放大器的放大倍数使其达到最大不失真输出功率或幅度(失真的范围由厂家决定,通常是10%,也有1%),记下此时放大器的输出幅Vs,然后撤除输入信号,测量此时出现在输出端的噪声电压,记为Vn,再根据SNR=20LG(Vn/Vs)就可以计算出信噪比了。
Ps和Pn 分别是信号和噪声的有效功率,根据SNR=10LG(Ps/Pn)也可以计算出信号比。
这样的测量方式完全可以体现设备的性能了。
但是,实践中发现,这种测量方式很多时候会出现误差,某些信噪比测量指标高的放大器,实际听起来噪声比指标低的放大器还要大。
经过研究发现,这不是测量方法本身的错误,而是这种测量方法没有考虑到人的耳朵对于不同频率的声音敏感性是不同的,同样多的噪声,如果都是集中在几百到几千Hz,和集中在20KHz以上是完全不同的效果,后者我们可能根本就察觉不到。
因此就引入了一个“权”的概念。
这是一个统计学上的概念,它的核心思想是,在进行统计的时候,应该将有效的、有用的数据进行保留,而无效和无用的数据应该尽量排除,使得统计结果接近最准确,每个统计数据都由一个“权”,“权”越高越有用,“权”越低就越无用,毫无用处的数据的“权”为0。
于是,经过一系列测试和研究,科学家们找到了一条“通用等响度曲线”,这个曲线代表的是人耳对于不同频率的声音的灵敏度的差异,将这个曲线引入信噪比计算方法后,先兆比指标就和人耳感受的结果更为接近了。
噪声中对人耳影响最大的频段“权”最高,而人耳根本听不到的频段的“权”为0。
这种计算方式被称为“A 计权”,已经称为音响行业中普遍采用的计算方式。
总谐波失真(THD )信号的失真情况,通常使用THD 也就是总谐波失真来表示,总谐波失真是指用信号源输入时,输出信号比输入信号多出的额外谐波成分。
谐波失真是由于系统不是完全线性造成的,它通常用百分数来表示,也可以用dB 来表示。
在正常工作的情况下,输出信号中总的谐波电压有效值与总输出信号的电压有效值之比。
所有附加谐波电平之和称为总谐波失真。
一般说来,1KHz 频率处的总谐波失真最小,因此不少产品均以该频率的失真作为它的指标。
但总谐波失真与频率有关,必须在20-20000Hz 的全音频范围内测出。
一般我们测试时测试THD+N(总谐波失真加噪声)左右声道串扰在多通道的放大器中,一个通道的信号可能会以衰减或失真的形式串进另一个通道,音频左右声道串扰是指当一个声道输入信号的时候,在另一个声道因为串过去的干扰所产生的信号强度,称为串扰,以dB 为单位(其实是dBr ),通常以0dB 单左声道和0dB 单右声道的音源测试L 声道对R 声道的串扰()20log ()L LR L U U左右声道相位差两个声道输入同一频率的信号时,由电路延时差异造成的相位差别(电容,电感都会造成相位差),通常以1KHz 为标准,所测值是个相位。
单位为度或者弧度左右声道电平差音频左右声道电平差,就是当两个声道输入同一幅度的信号时,输出部分由于电路增益差异造成的输出电平差别,以dB 为单位。
动态范围(dynamic range )数字音频的分辨率采样率44.1K 48K2. 几个测试指标(几个不同的标准,测试结果请注意单位)序号项目单位广电DVB-C要求IPTV要求备注1 音频输出电平dBu ≥-8 ≥-8 负载阻抗600测试信号为1KHZ/-20dBFs正弦波音频信号2 音频失真度%≤1.5 测试信号电平为1KHZ/-8dBFs测试频率范围为1KHZ3 音频幅频特性dB +1/-2 测试信号电平为-20dBFs测试频率范围为60HZ-18KHZ4 音频信噪比(不加权)dB ≥705 音频左右声道串扰dB ≤-706 音频左右声道相位差°≤57 音频左右声道电平差dB ≤0.5高清\标清机顶盒设备技术规范、待测项标准值测量值(1台样机)1 音频输出电平RMS(V) L 2.0±0.1 2.071V R 2.0±0.1 2.081V2 音频幅度响应(dB) L 20Hz-20KHz ±2 -3---+0.6(20Hz-20KHz)40Hz-18KHz ±1 -1---+0.6(40Hz-18KHz)R 20Hz-20KHz ±2 -3---+0.6(20Hz-20KHz)40Hz-18KHz ±1 -1---+0.6(40Hz-18KHz)3 谐波失真+噪声L ≤-65-60dB(0.09%)3.测试方法及所需要用到的片源0dB; 997Hz; Stereo(test1,2,6,7)0dB-20Hz-20000Hz-3s-67steps(test3)MP3 Test Tones - Infinity Zero(test4)0dB; 997Hz; Left(test5)0dB; 997Hz; Right(test5)4.几个音频相关的软件Ap2700专业音频编辑软件AdobeAuditionV3.0音频编辑软件GoldWavev5.52汉化绿色增强版5.音频部分设计中需要注意的几个问题音频电源噪声和滤波消除开关机POP元件品质对音频输出参数的影响。