抓trace软件Catcher使用指南
Catcher 使用快速指导

Catcher 使用快速指导一、手机工程模式设置1.首先手机开机,进入待机后,输入*#510818# P50指令*#3646633#2.选择“Device”-〉“Set UART”-〉UART Setting-〉“TST-PS Config”中的UART Port 设置成“UART 1“,速率修改为“460800”。
3.光标移动至“PS config”项将UART Port 修改为除“UART 1”外的任意端口。
4.按左软键ok后,手机自动关机。
5.手机重新开机,电脑PC与手机端通过数据线相连接二、Catcher工具设置(PC)1..打开Catcher 工具2.同步Database 文件1)菜单栏-〉config-〉set Datebase Path2)打开Datebase Path3)然后选择和测试版本所匹配的BPLGUInfoCustomSrc文件(一般附带在该版本的文件夹中),按ok键保存设置。
打开logging窗口,窗口打开后“Logging”前出现“√”标志选择数据线连接的com口Port选择当前电脑上数据线连接的端口号,Baud Rate设置为“460800”,按ok键保存设置连接以后可以进行对所需要测试和记录的log信息的设置Filter list打开后,“PS filter”工作页,选择打钩的项为“MOD_MED”“MOD_MED_V”“MMI_MEDIA_APP”。
然后按确定,log信息就可以显示,整个设置完成窗口trace信息滚动显示。
三、手机端操作步骤请您根据您所提交的故障,在手机端进行条件设置以及步骤复现。
四、Catcher端捕获trace信息(PC)1、Catcher工具断开connect。
点击2、菜单栏File-〉Save log as-〉输入所要保存的clg文件的文件名后,选择您所要的路径保存至电脑上。
至此,您所需要的clg文件获取完毕。
请将该clg文件发给HQ进行技术分析,谢谢。
flash catcher使用教学

實際抓.swf 檔
在搜尋列輸入 非常flash遊戲
進入網站
進入此網站
選遊戲
點選所要下載的遊戲
按右鍵選save
對著該遊戲按右鍵 選“save”
另存新檔並儲存
另存新檔後按下儲存
萬一無法下載
對著工具列按兩下 在按一次右鍵試試
選遊戲
對已下載的遊戲按右 鍵,選開啟檔案,以 IE開啟
選遊戲
點選所要下載的遊戲
Flash Catcher 使用教學
By Karen
到yahoo搜尋下載
在搜尋列輸入 Falsh catcher
到Toget下載
點進此網頁
Байду номын сангаас 到原創公司下載
點進原創公司,下載 flash catcher
下載軟體
按下download
到C槽download安裝軟體
執行所下載的軟體
安裝過程
選典型(Modify), 按下next
mtk下载工具主要使用FlashTool的用法
mtk下载工具主要使用FlashTool_V3.1(其实各个版本都差不多),主要用于将编译生成的bin 文件写入目标手机中,该工具不用安装,直接运行,主要用法如下:1 运行Flash_tool.exe 打开软件,2 点击Download Agent 载入MTK_AllInOne_DA.bin 这个文件3 点击Scatter_Loading 载入scat.txt 这个文件4 双击ROM 将项目目录下build文件夹下的bin文件加载进来5 插上手机的下载线,点击option,选择手机的rate速率,和相应的com口(一般会用到com3和com4,可以根据实际情况而定)点击DownLoad,然后轻轻按下手机的开机键,就可以下载选择的bin文件到目标手机中TRACE工具的使用1 注意事项mtk手机默认情况下想要打trace,需要在平台代码中你要打trace的语句中添加如下代码kal_prompt_trace(MOD_MED, "Check err: buffer miss %d\n",g_video_enc_info_ptr->check_buffer_miss_count);kal_prompt_trace(MOD_MED, "Check err: camera miss %d\n",g_video_enc_info_ptr->check_camera_miss_count);用法和c语言的printf函数相似,只不过第一个参数需要写想要打trace的模块的名称,如MOD_MED并且在还需要打开手机,在待机屏幕下输入*#3646633#,进入工程模式,然后进入设备菜单,再进入Set UART à UART Setting将TST Config 设置为UART 1按下确认键后手机会自动关机,经过这样的设置后就可以打trace了2 打开Catcher.exe 点击Config 菜单,选择set database path,会弹出一个set path的对话框到项目文件下的路径tst\database_classb下选择相应的database 文件点击Control,选择mode ,然后选择Logging 模式会弹出logging对话框,然后选择Config à Configure RS232.. 会自动弹出PORT这个对话框,选择相应的端口和速率按下F5 快捷键和目标手机链接,点击Control à Set Filter...选择PS Filter,选择你想显示的trace 模块打开手机,打出相应的trace 信息不同的手机MTK FlashTool 和Catch工具的的使用可能有些不同,但基本使用都差不多。
TRACE32 调试器使用指南 TRACE32 Trace Tutorial说明书
T race T utorial Release 02.2023TRACE32 Online HelpTRACE32 DirectoryTRACE32 IndexTRACE32 Debugger Getting Started ..............................................................................................Trace Tutorial (1)History (3)About the Tutorial (3)What is Trace? (3)Trace Use Cases4Trace Methods (5)Simulator Demo (6)Trace Configuration (7)Trace Recording (8)Displaying the Trace Results (10)Trace List10 Displaying Function Run-Times13 Graphical Charts13 Numerical Statistics and Function Tree14 Duration Analysis15 Distance Analysis16 Variable Display17 Track Option18Searching Trace Results (19)Trace Save and Load (20)Version 10-Feb-2023 History18-Jun-21New manual.About the TutorialThis tutorial is an introduction to the trace functionality in TRACE32. It shows how to perform a tracerecording and how to display the recorded trace information.For simplicity, we use in this tutorial a TRACE32 Instruction Set Simulator, which offers a full tracesimulation. The steps and features described in this document are however valid for all TRACE32 products with trace support.The tutorial assumes that the TRACE32 software is already installed. Please refer to “TRACE32Installation Guide” (installation.pdf) for information about the installation process.Please refer to “ICD Tutorial” (icd_tutorial.pdf) for an introduction to debugging in TRACE32 PowerView. What is Trace?T race is the continuous recording of runtime information for later analysis. In this tutorial, we use the term trace synonymously with core trace. A core trace generates information about program execution on a core,i.e. program flow and data trace. The TRACE32 Instruction Set Simulator used in this tutorial supports a fulltrace simulation including the full program flow as well as all read and write data accesses to the memory. A real core may not support all types of trace information. Please refer to your Processor Architecture Manual for more information.Trace Use CasesT race is mainly used in the following cases:1.Understand the program execution in detail in order to find complex runtime errors more quickly.2.Analysis of the code performance of the target code3.Verification of real-time requirements4.Code-coverage measurementsTrace MethodsTRACE32 supports various trace methods. The trace method can be selected in the Trace configuration window, which can be opened from the menu Trace > Configuration…If a trace method is not supported by the current hardware/software setup, it is greyed out in the trace configuration window. NONE means that no trace method is selected.We use in this tutorial the trace method Analyzer. Please refer to the description of the commandTrace.METHOD for more information about the different trace methods.Simulator DemoWe use in this tutorial a TRACE32 Simulator for Arm. The described steps are however valid for the TRACE32 Simulator for other core architectures.T o load a demo on the simulator, follow these steps:1.Start the script search dialog from the menu File > Search for scripts…2.Enter in the search field “compiler demo”3.Select a demo from the list with a double click, a PSTEP window will appear. Press the“Continue” button.We will use here the demo “GNU C Example for SRAM”.Trace ConfigurationIn order to set up the trace, follow these steps:1.Open the menu Trace > Configuration… The trace method Analyzer [A] should be selected perdefault. If this is not the case, select this trace method2.Clear the contents of the trace buffer by pressing the Init button [B].3.Select the trace operation mode [C].In mode Fifo , new trace records will overwrite older records. The trace buffer includes thus always the last trace cycles before stopping the recording.In Mode Stack , the recording is stopped if the trace buffer is full. The trace buffer always includes in this case the first cycles after starting the recording.Mode Leash is similar to mode Stack , the program execution is however stopped when the trace buffer is nearly full.TRACE32 supports other trace modes. Some of these modes depend on the core architecture. Please refer to the documentation of the command Trace.Mode for more information. We will keep here the default trace mode selection, which is Fifo .4.The SIZE field [D] indicates the size of the trace buffer. As we are using a TRACE32 Simulator, the trace buffer is reserved by the TRACE32 PowerView application on the host. It is thuspossible to increase the size of this buffer. If a TRACE32 trace hardware is used with a real chip, the size of the trace buffer is limited by the size of the memory available on the trace tool.In order to have a longer trace recording, we will set the trace buffer size to 10000000.BACDThe same configuration steps can be performed using the following PRACTICE script:Trace RecordingPress the Go button to start the program execution.The trace recording is automatically started with the program execution. The state in the Trace window changes from OFF to Arm [A]. The used field displays the fill state of the trace buffer [B].In order to stop the trace recording, stop the program execution with the Break button. The state in the trace window changes to OFF .Trace.METHOD Analyzer Trace.InitTrace.Mode FifoTrace.SIZE 10000000.BACThe trace recording is automatically started and stopped when starting and stopping the program execution because of the AutoArm[C] setting in the Trace window, which is per default enabled. The trace recording can also be started/stopped manually while the program execution is running using the radio buttons Armand OFF of the Trace window [A].Displaying the Trace ResultsTRACE32 offers different view for displaying the trace results. This document shows some examples.Please note that the trace results can only be displayed if the trace state in the Trace window is OFF. It is not possible to display the trace results while recording.The caption of a TRACE32 window includes the TRACE32 command that can be executed in the TRACE32 command line or in a PRACTICE script to open this window, e.g. here Trace.ListTrace ListA list view of the trace results can be opened from the menu T race > List > Default. The same window canbe opened from the Trace configuration window by pressing the List button.The Trace.List window displays the recorded trace packets together with the corresponding assembler and source code.In our case, trace packets are program fetches (cycle fetch) or data accesses (e.g. wr-long and rd-long for 32bit write and read accesses). Each trace packet has a record number displayed in the record column. The record number is a negative index for Fifo mode.As we are using a Simulator, each assembly instruction has an own trace packet. This is not the case with a real hardware trace.The displayed information can be reduced using the Less button. By pressing Less three times, only the high-level source code is displayed. This can be reverted using the More button.A double click on a line with an assembly instruction or high-level source code opens a List window showing the corresponding line in the code.Using the TRACE32 menu Trace > List > Tracing with Source , you get a Trace.List and a List /Track window. When doing a simple click on a line in the Trace.List window, the List window will automaticallydisplay the corresponding code line.The timing information (see ti.back column) is generated in this case by the TRACE32 Instruction Set Simulator. With a real core trace, timestamps are either generated by the TRACE32 trace hardware or by the onchip trace module.Double clickSimpleclickDisplaying Function Run-TimesTRACE32 supports nested and flat function run-time analysis based on the trace results. Please refer to the video “Flat vs. Nesting Function Runtime Analysis” for an introduction to function run-time analysis inTRACE32:/tut_profiling.htmlGraphical ChartsBy selecting the menu Trace > Chart > Symbols, you can get a graphical chart that shows the distribution of program execution time at different symbols. The displayed results are based on a flat analysis:The corresponding nesting analysis can be displayed using the menu Perf > Function Runtime > Show as Timing.The In and Out buttons can be used to zoom in/out. Alternatively, you can select a position in the window and then use the mouse wheel to zoom in/out.Numerical Statistics and Function TreeThe menu entry Perf > Function Runtime >Show Numerical displays numerical statistics for each function with various information as total run-time, minimum, maximum and average run-times, ratio, and number of function calls.ABParents [A] displays for example a caller tree for the selected function. By doing a right mouse click on func1 and selecting Parents, we see the run-times of the functions func2 and func9, which have called func1 in thetrace recording.Children [B] displays the run-times of the functions called by the selected function, for example here the function subst called by the function encode.A function call tree view of all function recorded in the trace can be displayed using the menu entries Perf >Function Runtime > Show as Tree or Perf > Function Runtime > Show Detailed Tree.Duration AnalysisBy doing a right mouse click on a function in the numerical statistics window (Trace.STATistic.Func) then selecting Duration Analysis, you get an analysis of the function run-times between function entry and exit including the time spent in called subroutines, e.g. here for the function subst (P:0x114C corresponds to the start address of the subst function):The time interval can be changed using the Zoom buttons.Distance AnalysisBy doing a right mouse click on a function in the numerical statistics window (Trace.STATistic.Func) then selecting Distance Analysis, you can get run-times between two consecutive calls of the selected function,e.g. here for the function subst (P:0x114C corresponds to the start address of the subst function):Variable DisplayThe Trace.ListVar command allows to list recorded variables in the trace. If the command is used without parameters all recorded variables are displayed:Y ou can optionally add one or multiple variables as parameters.Example: display all accesses to the variables plot1 and plot2The Draw button can then be used to plot the displayed variables graphically against time. This corresponds to the following TRACE32 command:Please refer for more information about the Trace.DRAW command to “Application Note forTrace.DRAW” (app_trace_draw.pdf).Trace.ListVar Trace.ListVar %DEFault plot1 plot2Trace.DRAW.Var %DEFault plot1 plot2Track OptionThe /Track options allows to track windows that display the trace results. Y ou just need to add the /Track option after the command that opens a trace window, e.g.Trace.List /TrackThe cursor will then follow the movement in other trace windows, e.g. Trace.Chart.Func. Default is time tracking. If no time information is available, tracking to record number is performed.TRACE32 windows that displays the trace results graphically, e.g. Trace.Chart.Func, additionally accept the /ZoomTrack option. If the tracking is performed with another graphical window, the same zoom factor is used in this case.Trace.Chart.Func /ZoomTrackSearching Trace ResultsThe Find button allows to search for specific information in the trace results.Example 1: find the first call of function func21.Enter “func2” under address / expression2.Select Program under cycle3.Press the Find First button. The next entries to func2 in the trace can then be found using theNext buttonExample 2: Find all write accesses to the variable mstatic1 with the value 0x01.Enter “mstatic1” under address / expression2.Select Write under cycle3.Enter 0x0 under Data4.Press the Find All buttonPlease refer to “Application Note for Trace.Find” (app_trace_find.pdf) for more information about Trace.Find.Trace Save and LoadThe recorded trace can be stored in a file using the command Trace.SAVE , e.g.The saved file can then be loaded in TRACE32 PowerView using the command Trace.LOADThe TRACE32 trace display windows will show in this case a LOAD message in the low left cornerPlease note that TRACE32 additionally allows to export/import the trace results in different formats. Refer to the documentation of the command groups Trace.EXPORT and Trace.IMPORT for more information. Trace.SAVE file.adTrace.LOAD file.ad。
trace 用法 chrom
trace 用法chrom[trace 用法chrom]在计算机科学领域,trace(追踪)是一种用于调试程序的技术。
它可以记录程序的执行过程和变量的数值,以帮助开发人员诊断和修复程序错误。
Trace也被广泛应用于性能分析和优化领域,以帮助开发人员理解和改进程序的执行性能。
在本文中,我们将详细介绍Trace在Chrome浏览器中的用法,并探讨如何使用Trace来分析和优化web应用程序的性能。
第一部分:Chrome浏览器中的Trace 工具1.1 Trace 工具的概述首先,我们将对Chrome浏览器中的Trace工具进行概览。
Trace工具是Chrome开发者工具的一部分,它可以捕捉和展示程序的执行轨迹和性能数据。
通过使用Trace工具,开发人员可以深入了解代码执行过程中出现的性能瓶颈,以及如何优化代码以改进性能。
1.2 Trace 工具的开启和配置在使用Trace工具之前,我们需要打开Chrome浏览器的开发者工具。
然后,在开发者工具的顶部导航栏中找到"Performance"(性能)选项卡,并点击它。
在性能选项卡中,可以看到Trace工具的相关选项和配置。
1.3 开始一个Trace Session在Trace工具中,通常会使用两种方式开始一个Trace会话。
第一种方式是通过点击工具栏上的记录按钮来手动开始和停止Trace。
另一种方式是通过命令行接口(CLI)来自动开始和停止Trace。
1.4 配置并运行Trace在开始Trace会话之前,我们可以配置Trace工具以捕获特定的性能数据。
例如,可以选择捕获特定的事件、采样频率、页面加载时间等。
配置完毕后,我们可以点击记录按钮开始Trace会话。
在会话过程中,我们可以进行一系列操作,例如打开和关闭页面、执行操作等。
1.5 停止Trace 并分析结果当我们认为Trace会话已经足够长或者已经捕获到了感兴趣的性能数据后,可以点击停止按钮来停止Trace。
HTTPCatcher网球实战教程VIP
HTTPCatcher网球实战教程VIP
网球实战教程
今天我们来实战学习如何重写简单的会员规则
首先我们需要准备已解锁内购的Http catcher(网球)、被抓包的应用(马卡龙玩图)然后抓取应用的会员信息,并修改(重写)会员信息。
写规则前我们要学习正则表达式今天我们要使用的是初学使用的正则式元字符\d(匹配数字)
网球准备好了,应用下载好了,抓取之前我们需要登录应用,因为很多应用必须登录后才可以抓取到我们想要的内容。
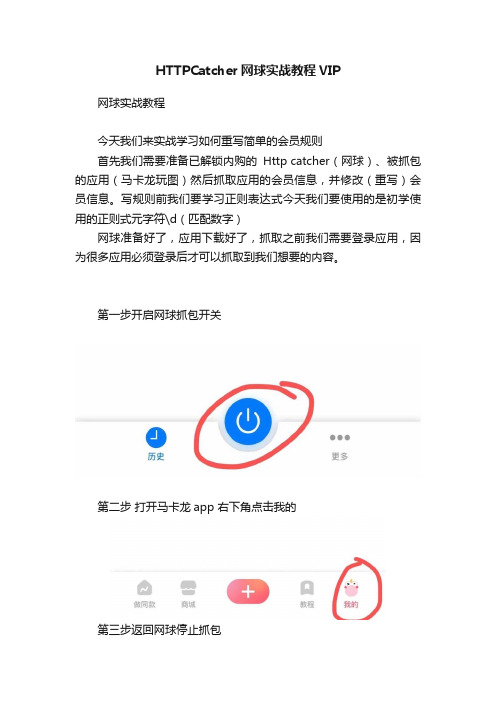
第一步开启网球抓包开关
第二步打开马卡龙app 右下角点击我的
第三步返回网球停止抓包。
MTK入门基础
一、树立自信心:总的来说,在MTK平台上开发软件并不是一件特别难的事情。
要树立自信心,关键是要发现自己能做出一点小的东西来,增加对它的兴趣。
刚开始你可以在屏幕上显示一个文本,然后你可以尝试去显示一个具有某种风格的窗体,接着可以试着添加一个菜单。
这些东西学会后主管会给你一些小的任务,比如去解一些小的bug,更换某个应用程序的界面图片,显示风格等。
随着你对MTK的逐步了解,你会接触越来越多的新鲜玩意,当然难度会相应增加,当然你可能并未明显察觉,只要你循序渐进,这些都是没有问题的。
当然困难肯定是有的,你可以去主动问其他的同事。
MTK是一个多线程的嵌入式开发环境,可以通过一些命令对代码进行编译,如果通过编译,就会在“(代码根目录)\build \ (工程名) \”目录下生成6个文件,分别是*.bin 文件、scat*.txt、*.elf、*.lis、*.sym、*.log 。
这些文件中前两个是我们最经常使用的,bin 文件就是我们用来下载到手机中的二进制的镜像文件,scat*.txt用于加载这个镜像文件。
我们的下载(烧写)工具是一个叫fllash tool的小软件。
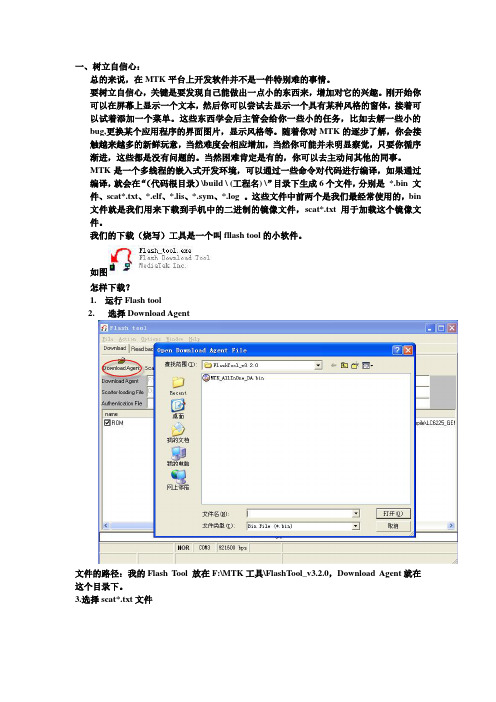
如图怎样下载?1.运行Flash tool2. 选择Download Agent文件的路径:我的Flash Tool 放在F:\MTK工具\FlashTool_v3.2.0,Download Agent就在这个目录下。
3.选择scat*.txt文件4.如果红色方框内有location栏不为空,说明bin文件已经装载成功。
给手机装上电池,点击Download,然后插上烧写线即开始下载程序,当显示一个OK 的小弹出框时,表明烧写完毕,可以拔下烧写线开机了。
怎么样,是不是觉得很神奇呀?下面的东西更神奇。
需要说明一下:Download Agent文件只需要选择一次就够了,当然如果发现文件没有正确选择,重新选择正确的那个就好了。
如果你想要格式化手机的ROM,你可以在手机烧写成功后,点击Format你也可以在每次烧写的最后进行格式化动作,只需要Option菜单下的Format FAT,在弹出框中选中Auto Format FAT即可。
MTK catcher使用说明中英文版

Catcher使用说明1 Overview ........................................................................................................... 3/概述1.1 Overview of MTK Catcher .......................................... 3/MTK Catcher的概述1.2 Using Catcher: Logging mode .......................... 5/使用Catcher:logging模式1.3 Using Catcher: Off-line mode .......................... 7/使用Catcher:Off-line模式2 Frame Window and Dialogs .................................................... 8/框架窗口和对话框2.1 Trace & Primitive Log Window ........................ 8/Trace & Primitive Log 窗口2.2 Sys Trace Window ................................................................. 11/系统追踪窗口2.3 Err Msg Window .................................................................... 13/错误消息窗口2.4 MSC View Window .................................. 15/MSC(消息序列图)视图窗口2.5 Filter Dialog ............................................................................. 17/Filter对话框2.6 Engineering Mode Dialog .................................................. 20/工程模式对话框2.7 Sim Editor Dialog .......................................................... 23/Sim编辑器对话框2.8 Exception Window ......................................................................... 25/异常窗口2.9 Statistics Window ................................................................... 27/统计数据窗口3 Menus .............................................................................................................. 29/菜单3.1 File menu ....................................................................................... 29/文件菜单3.2 Edit menu ....................................................................................... 31/编辑菜单3.3 View menu ..................................................................................... 32/视图菜单3.4 Control menu ................................................................................. 34/控制菜单3.5 Config menu................................................................................... 35/配置菜单3.6 Advance menu ................................................................................ 36/高级菜单3.7 Window menu ................................................................................ 38/窗口菜单3.8 Help menu ...................................................................................... 39/帮助菜单3.9 Tool Bar.............................................................................................. 40/工具栏3.10 Command Tool Bar .................................................................. 43/命令工具栏3.11 AT Command Tool Bar ...................................................... 44/AT命令工具栏3.12 Auto-Clear Tool Bar ....................................................... 45/自动-清除工具栏1 Overview概述1.1 Overview of MTK Catcher MTK Catcher的概述Catcher is a PC-side tool for MTK GSM/GPRS Products. The main function of Catcher is for logging primitives and debug information.The wireless protocol stack is composed of different modules. Each module uses primitives (messages) to communicate with other modules through SAP (service access point). Catcher can log these primitives by setting the correct filters. Modules also use trace functions to display the debug information on Catcher.The structures of the primitives are parsed and collected during the target-build process. An information-database will be generated after the process, so Catcher can use the database to display primitives. It‘s important for catcher to use the correct database. Using a mismatched database will result in confusion and a wrong logging file.Catcher has two operation modes: logging mode and off-line mode.For logging mode, Catcher needs the database generated during the target-build process. After setting the correct database, engineers can connect toCatcher是一个在PC端的工具,用于MTK GSM/GPRS产品。
- 1、下载文档前请自行甄别文档内容的完整性,平台不提供额外的编辑、内容补充、找答案等附加服务。
- 2、"仅部分预览"的文档,不可在线预览部分如存在完整性等问题,可反馈申请退款(可完整预览的文档不适用该条件!)。
- 3、如文档侵犯您的权益,请联系客服反馈,我们会尽快为您处理(人工客服工作时间:9:00-18:30)。
MTK trace工具使用说明
第一章安装驱动
1、将trace线插到电脑的USB口,将提示发现新硬件,提示安装驱动,
2、此时选择“从列表或制定位置安装”,然后指向PL-2303H&HX_driver目录。
然后点击下一步完成安装驱动。
第二章使用trace软件
3:打开:Catcher_v3.9.02目录下的Catcher.exe,出现如下的界面:
4、选择config -> SetDatabase Path ->
5、点击,出现如下的对话框:
6、点击红圈,选择抓trace 需要的database;比如附件中的《BPLGUInfoCustom_MT6226M_S01_MAUI_05C_W06_16》
备注:如果有mtk的工程的话这个database 在这个目录下:\tst\database_classb 选中这个目录下文件名最长的就可以了
7、点击Control -> mode -> logging,或者如下红圈所标图标。
按钮,出现图中选择com的对话框。
只需要选择红com 口其他的都不需要修改。
9、把手机连接到trace 线上,然后点击connect图标,如下图
10、设置过滤条件。
点击红圈中的Filter图标,出现如下对话框:
11、从上到下依次点击红圈中的按钮。
到文本文件中。
第三章手机的设置
如果按照前述操作不能抓到trace,则很可能是手机上没有正确的设置。
此时对手机进行如下设置:
1、输入命令进入工程模式(aux 手机进入工程模式的命令是:*789#)
2、进入“设备”这个菜单
3、进入“set uart”这个菜单
4、进入“uart setting”这个菜单
5、在显示的界面中有一个“tst config”,将这个项目的com口设置成:uart1,波
特率设置115200就可以了啊
6、设置好后,选择“确认“,这个时候手机会自动关机,然后重启手机就可以了。
一般情况,MTK平台手机进入工程模式指令:*#3646633#。