2011年数学建模美赛论文
2011数学建模竞赛C题论文

企业退休职工养老金制度的改革研究摘要近年来,随着我国快速进入老龄化社会,退休后的养老金问题已经成为了人们的焦点问题。
本文基于山东省的一系列统计数据,对养老保险中的替代率及资金缺口问题进行了分析。
针对问题一,根据我国经济发展的实际情况并结合经济发展的中长期发展目标,我们认为工资增长率今后应该是逐年递减的,并在某个时间达到较稳定的状态,故我们采用了阻滞增长模型,利用MATLAB对问题所提供的山东省职工历年平均工资统计表中的数据进行拟合,预测出了2011年至2035年的山东省职工的年平均工资。
针对问题二,我们利用EXCEL这个工具来进行计算,对各年龄段工资进行分析统计,计算出了题目提出的各种情况下的替代率,分别是30岁到55岁为34%,到60岁为42%,到65岁为60%;40岁到55岁为21%,到60岁为29%,到65岁为39% ,并对结果进行分析,得出当开始缴费的年龄相同时缴费年限越高,替代率越高;当缴费年限相同时,开始缴费的年龄越晚,替代率越高。
针对问题三,根据该企业某职工不同的退休年龄的情况,同样利用EXCEL进行计算并得到结果,当他是55岁或60岁时退休,这两种情况就会存在缺口问题,当他是65岁退休时就不存在缺口问题,我们同时也计算出该职工若55岁退休,到69岁的时候,其缴存的养老保险基金与其领取的养老金之间达到收支平衡,若是60岁退休则会推迟到73岁达到收支平衡。
结合问题二,我们可知,当替代率越高,则缺口越小。
针对问题四,我们给出了替代率与工资增长率、资金收益率、缴费率及缴费年限等影响因素的函数表达式,由该函数很容易看出替代率是缴费年限及资金收益率的增函数,从而可以通过提高投资收益率或增加缴费年限的方式来达到预期目标。
关键词养老金替代率阻滞增长模型收支平衡一、问题重述1.1养老金简介养老金也成退休金,是一种根据劳动者对社会所贡献及其所具备享受养老保险的资格,以货币形式支付的保险待遇,用于保障职工退休后的基本生活需要。
2011年数学建模大赛优秀论文

交巡警服务平台的设置与调度的数学模型摘要针对交巡警服务平台的设置与调度问题,本文主要考虑出警速度和各服务平台的工作量来建立合理方案。
对于A区的20个交巡警服务平台分配管辖范围的问题,我们采用Dijkstra算法,分别求得在3分钟内从服务台可以到达的路口。
根据就近原则,每个路口归它最近的服务台管辖。
对进出A区的13个交通要道进行快速全封锁,我们采用目标规划进行建模,运用MATLAB软件编程,先找出13个交通要道到20个服务台的所有路径。
然后在保证全封锁时间最短的前提下,再考虑局部区域的封锁效率,即总封锁时间最短,封锁过程中总路程最小,从而得到一个较优的封锁方案。
为解决前面问题中3分钟内交巡警不能到达的路口问题,并减少工作量大的地区的负担,这里工作量以第一小问中20个服务台覆盖的路口发案率之和以及区域内的距离的和来衡量。
对此我们计划增加四个交巡警服务台。
避免有些地方出警时间过长和服务台工作量不均衡的情况。
对全市六个区交警平台设计是否合理,主要以单位服务台所管节点数,单位服务台所覆盖面积,以及单位服务台处理案件频率这些因素进行研究分析。
以A 区的指标作为参考,来检验交警服务平台设置是否合理。
对于发生在P点的刑事案件,采用改进的深度搜索和树的生成相结合的方法,对逃亡的犯罪嫌疑人进行可能的逃逸路径搜索。
由于警方是在案发后3分钟才接到报警,因此需知道疑犯在这3分钟内可能的路线。
要想围堵嫌疑犯,服务台必须要在嫌疑犯到达某节点之前到达。
用MATLAB编程,搜索出嫌疑犯可能逃跑的路线,然后调度附近的服务台对满足条件的节点进行封锁,从而实现对疑犯的围堵。
关键词:Dijkstra算法;目标规划;搜索;一、问题重述近十年来,我国科技带动生产力不断发展,我国的经济实力不断增强,而另一方面安全生产形式却相当严峻。
每年因各类生产事故造成大量的人员伤亡、经济损失。
尤其是一些大目标点,作为人类经济、政治、文化、科技信息的中心,由于其“人口集中、建筑集中、生产集中、财富集中”的特点,一旦发生重大事故,将会引起惨重的损失。
2011年大学数学建模论文

承诺书我们仔细阅读了中国大学生数学建模竞赛的竞赛规则.我们完全明白,在竞赛开始后参赛队员不能以任何方式(包括电话、电子邮件、网上咨询等)与队外的任何人(包括指导教师)研究、讨论与赛题有关的问题。
我们知道,抄袭别人的成果是违反竞赛规则的, 如果引用别人的成果或其他公开的资料(包括网上查到的资料),必须按照规定的参考文献的表述方式在正文引用处和参考文献中明确列出。
我们郑重承诺,严格遵守竞赛规则,以保证竞赛的公正、公平性。
如有违反竞赛规则的行为,我们将受到严肃处理。
我们参赛选择的题号是(从A/B/C/D中选择一项填写): B我们的参赛报名号为(如果赛区设置报名号的话):所属学校(请填写完整的全名):陇东学院参赛队员(打印并签名) :1. 任耀辉2. 魏斌3. 邵文娟指导教师或指导教师组负责人(打印并签名):冯积社董文瑾日期: 2011 年 9 月 12日赛区评阅编号(由赛区组委会评阅前进行编号):编号专用页赛区评阅编号(由赛区组委会评阅前进行编号):全国统一编号(由赛区组委会送交全国前编号):全国评阅编号(由全国组委会评阅前进行编号):交巡警服务平台的设置与调度的设计方案摘要由于平面区域不能用圆来不重不漏地覆盖,我们采用正六边形来覆盖,但根据道路口疏密状况和人口数量、区域面积的差异,最后决定对于不同区域采用不同尺寸的正六边形,来覆盖城区各道路的方法来进行各个交巡警服务平台的管辖范围的初次预分配,对于初次预分配的结果按各个道路口到各服务平台的最短路的里程乘以发案率的和,得到各个服务平台的总工作量。
按相邻区域内服务平台工作量相当的标准进行调整,用Dijkstra算法求得那些重复包含和漏掉的路口,及那些距离邻近的路口节点重新分配到邻近的正六边形内,从而得到最终的管理范围。
由于要力求工作量均衡,就目前的服务平台而言数量不足,通过采用最短路的选址方法来确定,应就需再增加3个服务平台,具体位置分别在标号为29、72、90的三个路口。
2011数学建模A题神经网络优秀论文,带代码
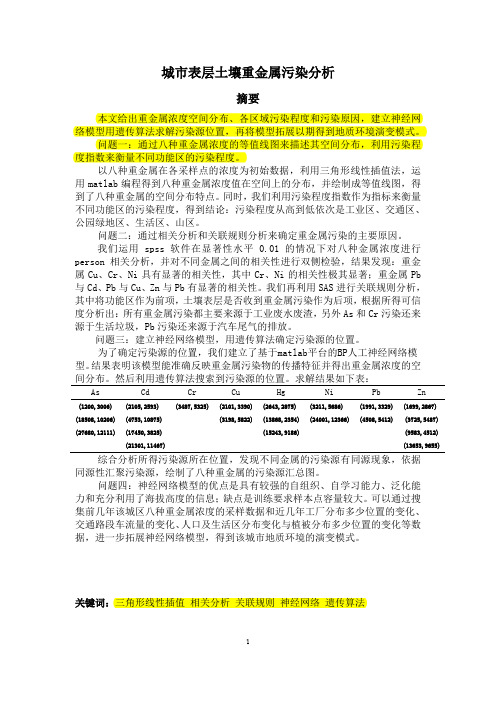
图 1 该城区的地形分布图
首先,我们根据样本点的位置和海拔绘制出该城区的地貌,见图 1。我们运 用 matlab 软件,根据各个网格区域中的重金属含量,用三角形线性插值的方法 得到各种重金属含量在空间上分布的等值线图。
1 图 2-1
2
1 图 2-2
2
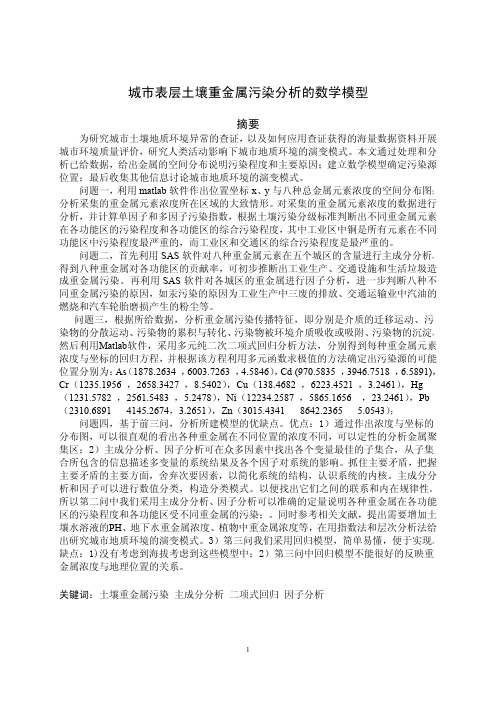
图 2-1 给出了 As 在该区域的空间分布:图中可以观察到 As 有两个明显的高 值中心,我们标记为区域 1 和 2。这两个区域都处于工业区分布范围内,并以该 两个区域作为中心向外延伸, 浓度逐渐减少,同时我们注意到在山区的很多区域
Ni
(3211,5686) (24001,12366)
Pb
(1991,3329) (4508,5412)
Zn
(1699,2867) (3725,5487) (9583,4512) (13653,9655)
综合分析所得污染源所在位置,发现不同金属的污染源有同源现象,依据 同源性汇聚污染源,绘制了八种重金属的污染源汇总图。 问题四:神经网络模型的优点是具有较强的自组织、自学习能力、泛化能 力和充分利用了海拔高度的信息;缺点是训练要求样本点容量较大。可以通过搜 集前几年该城区八种重金属浓度的采样数据和近几年工厂分布多少位置的变化、 交通路段车流量的变化、 人口及生活区分布变化与植被分布多少位置的变化等数 据,进一步拓展神经网络模型,得到该城市地质环境的演变模式。
符号
意义
k i j
x ij
xi
表示不同功能区 表示金属的种类 表示不同的样本 表示样本 j 中金属 i 的浓度 表示金属 i 背景值的平均值 表示金属 i 背景值的标准差
表示 x i j 标准化后的值
i
Y ij
i
Ik
2011 ICM 优秀论文

Electric Vehicles as a Widespread Means ofTransportationSummaryWith the development of economy and the consumption of energy, electric vehicles are becoming more and more important. So it will be of great significance to study the environmental, social, economic, and health impacts of the widespread use of electric vehicles on a region, and analysis the optimal distribution of the power stations which matching the electric vehicles. It also promotes the development of the electric vehicles industry and provides the government and vehicle manufacturers with useful suggestions.Firstly, this paper establishes a dual network model based on analytic hierarchy process (AHP) to provide a comprehensive evaluation to a region. We establish six basic nodes firstly, and use AHP to evaluate the four secondary node respectively. These form the primary network of our model. Then, we use four secondary nodes to evaluate a region to get the aggregative indicator D. Next, we make a comparison of the D of fuel vehicles and electric vehicles.This paper makes a specific discussion of America, China, Netherlands and Sub-Saharan Africa. We can draw a conclusion that the regions except for the economically backward ones can gain more by promoting electric vehicles. As for the economically backward regions, they can gain earnings after promoting electric vehicles for a period of time.Then we assume the meaning of widely used is that the new vehicles are all EVs when pr edicting the amount of oil saved.Furthermore,we think there are two aspects when consideri ng the oil saved:the saved oil due to the improvement of energy efficiency and the oil saved b y using alternative energy.After that,we use least square method to match and get the number s of new vehicles in one year around the world.And the amount of oil saved is3×1011(L).Next, a multi-objective optimization model is set up in this paper to discuss the optimal plan of power station. We firstly attribute the problem to a multi-objective optimization problem which can make the maximum benefit of environment, society, business and person. Then we simplify the multi-objective and summarize the four aspects of income into the minimum social cost and the output power which can meet the biggest demand of the electric vehicles. Finally, the optimal plan of power station is shown in the table.At last, the strength and weakness of our model are discussed and the future work is pointed as well.Keywords: dual network model; analytic hierarchy process; multi-objective optimization; electric vehicles;1. IntroductionWith the development of the energy consumption and economy, emerging electric cars are in a strong position step by step. First of all, we introduce the basic concepts of electric cars. We mainly study pure electric vehicles in this research which use the charging or battery powered, and do not use other energy driven by motor vehicles. Compared with traditional fuel vehicle, this kind of car in the energy utilization, pollutant emission, etc. has greatly improved. It is introduced the cost of fuel vehicles and electric Vehicles in the chart below.Figure 1 the cost of the two kinds of vehiclesWe study the widespread use of electric cars to the environment, the influence of the social, economic, and health and build a model to evaluate the influence. Then, we use this model to put forward suggestions for the government and the electric car manufacturers. Furthermore, we will calculate the amount of gasoline saved. In addition, based on the previous model, we also need to set up a model to plan the numbers of power station and its form in order to achieve the environmental, social, and business and personal best interests. We decompose the problem into several small problems:●Evaluate basic indicators for four aspects environmental, social, economy and health in a region.● Analyze the weight of basic indicators when evaluating every aspect and establish a model. ● Calculate the total amount of oil saved around the world using the model established. ●Tackle the problem of the establishment of charging station combining with the evaluation modelWe regard this problem the as an evaluation considering the effects of electric car widely used on the geographical environment, social, economic and health and establish the dual network model based on analytic hierarchy process (AHP). At first we find out 6 basic indicators to evaluate every secondary nodes using AHP to analyze the weight. Then we compare the traditional fuel cars and electric vehicles and get a comprehensive index for a region to suggest our government and the electric vehicles manufacturers. As for the problem to establish electricity generation station, we set up a multi-objective optimal model withC o s tminimum of personal cost and business cost.2. Assumptions and justifications●We assume that electric cars researched in the passage are all pure electrical.We only consider the effect of common kinds of fuel cars and electric cars in the model 1.●Assuming that fuel vehicle only cause environmental pollution in the process of using by the exhaust emission and electric vehicles cause environmental pollution in the process of power generation.● We only consider the outside impact of noise pollution to the environment.●When considering the social cost of energy, we only consider the social cost of fossil fuels without the cost of such as wind, water, and solar energy.3. Models3.1 Dual network model based on analytic hierarchy process3.1.1 Introduction of model and method ➢ Network modelWe set up a dual network model based on analytic hierarchy process (AHP). Network model consists of master node: the study area; secondary nodes: economy, society, environment and health; basic nodes: these connections between six basic evaluation index. We use six basic index to evaluate secondary node, and then use four secondary nodes to evaluate each region widely used in electric vehicles under the comprehensive influence. The figure below briefly introduces the double network model:Figure 2 Dual network; six basic nodes of one secondary node➢Analytic hierarchy processAnalytic hierarchy process (AHP) is a complicated multi-objective decision-making problem as a system, the target is to decompose the problem into multiple objectives or principles, or rules, constraints, and multiple index of several levels, through qualitative index fuzzy quantification method to calculate hierarchical single sort (weight) and total ordering, as the target (index), scheme optimization decision method of system.4.1.2 Model BuildingIn order to unify the degree of impact indicators, we will convert them for the value of the degree of influence, in US dollars.4.1.2.1 Six index (six basic nodes)1.Social cost of pollution P1(1)Social cost of air pollution p1Convert the emissions caused by air pollution into social costs:The text indicates air pollution caused by two types of cars in their life cycles as following:From the assumption, we only consider air pollution of fuel vehicles caused by emissions and air pollution of electric vehicles caused by power generation process.The amount of four gas emissions from fuel vehicles and electric vehicles is in the following chart:Table 1 Comparison of emissions of fuel vehicles and electric vehiclesThe date in table 1 are from document[1].The scaling factor of CO,HC,NO x,CO2are respectivelyω1、ω2、ω3、ω4 . Thecalculation formula of P1is:p1=0.256∙n∙(ω1∙a1+ω2∙a2+ω3∙a3+ω4∙a4)(1)(2)social costs of noise pollution p2We convert noise pollution into social costs. From the assumption, we only consider the impact of noise pollution generated by car on the environment.Table 2 Noise of fuel vehicles and electric vehicles under different speed (unit: dB)Take the average of noise according to different speeds, and convert noise pollution into social costs:d1=72(db)(2)p2=0.037∙n(3)d2=66(db)(4))∙n(5)p2′=0.037∙(d2d10.037dollars/km is social cost of pollution per kilometer of fuel vehicles;d1、d2are respectively the noise average of fuel vehicles and electric vehicles;p2、p2′are respectively social costs of noise pollution caused by fuel vehicles and electricvehicles.P1=p1+p2(6)2. Electric vehicles profits P2P2=P0×n(7) P0is the net profit of an ordinary electric car.Table 3 several kinds of cost about vehiclesserial number projectelectric vehiclefuelvehicleThe ratio ofcost between them2 energy costs 3151924.15%3costs ofmaintenance5967 6316 94.48%4Basically thesame costs943 943 100.00%5A total costin the life cycle208182985169.74%In a similar way P2′is a fuel vehicles profit of equal quality.Some Analysis:This profit includes many aspects, including the promotion of science and technology by electric vehicles and the promotion of automobile industry.3. Social cost of annual energy consumption P3According to the assumption, there is no other alternative energy.P3 is the initial energy value converted from annual energy consumption of different cars.It is a comparison figure between fuel vehicles and electrical vehicles about overall efficiency below:Figure 3 Energy conversion efficiency of fuel vehicles and Electric Vehicles Through the Figure 3, we can get:η1=12% (8) η2=20.8% (9) P 3=Eη1∙n ∙ε (10)P 3′=Eη2∙n ∙ε (11)η1、η2 are overall efficiency of fuel vehicles and electric vehicles. Suppose each energyefficiency in their life cycle is q i .”E” is a car’s total energy consumption in one year. ε is US current electricity price, unit: dollars/kW ∙h.4. Social costs of energy consumption when there is alternative energyAccording to the assumption, we only consider the social costs of fossil fuels, excluding social cost of wind energy, hydropower, solar energy and other alternative energy.We suppose that fuel vehicles have no alternative energy and only get energy from fossil fuels; electric power in electric vehicles depends on energy distribution characteristics of each region:E ′=∑(αi ∙λi ∙E) (12)And we can get the formula:P 4=Eη1∙n ∙ε (13)87%83%83%83%12%100%95%36%34%28%20.80%Fuel vehiclesElectric VehiclesP4′=E−E′η2∙n∙ε(14)E represents a total amount of energy;E′is the total amount of energy consumed when there is alternative energy;αi represents the utilization of various energy sources;λi represents energy structure for electric power generation in each region.5. Recovery cost P5Fuel vehicles include the cost recovery of vehicle non-recyclable solid waste on the environment P5;electric vehicles include the cost recovery of vehicle non-recyclable solid waste on the environment and waste batteries P5′.6. The impact on employment P6Table 5 Employment impact of the deployment of electric vehiclesIndustryBaselinescenarioHighpricescenarioOperatorsubsidiesscenarioEmployment growthCharginginfrastructure178163411579472778Batterymanufacturing600658063081168 Overallgrowth238229492209553946Employment lossesGasstationattendant-23152-37353-42906Partsmanufacturer-39287-63386-72809Skilledworker-46605-75192-86370 Totallosses-109043-175931-202085The netemploymentimpact1291853162873518614.1.2.2 Evaluation for 4 main aspects using six indicatorsWe just use several indexes that have the larger correlation with these four nodes to evaluate them respectively, the method is AHP (Analytic Hierarchy Progress). The procedures are as follow:Step1 Build hierarchical structureThe hierarchical structure that AHP required is always constituted by the following three structures:1. Target hierarchical (the highest level): The intended target of issue.2. Criterion hierarchical (the intermediate layer): The criterion that influences the achieving the goal of the issue.3. Measure hierarchical (the lowest level): The measures that achieve the goal of the issue.The hierarchical structure is the figure below:Figure 4 the hierarchical structureStep2 Build pairwise comparison matrix➢Confirm the importance of scale valuesContra posing the norms of judging matrix, proceed the pairwise comparison to find which is more important and how much it is. Use 1-6 to assign the importance degree (the importance scale value can be seen in the form below)Table 6 Importance meaning scale tableTheimportancescale valueMeaning1 Indicating that when comparing two elements, they sharethe same importance. 3 Indicating that when comparing two elements, the former isslightly more important than the latter. 5 Indicating that when comparing two elements, the former isobviously more important than the latter. 7 Indicating that when comparing two elements, the former isintensively more important than the latter. 9 Indicating that when comparing two elements, the former isextremely more important than the later. 2,4,6,8 Indicate the median of the above-mentioned judgment. ReciprocalIf the ratio of importance of element i and element j is a ij , then the ratio of importance of these two elements isa ji =1a ij ⁄.➢ Pairwise comparison matrixCompare the various factors of the importance with the weight of the object. And we assume that there are n objects (A 1,A 2,A 3…A n ) and the weight of them respectively are w 1,w 2,w 3…w n .If proceed the pairwise comparison of their weight, the ratio (relative weight) can constitute a n ×n pairwise comparison matrix.1,11,21,111212,12,22,21222,1,2,12/////////n n n n n n n n n n n n a a a w w w w w w a a a w w w w w w A aa a w w w w w w ⎛⎫⎛⎫⎪ ⎪ ⎪ ⎪== ⎪ ⎪ ⎪ ⎪ ⎪⎝⎭⎝⎭ (15)Step3 Calculate the weight vector➢ Normalize to calculate the weight vecto rThe sum of every line of the pairwise comparison is just in direct proportion to the weight vector W = (w 1, w 2,…, w n )T . That is1,12,21,j n j j n j n a w a w a w =⎛⎫⎛⎫ ⎪ ⎪ ⎪ ⎪∝ ⎪ ⎪ ⎪ ⎪ ⎪⎝⎭⎝⎭∑ (16)Choosing the appropriate scale factor to make the sum of the numerical value of each importance factor is 1.The normalized numerical value of importance factor is called weight. The importance vector is called weight vector. By this way, we get a weight vector.W 1=(w 1w2⋮w n) (17)The weight of elements in the formula above shows the comprehensive ranking of the importance of each factor.➢ Solve the characteristic equation to get the weight vector1,11,21,112,12,22,22,1,2,n n n n n n n n a a a w w a a a w w AW n nW a a a w w ⎛⎫⎛⎫⎛⎫⎪ ⎪⎪ ⎪ ⎪ ⎪=== ⎪ ⎪ ⎪ ⎪ ⎪ ⎪ ⎪⎝⎭⎝⎭⎝⎭ (18)W is the eigenvector of the pairwise comparison matrix A and its corresponding eigenvalueis n. The theory that n is the only maximal eigenvalue of A has been proved strictly. According to the analogy, we can also use the way of solving the characteristic equation to get the importance vector.W 2=(w 1′w 2′⋮w n′) (19)Step4 Consistency checkWe use n’ to indicate the maximal eigenvalue with deviation, then the difference betweenn and n’ reflects the degree of difference. Considering the influence of the number of factors, Saaty definedCI n nn =--'1 (20)As a coincidence indicator. When CI=0, the pairwise comparison matrix A goes all the way or there exists inconsistency. The degree of inconsistency is bigger as the CI is bigger. Saaty then also defined a consistency ratio CR to determine the allowed range of the degree of inconsistency. WhenCR CI RI =</.01 (21)We reckon that the consistency can be accepted and it won’t affect the qualitative results of the sort. The values of formula (20) are shown as the table below.4.1.2.3 Evaluation for D using 4 main aspectsWe calculate the impact of six basic indicators on the four aspects:C i =∑φij ∙Pj 6j=1 (22) j represents these six basic indicators, i represents four secondary nodes.Calculate the comprehensive influence value of a district produced by the four factors:D =∑C i 4i=1 (23)C 1 shows the influence on the society produced by the six basic indexes; C 2 shows the influence on the economy; C 3 shows the influence on the environment; C 4 shows the influence on the health.And widely use of vehicles has negative effect to health and environment therefore, C 3and C 4 are negatively related to D while C 1 and C 2 are positively related to D.4.1.2.3 Results and analysisUsing the analytic hierarchy process (AHP), we gain the six basic index weights of the four secondary nodes environment, economy, health, society. And six weights of health is the chart below:Table 7 Comprehensive influence on the four aspectsSo we can see that P 1, P 5 are more important to health.Consistency analysis: CR = 0.0244 < 0.1.So the consistency can be received.Then, we choose four countries and districts:USA, China, Netherlands and Sub-Saharan Africa. Substitute them into the model and then get the value of P, C, D. We use the line chart below to show the value of D. The red line is electric vehicle and the blue line is fuel vehicle.USA ChinaNetherlands Sub-Saharan AfricaFigure 5 the value of D in four countries●According to the chart above, we can find that different districts have different value ofD. But after comparing, we can easily know that in the most of districts or time, the D ofelectric vehicle always exceeds the D of fuel vehicle. That means in this passage, we assume that after the annual increase of fuel car is replaced by the electric car, on the other word, the electric car is widely used, we will get more profits than using the fuel car.●It is interesting to note that through the further analysis of the results, we can find themore advanced the economy is, the bigger the D value has, which means the profitsproduced by the popularization of the electric cars are more. Of course it more depends on the number vehicles.However, in place like Africa south to Sahara,popularizing ,in early times,can't make profit as much as automobiles using fuel.This is because fixed investment ,in earl y time,demand time to get payback but sales of cars in Africa is conspicuously at a low situation.In order to discuss what actions should varied countries andmerchants take to support ele ctrical automobiles, we in here convey a research to four aspects between Netherlands and A merica.Figure 6 the four different ratios of C in two countries● By analyzing the four different ratios of C, We can see that for the Netherlands, its greatestimpact is environment, which is accounted for 38% of the proportion. This is mainly because of its very high rate of energy alternatives of p4 and the wind power generation of Netherlands accounts for 56% of the total energy. If we implement electric vehicles, the automotive emissions of pollutants significantly will be reduced, while the environment is also the largest gains. ● For the United States, the widespread implementation of electric vehicles will make thegreatest impact on the economy and the environment, which respectively accounted for 38% and 32%. This is mainly because the US auto base, it is also significantly reduce emissions of pollutants. ● From the analysis, we can see that for the government that promoting electric vehicles bothin the environment and in the economy has more advantages than disadvantages. Also, if the government develop new energy sources and seek more green pollution-free alternative energy to power supply, it will bring great benefits to environment. For manufacturers, car sales have to take into account. In developed areas, there is no doubt that implementing electric vehicles has more profitable. But in the general area, it will sustain losses in business in initial stage.Econo mySocietyHealthEnviro nmentNLDEcono mySocietyHealthEnviron mentUSA4.2 Predicting the amount of oil saved4.2.1 Problem analysisWe will calculate the amount of oil saved in the model 1 under the circumstances of electrical vehicles widely used and there are two aspects we should consider:➢The oil saved due to the utilization ratio of energy comparing electric vehicles and fuel cars.➢The oil saved by using alternative energy to generate power.4.2.2 Model building1.Predict the number of electric vehicles promoted to use in the world every yearUsing the least square method, we fit each year the number of cars Nv̂(t)to predict the number of electric vehicles promoted to use in the world every year.∆Nv=Nv̂(t+1)−Nv̂(t)(24) 2.We can calculate the energy saved V1due to the energy utilization ratio ηand the energysaved V2using alternative energy considering P4 and P5:{V1=Yα∙η2∙∆Nv∙∑λiV2=Yα∙ΔNv∙(1−∑λi)(1η2−1η1)V=V1+V2(25)Symbol description:Y represents annual average fuel consumption of fuel cars (L);αrepresents the current international oil prices ($/L);η1,η2represent efficiency of energy utilization of electric vehicles and fuel cars;∆Nv represents the average annual growth number of EVs;λi represents the ratio of the alternative energy;V1 ,V2are the amount of oil widely using EVs.4.2.3 Results and analysisWe use least square method to get the expression of Nv(t) :Nv (t )=4.92×10⁷×t −9.785×10¹⁰ (26)Fitting diagram is as shown below:Figure 7 the expression of Nv −tSo we can calculate the result:∆Nv =4.92×10⁷Figure 8 the proportion of the alternative energy in the worldThrough the Figure 8, the proportion of the alternative energy in the world is ∑λi =21.8%, so we can calculate the amount of oil saved:V 1 =1.1917×10¹¹ (L )8tV2=1.8086×10¹¹(L)V=3×10¹¹(L)V equals the amount of oil assumed in China for one year so it is very considerable. But the value is based on the assumption that new cars for one years are all EVs, so if we let V plus ten years, we will get a value that match twice of the assumption of oil for one years. Not to mention the fuel car before replacement for electric cars, the oil saved is more objective.4.3 A multi-objective optimization model4.3.1 Model analysisTask three requires us to establish a model of the number and form of generators, which matches the established one of electric vehicles. We attribute the problem to a multi-objective optimization problem in order to maximize the income of the environment, society, business and individuals. To simplify the problem, we summarize the above four aspects of income as follow: social costs are minimized and the output electrical energy meets the maximum demand.4.3.2 Model building➢Social costAssuming that in different kinds of power plants, the generators are of the same quantity and differ only in types. Social costs include the cost of generating electricity by power stations and the cost of pollution during producing energy.(1) Electricity cost WElectricity cost consists of three parts: the investment cost (W1) to construct a power station, the management cost (W2) and the energy cost (W3) to produce electricity.W1=∑k i gN i(27)W2=∑a i gN i(28)W3=∑b i gN i(29)W=W1+W2+W3(30) k i represents the cost of each generator when using i of producing electricity;g represents the number of generators in a power station.N i indicates the quantity of power stations using the i generation form. i(i=1,2,3…)stands for various kinds of energy resources respectively – hydropower, wind energy, solar energy, tidal energy, etc.a i represents the management cost of each generator of different types.b i represents costs of different generators to consume equivalent energy resources while producing unit electricity.(2) Cost of pollution U (Environmental costs)Pollutants include CO2,NO x,SO2,PM.U=∑∑P∙λij ∙d j∙r ji(31)λi represents the ratio of that kind of energy in the area;d j represents the emission rates of pollutants above, j=1,2,3,4;r j indicates equivalent social costs of pollutants above;P=∑n mωmm(32)P stands for the required energy in order to meet the quantity and form of electric vehicles in task one.n m represents the number in the m-th form of electric vehicles.ωm represents the required energy of each one in the m-th form of electric vehicles.To get the total social cost:min (W+U)(33)➢Output electrical energy∑N iαi g≥P(34)➢Objective function{min(W+U)∑N iαi g≥P(35)4.3.3 Results and analysisWe select New York as our object of study, and get data from National Energy Administration. Then calculate the answer by LINGO. The answers are as follow:Table 8 the result of question threeP/Kw∙h N1N2N3N46.83×107572101N1 is the number of thermal power plantN2 is the number of wind power plantN3 is the number of atomic energy plantN4 is the number of hydroelectric power plantAccording to the answer, it is required to give priority to thermal power. But after taking environment into consideration, the number of other forms of power station has increased apparently.5. Discussion and Conclusion5.1 strengths1. Build a dual network model for the effect in economy, society, environment and health in each area.2. In the result analysis, we analyze four different areas (China, US, Holland and sub-Saharan Africa) with different characteristics and give some suggestions to our government and EV manufactures.5.2 Weakness and Sensitivity1. The models in question 1 only consider electric vehicles,ignoring other forms of electric cars can also affect the consequences2. Ignore charging power and its length's effect on grids.5.3 Contribution1. Put forward 6 basic indexes and comprehensively evaluate the four factors of every district.2. Build a model to evaluate the comprehensive influence on a district produced by the widely used of the electric car and provide reference for the government and manufactures.5.4 Generalize1. The model in question 3 can be applied to the planning and layout of the charging station to achieve the minimum cost of consumer charge and the minimum investment cost of the investors.2. The model of the electric car can be applied to other emerging industry.6. Reference[1] Wang Cheng,(2007),Research on Effect of Electric Vehicles Development to Energy and Environment[2] Zhang Chenxi,(2013), Analysis on electric vehicle integration technology and social comprehensive benefits[3] Gao Ciwei,(2011), A Survey of Influence of Electrics Vehicle Charging on Power Grid[4] Li Zhihui,(2013), The impact of electric vehicle charging stations on the grid[5] BP_Annual_Report_and_Form_20F_2013[6] National Energy Administration of ChinaAppendixTable 1 Environmental impact of fuel vehicles and electric vehicles in their life cycle(units of cars:vehicle/ per thousand people,units of populations:per thousand people)USA 263000 vehicle/ per thousandpeople 784.9208979 808.6085237 798.330NLD 15493 vehicle/ per thousandpeople 467.765591 477.636048 485.889CHN 1370536 vehicle/ per thousandpeople 12.4346384 13.83181271 15.7340SSF 569081 vehicle/ per thousandpeople 18.45607899 19.06166098 19.1686population 2006 2007 2008USA 263000 vehicle/ per thousandpeople 818.3047054 820.8465765 816.07NLD 15493 vehicle/ per thousandpeople 503.8972902 513.5851624 521.694CHN 1370536 vehicle/ per thousandpeople 27.50429284 32.24901945 37.4813SSF 569081 vehicle/ per thousandpeople 26.4024143 28.1 30.3586。
2011全国大学生数学建模竞赛A题获奖论文——一篇
城市表层土壤重金属污染分析的数学模型摘要为研究城市土壤地质环境异常的查证,以及如何应用查证获得的海量数据资料开展城市环境质量评价,研究人类活动影响下城市地质环境的演变模式。
本文通过处理和分析已给数据,给出金属的空间分布说明污染程度和主要原因;建立数学模型确定污染源位置;最后收集其他信息讨论城市地质环境的演变模式。
问题一,利用matlab软件作出位置坐标x、y与八种总金属元素浓度的空间分布图;分析采集的重金属元素浓度所在区域的大致情形。
对采集的重金属元素浓度的数据进行分析,并计算单因子和多因子污染指数,根据土壤污染分级标准判断出不同重金属元素在各功能区的污染程度和各功能区的综合污染程度,其中工业区中铜是所有元素在不同功能区中污染程度最严重的,而工业区和交通区的综合污染程度是最严重的。
问题二,首先利用SAS软件对八种重金属元素在五个城区的含量进行主成分分析,得到八种重金属对各功能区的贡献率,可初步推断出工业生产、交通设施和生活垃圾造成重金属污染。
再利用SAS软件对各城区的重金属进行因子分析,进一步判断八种不同重金属污染的原因,如汞污染的原因为工业生产中三废的排放、交通运输业中汽油的燃烧和汽车轮胎磨损产生的粉尘等。
问题三,根据所给数据,分析重金属污染传播特征,即分别是介质的迁移运动、污染物的分散运动、污染物的累积与转化、污染物被环境介质吸收或吸附、污染物的沉淀,然后利用Matlab软件,采用多元纯二次二项式回归分析方法,分别得到每种重金属元素浓度与坐标的回归方程,并根据该方程利用多元函数求极值的方法确定出污染源的可能位置分别为:As(1878.2634,6003.7263,4.5846),Cd(970.5835,3946.7518,6.5891),Cr(1235.1956,2658.3427,8.5402),Cu(138.4682,6223.4521,3.2461),Hg (1231.5782,2561.5483,5.2478),Ni(12234.2587,5865.1656,23.2461),Pb (2310.68914145.2674,3.2651),Zn(3015.43418642.2365 5.0543);问题四,基于前三问,分析所建模型的优缺点。
2011年美赛真题优秀论文
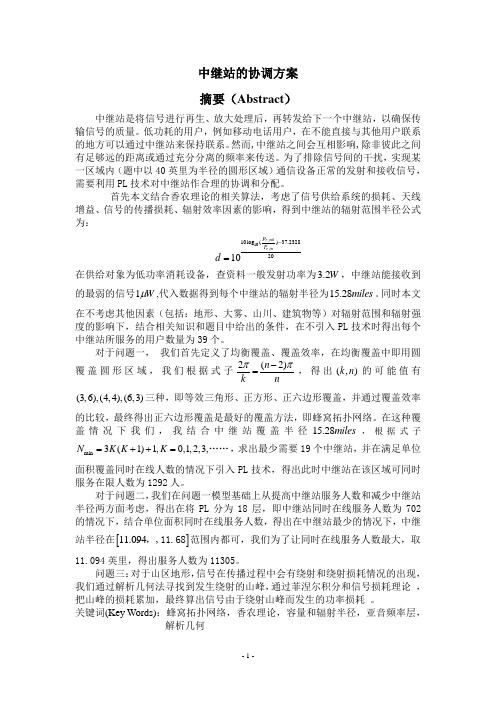
中继站的协调方案摘要(Abstract )中继站是将信号进行再生、放大处理后,再转发给下一个中继站,以确保传输信号的质量。
低功耗的用户,例如移动电话用户,在不能直接与其他用户联系的地方可以通过中继站来保持联系。
然而,中继站之间会互相影响,除非彼此之间有足够远的距离或通过充分分离的频率来传送。
为了排除信号间的干扰,实现某一区域内(题中以40英里为半径的圆形区域)通信设备正常的发射和接收信号,需要利用PL 技术对中继站作合理的协调和分配。
首先本文结合香农理论的相关算法,考虑了信号供给系统的损耗、天线增益、信号的传播损耗、辐射效率因素的影响,得到中继站的辐射范围半径公式为:,10,10log ()37.23282010r outr inp P d -=在供给对象为低功率消耗设备,查资料一般发射功率为3.2W ,中继站能接收到的最弱的信号1W μ,代入数据得到每个中继站的辐射半径为15.28m iles 。
同时本文在不考虑其他因素(包括:地形、大雾、山川、建筑物等)对辐射范围和辐射强度的影响下,结合相关知识和题目中给出的条件,在不引入PL 技术时得出每个中继站所服务的用户数量为39个。
对于问题一, 我们首先定义了均衡覆盖、覆盖效率,在均衡覆盖中即用圆覆盖圆形区域,我们根据式子2(2)n k n ππ-=,得出(,)k n 的可能值有(3,6),(4,4),三种,即等效三角形、正方形、正六边形覆盖,并通过覆盖效率的比较,最终得出正六边形覆盖是最好的覆盖方法,即蜂窝拓扑网络。
在这种覆盖情况下我们,我结合中继站覆盖半径15.28m iles ,根据式子m i n 3(1)1,0,1,2,3,N K K K =++=……,求出最少需要19个中继站,并在满足单位面积覆盖同时在线人数的情况下引入PL 技术,得出此时中继站在该区域可同时服务在限人数为1292人。
对于问题二,我们在问题一模型基础上从提高中继站服务人数和减少中继站半径两方面考虑,得出在将PL 分为18层,即中继站同时在线服务人数为702的情况下,结合单位面积同时在线服务人数,得出在中继站最少的情况下,中继站半径在[]11.094,,11.68范围内都可,我们为了让同时在线服务人数最大,取11.094英里,得出服务人数为11305。
2011MCM美赛A题论文 repeater coordination

2 General observations
In this section we discuss observations of the problem statement, ambiguities, and general assumptions we have made to simplify and clarify the modeling process. Additional clarification of some assumptions is provided in the appendices.
Optimal Placement of Radio Repeater Networks
Control #10754 February 14, 2011
Abstract In this paper we consider the problem of placing radio repeaters to serve users in an area. Given a population distribution and geographical map, we use a hillclimbing algorithm to find a minimum number of repeaters required to cover an area and then a genetic algorithm to provide maximal population coverage and network connectedness. We then use hill-climbing techniques to allocate subnetworks based on population size at repeater locations so that two arbitrary users can communicate even when all other users are communicating over the maximum number of possible networks. Our resulting algorithm is capable of producing a range of repeater network allocations, from robust networks that are capable of handling worstcase usage scenarios to smaller networks that provide optimal population coverage and connectivity. On a set of real-world population and geography data, we found that the combination of the hill-climbing and genetic algorithms had 28% better population coverage than a control algorithm did, as well as higher connectivity.
- 1、下载文档前请自行甄别文档内容的完整性,平台不提供额外的编辑、内容补充、找答案等附加服务。
- 2、"仅部分预览"的文档,不可在线预览部分如存在完整性等问题,可反馈申请退款(可完整预览的文档不适用该条件!)。
- 3、如文档侵犯您的权益,请联系客服反馈,我们会尽快为您处理(人工客服工作时间:9:00-18:30)。
For office use only
T1________________ T2________________ T3________________ T4________________
Team Control Number
10709
Problem Chosen
B
For office use only
F1________________
F2________________
F3________________
F4________________
2011 Mathematical Contest in Modeling (MCM) Summary Sheet
(Attach a copy of this page to each copy of your solution paper.)
Type a summary of your results on this page. Do not include
the name of your school, advisor, or team members on this page.
The Coordination of Repeaters Based on the Frequency Division Multiplexing Theory
Abstract
A repeater is an automated device that extends the range of communications. Interference occurs if repeaters are not far enough apart or transmit on very close frequencies. Our goal is to create an optimal system which has the minimum number of repeaters while achieving high capacity with limited spectrum width.
We develop a theoretical model to give a rough estimation of the necessary repeater numbers considering factors such as the radius of the area, the radius of the repeater’s coverage, the number of the simultaneous users, and the available spectrum width.
Problem I is solved by two steps. One key issue is to cover the whole area seamlessly and to minimize the overlapping area of the adjacent repeaters’ coverage, thus reducing the co-frequency interference. Regular hexagons are chosen to fill the given area seamlessly instead of circles. Another vital issue is to accommodate 1000 users at the same time. We establish frequency division multiplexing model to solve the insufficiency of the spectrum width. By dividing the available spectrum width, we attain channels that only meet 24.6% of the total demand. We improve the user capacity by divide the area into cells and multiplex the spectrum width in cells far apart to meet the demand. We calculate that at least 13 repeaters are needed.
In problem II, as the number of simultaneous users increases from 1,000 to 10,000, while the given spectrum width and the number of PL remain unchanged, we need further expansion of the user capacity. Our model is the combination of the frequency division multiplexing model and the cell division model, and designed to solve the conflict between the rapidly increasing demand and the limited spectrum width. We adopt cell division model to divide the original cells into a proper number of micro cells, and again apply frequency division multiplexing model to the micro cells, thus greatly improving the user capacity. So the result is that 122 repeaters are needed.
In problem III, the changes of environment in mountainous areas are analyzed on its influence in communication. We contract a simulation model utilizing MATLAB software considering factors such as the height and the gradient of the mountain and apply it to 3 kinds of conditions. These situations involving in communication failure caused by mountains are analyzed. We calculate and generate the placement of the repeaters to overcome the difficulties in line-of-sight propagation caused by mountainous areas.
Combining the frequency division multiplexing model and the cell splitting model, our model can be successfully adopted to solve the insufficiency of spectrum resources and meet the rapidly increasing demand for radio communication.。