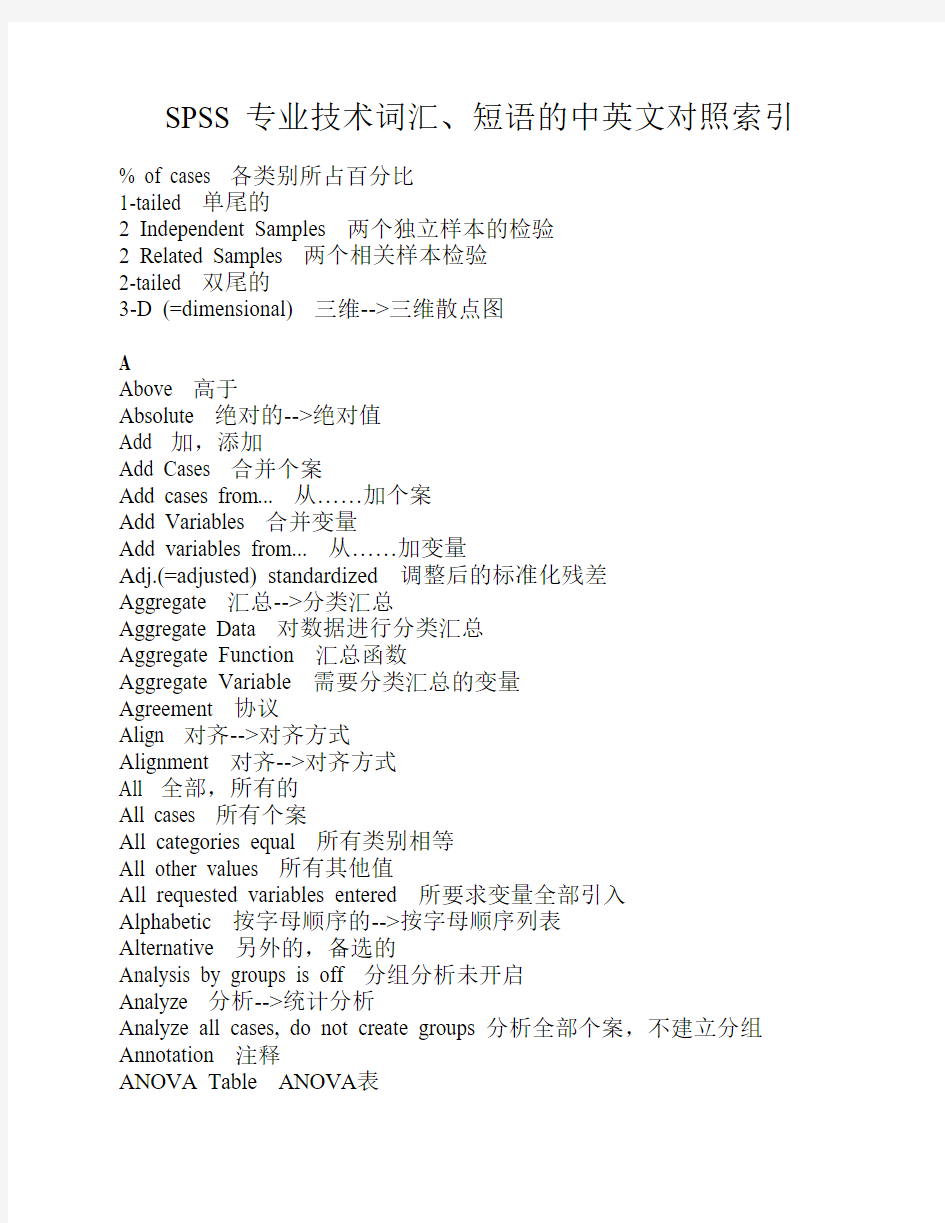
SPSS统计分析最全中英文对照 表

- 1、下载文档前请自行甄别文档内容的完整性,平台不提供额外的编辑、内容补充、找答案等附加服务。
- 2、"仅部分预览"的文档,不可在线预览部分如存在完整性等问题,可反馈申请退款(可完整预览的文档不适用该条件!)。
- 3、如文档侵犯您的权益,请联系客服反馈,我们会尽快为您处理(人工客服工作时间:9:00-18:30)。
SPSS 专业技术词汇、短语的中英文对照索引% of cases 各类别所占百分比
1-tailed 单尾的
2 Independent Samples 两个独立样本的检验
2 Related Samples 两个相关样本检验
2-tailed 双尾的
3-D (=dimensional) 三维-->三维散点图
A
Above 高于
Absolute 绝对的-->绝对值
Add 加,添加
Add Cases 合并个案
Add cases from... 从……加个案
Add Variables 合并变量
Add variables from... 从……加变量
Adj.(=adjusted) standardized 调整后的标准化残差
Aggregate 汇总-->分类汇总
Aggregate Data 对数据进行分类汇总
Aggregate Function 汇总函数
Aggregate Variable 需要分类汇总的变量
Agreement 协议
Align 对齐-->对齐方式
Alignment 对齐-->对齐方式
All 全部,所有的
All cases 所有个案
All categories equal 所有类别相等
All other values 所有其他值
All requested variables entered 所要求变量全部引入
Alphabetic 按字母顺序的-->按字母顺序列表
Alternative 另外的,备选的
Analysis by groups is off 分组分析未开启
Analyze 分析-->统计分析
Analyze all cases, do not create groups 分析全部个案,不建立分组Annotation 注释
ANOVA Table ANOVA表
ANOVA table and eta (对分组变量)进行单因素方差分析并计算其 η 值Apply 应用
Apply Data Dictionary 应用数据字典
Apply Dictionary 应用数据字典
Approximately 大约
Approximately X% of all cases 从所有个案中随机选择约 X%的个案Approximation 近似估计
Area 面积
Ascend 上升
Ascending counts 按频数的升序排列
Ascending means 按均值升值排序
Ascending values 按变量值的升序排列
Assign 指定,分配
Assign Rank 1 to 把秩值 1 分配给
Assume 假定
Asymp. Sig.(=Asymptotic Significance) (2-sided) 双尾渐近显著性检验Automatic 自动的
Automatic Recode 自动重新编码
Axis 轴
Axis Title 横轴名称
B
Back 返回-->上一步
Backward 向后-->向后剔除法
Bar chart 条形图
Bar Spacing 条形间距
Bars Represent 条的长度所代表的统计量
Based on negative ranks 基于负秩
Based on time or case range 在给定范围内随机选择个案
Below 低于
Between Groups (Combined) 组间值
Binomial 二项分布
Bivariate 双变量的-->双变量相关分析
Bivariate Correlations 双变量相关分析
Both files provide cases 是由外部文件和当前文件二者都提供个案Bottom 底部-->下边框
Break Variable 分类变量
Brown-Forsythe Brown-Forsythe检验
Browse 浏览
C
Cache 贮存
Cache Data 数据暂存
Calculated from data 根据数据计算
Cancel 取消
Case 个案
Case Label 个案标签
Case Processing Summary 个案处理概要Casewise 以个案为单位
Casewise diagnostics 个案诊断表Categories 分组数,分类变量,分类模式Categorize Variables 变量分类
Category 类别-->单元格数据类型Category Axis 分类轴
Cell 单元格
Cell Display 单元格显示
Cell Percentages 在每个单元格中输出百分比Cell Properties 单元格属性
Cell Statistics 单元格中的统计量
Center 中心-->居中,中间对齐
Central Tendency 集中趋势
Change 变化,更改
Change Summary 改变汇总函数
Chart 图表,图形
Chart Type 统计图类型
Chart values 作图数据选项
Charts 确定生成的图形选项
Chi-square test 卡方检验
Chi-square(χ2)卡方
Choose 选择
Choose Destination Location 选择安装路径Classify 分类
Clear 清除
Close 关闭
Cluster 群,组,分组
Clustered 分组的-->分组条形图
