[新版]英语图表作文写作方法及范文分析.ppt
合集下载
高考英语图表说明文的写作技巧PPT课件

The reason may be that more and more students come to realize that computer has become a must in their future work and everyday life.
However, every coin has two sides, if the students spend too much time playing computer games, it will do great harm to their studies.
As can be seen from the chart,
there was a sharp increase
year by year in the time the students spent on computers, from 5 hours a week on average in 2000 to 20 hours in 2004.
Look at the picture, the students in the school spent about 3 hours a week on computer in 2000, in 2002 they spent about 10 hours a week on computer, and in 2004the number is 20 hours.
In a word, computer has become popular among the students, and how to make full use of them has caused much discussion among people.
如何写好英语图表作文(课件)

3).This is a graph which describes the trend of…… 这个曲线图描述了……的趋势。
4).The data/statistics/figures lead us to the conclusion that……
这些数据资料令我们得出结论……
5).The graph,presented in a pie chart, shows the general trend in……
上周,我们以“谁是你的偶像”为题,在2600名学 生中进行了一次调查(survey)。以下是调查数据:
[写作内容] 根据以上数据,写一篇短 文,包括以下内容: 1.调查时间,调查问题,以 及调查对象; 2.男女生在以明星为偶像 方面的差异; 3.”父母”在男女生偶像 中的排序差异; 4.男女生在以伟人为偶像 方面的异同; 5.你的偶像及理由。
该图以圆形图形式描述了……总的趋势
6)……(year)witnessed/saw a sharp rise in……
……年……急剧上升 7) The number sharply went up to……
数字急剧上升至……
8).The figures peaked at……in(month/year) ……的数目在……月(年)达到顶点,为……
In conclusion, the upward trends suggest that more and more computer users will have access to Internet in the future.
In summary, smoking increased three different times and declined twice, with the last downward trend still continuing.
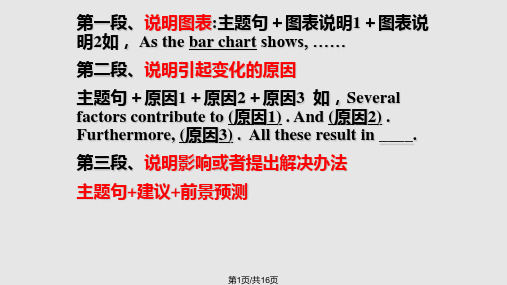
英语图表图画作文写作方法及范文分析

语言表达
• 抓住了所要评论的问题,接着就是先把它 用语言表述出来。在描写中,对数字的运 用要有针对性,不要把图表中的数字全描 写出来。
图一:第一段表达
• Each year thousands upon thousands of graduates flood the job market, waving their college diplomas and certificates, expecting better jobs in their majors, only to be frustrated and disappointed. According to the charts, only 58% percent of college graduates in 1992 could find jobs in their specialties, compared with 89% percent in 1981 when China had its first college graduates after the Cultural Revolution. Why do college graduates find it increasingly difficult to get a rewarding job?
例2
• Rising Divorce Rates in China
Sample
In recent years the divorce rate in China has increased drastically. According to a 1992 Census Bureau report on marriage and divorce in some big cities, during the past five years, the divorce rate has increased as much as it had in the entire previous twenty years. In 1967 there were only 0.5 divorced persons for every 1000 married people, and in 1987 the rate was 7 per thousand, but in 1992 the rate jumped to 15 divorced per 1000 married.
2024届高三英语基础写作:图表作文-调查图表+评价+建议+课件
3. Structure Para. 1 引言及简述调查结果: 更为概括的表述方式,不要求一一列出调查结果中的具体数 据,但要能够正确反映图表中呈现的结果。 Para. 2 评价调查结果 可从减压方法多样性、合理性、有效性以及对减压方式的喜好倾向 等方面切入。 Para. 3 建议 可从学生个人、社团(如英语俱乐部)或学校三个维度思考
Ways to Relieve Stress Para. 1 引言及简述调查结果 Para. 2 评价调查结果 Para. 3 建议
• listen to music 65% • watch videos 80% • do sports 30% • talk to others 40%
引言的相关句子表达 (1) 上周,我们对sb.进行了关于sth.的调查 ① Last week, we carried out / made / did/ conducted/ undertook a survey on sth. among (sb.) ② A survey was carried out among sb. on the theme of... ③ Lask week witnessed a survey conducted by our school on the theme of... (2) 调查结果显示...... The results show/ reveal that students...
As a proud and active member in the reading club, not only can I
appreciate literary works during the weekly gathering, but I can also share insightful 富有洞察力的;有深刻见解的 ideas and make like-minded friends 内容+受益. Besides, I also benefit tremendously: from the rewarding life lessons I learn to the upgraded reading skills now I have 受益. Whenever I
图表图画题型作文英语写作指导PPT课件
第13页/共16页
…. it is generally believed that the above mentioned reasons are commonly convincing. As far as I am concerned, I hold the point of view that ___. I am sure my opinion is both sound and well-grounded.
第7页/共16页
假设你是李华.你将代表学校参加国际中学 生论坛,就你所在城市的教育状况发表演讲。 请根据以下两幅图表,介绍你市高中学生构成情 况及毕业去向的选择,并针对两幅图表中的数 据所反映的情况发表你自己的看法。 注意:
1.文章开头和结尾已经给出; 2.词数100左右(不包括已给部分) 3. 参考词汇: 图表: chart 职业学校: vocational school 外来务工人员: non-local workers
第11页/共16页
Also with the economic development of our city, more foreigners are attracted to set up businesses here and they are happy to send their children to local schools to learn more about China and Chinese culture. In addition, we have more freedom to choose what we would like to do after graduation. Going to college is no longer the only choice for most of us as it was years ago.
英语图表作文写作方法及范文分析PPT课件

• 这种图表用于表示多种事物间的相互关系。
看懂图表要领(2)
• 要善于从众多的数字中抓住主要问题。给 出的图表和数字并不是要求简单的描写, 而是要求通过图表上的数字抓住所反映的 社会问题进行评论。因此从数字中看出主 要问题或现象至关重要。
• 1)借助于题目和指示里的要求来抓主要问 题。
• 2)看一下图表中的哪些数字前后变化最大。
Tips
majors • 3:Graduates who hold jobs in their majors
图一分析
• 一、借助于题目Job Problems for College Graduates,可以看出是关于大学毕业生找工作的 问题。因此尽管表中有许多数字,但只要顺着有 关工作职业的数字,就能发现图表所要反映的问 题。
图二:第一段表达
• Modern sports are becoming more spectatororiented (观赏者为导向的) than participantoriented(参与者为导向的). Just think of millions and millions of people who spend countless hours before TV sets watching sports of all sorts: Olympic Games, World Series Games and the World Cup Soccer Game. According to a survey, among various televised events, sports have the greatest number of viewers. When an important football match is televised live, the streets of a big city are often left
高考英语作文图表作文ppt课件

18
第二步:观察图表中数据的增减总趋势, 阐明原因
Grain, the main food of most people in China, is now playing a less important role and the amount of fruit and vegetables in the average people’s diet has also dropped by 1.5 percent from 2001 to 2005. The amount
Personally I think, students are now freed from heavy burden but their spare time is not well arranged .They are expected to spend more time on what they learn instead of hanging out. More time should be spent not only on green field but also in the libraries to build up themselves physically and mentally .Besides, more interest groups should be established for students to broaden their horizons and sharpen their brains so that they can become more creative eventually .All these will contribute a lot to a well-informed and highly qualified teenager
高中英语作文之图表类作文写法PPT课件

第三段(个人观点)
As far as I am concerned/ I hold the point of view that __. For one thing, ___.For the other, ___.
7
这个学校的教师人数已减少到700人。 The number of teaching staff members in this school has decreased to 700 persons.
8
2020/1/16
9ቤተ መጻሕፍቲ ባይዱ
参加者的人数增加到30万。 The number of the participants grew up to 300000 persons / increased , reaching 300000 persons).
10
这个工厂生产的彩电已由1986年的5000台增加 到1990年的21000台。
As is shown by the figures
indicated
percentage
illustrated
numbers
in the table, graph
picture
pie
chart
___ has been increasing significantly
on the rise rising decreasing
6
that
第二段(分析原因)
There are at least two good reasons accounting for __. On the one hand, __ is due to the fact that __. On the other hand, __ is responsible for __.
- 1、下载文档前请自行甄别文档内容的完整性,平台不提供额外的编辑、内容补充、找答案等附加服务。
- 2、"仅部分预览"的文档,不可在线预览部分如存在完整性等问题,可反馈申请退款(可完整预览的文档不适用该条件!)。
- 3、如文档侵犯您的权益,请联系客服反馈,我们会尽快为您处理(人工客服工作时间:9:00-18:30)。
最新.
13
Tips
• 开头段落在六个数字中仅仅列举了1981和 1992年有关找专业对口的工作的毕业生人 数的两个数字,因为这是文章要重点讨论 的,其余四个数字就不必列出了。
最新.
14
图二Enthusiasm for Sports
100% 80% 60% 40% 20% 0%
Percentage of TV Viewers of Various Programmes
怎样分析和描述图表
(Writing a Composition According to Tables and Graphs)
最新.
1
Table of Contents
• 图表作文和一般作文的区别 • 看懂图表要领(1) • 看懂图表要领(2) • 图一、图二分析
• 易犯错误&解决方法 • 常用数字表达法 • Basic Writing Structure etc. • More Exercises
World Cup Soccer Game. According to a survey,
among various televised events, sports have the greatest number of viewers. When an important football match is televised live, the streets of a big city are often left deserted.
最新.
7
Table(表格图)
• 这种图表用于表示多种事物间的相互关系。善于从众多的数字中抓住主要问题。给 出的图表和数字并不是要求简单的描写, 而是要求通过图表上的数字抓住所反映的 社会问题进行评论。因此从数字中看出主 要问题或现象至关重要。
• 1)借助于题目和指示里的要求来抓主要问 题。
最新.
2
图表作文和一般作文
• 一般作文:在指示中把作文要讨论的问题 或者现象直接用文字告诉你。
• 图表作文:把问题或者现象用图表反映出 来。要求:把图表看懂,并用文字叙述出 来,才能对这个问题或现象展开讨论。
最新.
3
看懂图表要领(1)
• 看懂图表,弄清它所反映的问题或现象。 • 第一,熟悉图表的各种类型,了解它们的
• 2)看一下图表中的哪些数字前后变化最大。
最新.
9
图一(Job Problems for College Graduates)
4% 7%
89%
12%
58%
30%
1981
1
2
3
1992
1
2
3
• 上图1、2 、3分别表示: • 1:Graduates who continue to study • 2:Graduates who take jobs irrelevant to their majors • 3:Graduates who hold jobs in their majors
特点和作用。常见图表有四种:
最新.
4
Pie Chart(饼图)
• 这种图表多数用来表示各种事物在总数百 分之一百中所占的各自比例。
最新.
5
Line Graph(线图)
• 这种曲线图用来表示一种事物的上升趋势 或下降趋势。
最新.
6
Bar Graph(条形棒图)
• 一般用来比较几种事物在同一时期上升或 者下降的情况。
最新.
15
图二:第一段表达
• Modern sports are becoming more spectatororiented (观赏者为导向的) than participantoriented(参与者为导向的). Just think of millions and millions of people who spend countless hours before TV sets watching sports of all sorts: Olympic Games, World Series Games and the
最新.
11
语言表达
• 抓住了所要评论的问题,接着就是先把它 用语言表述出来。在描写中,对数字的运 用要有针对性,不要把图表中的数字全描 写出来。
最新.
12
图一:第一段表达
• Each year thousands upon thousands of graduates flood the job market, waving their college diplomas and certificates, expecting better jobs in their majors, only to be frustrated and disappointed. According to the charts, only 58% percent of college graduates in 1992 could find jobs in their specialties, compared with 89% percent in 1981 when Chin had its first college graduates after the Cultural Revolution. Why do college graduates find it increasingly difficult to get a rewarding job?
最新.
10
图一分析
• 一、借助于题目Job Problems for College Graduates,可以看出是关于大学毕业生找工作的 问题。因此尽管表中有许多数字,但只要顺着有 关工作职业的数字,就能发现图表所要反映的问 题。
• 二、看图表哪些数字变化最大:图表中有三组六 个数字,分别表示毕业生继续读书、找专业对口 的工作和找专业不对口的工作。但以后两组数据 在十年里的变化最大。因此它们就是文章要讨论 的主要问题。
68%
54%
78%
26%
42%
1
NEWS
2
MOVIES
3
SPORTS
4
SPECIALS
5
DOCUMENTARY
• Enthusiasm for Sports. You must write no less than 120 words and explain WHY many TV viewers like to watch sports.