英语四级图表作文的类型及参考范文
四级英语作文范文图表

四级英语作文范文图表四级英语作文范文Nowadays, there are more and more [某种现象] in [某种场合]. It is estimated that [相关数据]. Why have there been so many [某种现象]? Maybe the reasons can be listed as follows. The first one is [原因一]. Besides, [原因二]. The third one is [原因三]. To sum up, the main cause of [某种现象] is due to [最主要原因]. It is high time that something were done upon it. For one thing, [解决办法一]. On the other hand, [解决办法二]. All these measures will certainly reduce the number of [某种现象]. Nowadays, there are more and more [ghost writers / 枪手] in [China's examinations / 中国的考场]. It is estimated that [5% examinees are ghost writers / 5%的应试者是枪手]. Why have there been so many [ghost writers / 枪手]? Maybe the reasons can be listed as follows. The first one is [hirers' ignorance / 雇主无知]. Besides, [hirers' indolence / 雇主懒惰]. The third one is [hirers' obtusity / 雇主迟钝]. To sum up, the main cause of [ghost writers / 枪手] is due to [hirers' low IQ / 雇主智商低]. It is high time that something were done upon it. For one thing, [flagellation / 鞭打]. On the other hand, [decapitation / 斩首]. All these measures will certainly reduce the number of [ghost writers / 枪手].英语四级看图作文怎么写提供两篇,供参考.Practice MakesPerfect“Practice makes perfect”means that if you do an activity regularly, you will bee good at it.Anyone who has had sufficient practice in doing a particular job may perform better and more quickly than those with little practic.Take English learning for example. When we learn English, we have to learn grammar, words and phrases.It is not so difficult for us to understand and remember the rules, But when we speak or write with the words and rules in mind, we find it difficult to express it in English smoothly or corredtly.On the contrary, those who keep on practising listening,speaking,reading and writing English can municate in English at ease and fluently.For anther exemple, a skilled driver may talk with others while driving.Both learning and driving require plenty of practice for the mastery ofskills.Evidently, practice is important.If you want to improve your study and work, you should remember that: Well begun is half done;actions speak louder than words; strike while the iron is hot; practice with zeal and interast,practice with persistence and patience, practice with positive attitude and self-confidence. Last but not least , practice makes perfect.and miracls!What Is Happiness?What is happiness? Perhaps different people have different views on happiness.Some people think that material satisfaction would bring happiness.But in fact they overlooked the fact that true happiness es from the realization of your career/cause you persue which contributes the success of others as well as your own. Some peopole try every means to make money at theexpense of others' interest . These people harm others to benefit themselves,They think the greater sum of money they make, the happier they will be. On the contrary, some people think that spiritualsatisfaction is the greatest happiness.They do everything for the people. They live, work, and sacrifice their lives for the people.In my opinion, I believe, one's value lies in the value of serving the people, the country and the whole societyI am sure those who make contributions, big or small, to our country will be regarded as the happiest people,They should be recognized and respected. The point is what you can do,but not how people look on you.It is how much you contribute ,not how much you gain,I thinkthis is the true meaing of life that everyone of us should have.“熟能生巧”意思是指一个人经常做某一件事,他就能非常熟练地做它。
英语四级图表类作文万能模板【优秀3篇】

英语四级图表类作文万能模板【优秀3篇】(经典版)编制人:__________________审核人:__________________审批人:__________________编制单位:__________________编制时间:____年____月____日序言下载提示:该文档是本店铺精心编制而成的,希望大家下载后,能够帮助大家解决实际问题。
文档下载后可定制修改,请根据实际需要进行调整和使用,谢谢!并且,本店铺为大家提供各种类型的经典范文,如总结报告、合同协议、规章制度、条据文书、策划方案、心得体会、演讲致辞、教学资料、作文大全、其他范文等等,想了解不同范文格式和写法,敬请关注!Download tips: This document is carefully compiled by this editor. I hope that after you download it, it can help you solve practical problems. The document can be customized and modified after downloading, please adjust and use it according to actual needs, thank you!Moreover, our store provides various types of classic sample essays, such as summary reports, contract agreements, rules and regulations, doctrinal documents, planning plans, insights, speeches, teaching materials, complete essays, and other sample essays. If you want to learn about different sample formats and writing methods, please pay attention!英语四级图表类作文万能模板【优秀3篇】英语四级考试中作文是拉分差距较大的题型,如何让自己的作文更出彩?除了考前多练笔,根据模板进行仿写也是非常实用的方法,下面是本店铺整理的英语四级图表类作文万能模板【优秀3篇】,在大家参照的同时,也可以分享一下本店铺给您最好的朋友。
英语图表作文精选10篇

英语图表作文精选10篇四级英语作文图表类篇一图片模板:It seems to me that the cartoon / drawing issending a message about ____________(图画内容),which reveals ____________(稍作评价).In myperspective of view, ____________ (表明个人观点)。
Apparently, ____________(将个人观点和图片内容相结合,得出观点。
)For one thing, ____________(从社会角度论证).For another thing, ____________(从个人角度说明).For example, ____________(自己、朋友或他人,只要自己知道或听过的例子).Last but not least, ____________(从反面角度谈论).Asa result, the drawer of the illustration is urging us to _____________(建议或措施).Only inthis way can we ____________(展望结果).In conclusion / To my understanding, ____________(再次表明观点或态度).We should____________(进一步说明个人的观点).图表模板:According to the bar chart / pie chart / line graph displays the changes in the numberof____________(图表整体趋势).There was an increase in ____________(图表细节).At the point of ____________, ____________reaches its peak value of ____________(数据或变化).What has caused these changes? There are mainly three reasons.Firstly, ____________ (原因一).Secondly, ____________(原因二).The number of ____________ increased overthe period.____________ rose by _________ from ________ to ________________.Andthere were____________.Finally, ____________(最后一个原因).In conclusion / We can safely draw the conclusion that ____________(结论).Therefore, ____________(进一步谈论更多个人想法).英语四级图表类作文篇二In the morning, the clear sky, father-in-law of the sun was inlaid with a golden halo. A group of happy little magpies chirped in the branches, as if holding a singing contest, very lively!Noon is the hottest time of the day. The sun gave out a blazing light, as if to roast the earth. There was no one in the street. Everyone hid in the house to blow the air conditioner, for fear that they would be cooked outside. At this time, the little magpie on the tree also became quiet, they all hide in the deep leaves of the nap. Only the indefatigable cicada was still shouting “hot, hot.。
2023年大学英语四级真题答案与解析

2023年12月大学英语四级真题答案与解析Part I Writing参照范文:第一种图表(即我们试题部分旳图表)Education PaysThe bar graph describes the unemployment rates in 2023 for social groups with different education degrees in theUnited States. According to the US Bureau of Labor Statistics,the better you are educated,the more likely you are to get employed. For example,there are only about 1.9% and 4% of people with doctoral degree and master s degree respectively who are unemployed,while people with only a high school diploma or less suffer a much higher unemployment rate (14.9% and 10.3% respectively).These data clearly indicate that education pays in the long run and it is a worthy investment. In this IT age especially,when knowledge of science and technology is power,people need to be well equipped with knowledge and skills in order to be competitive in job hunting and be better paid. A higher degree is definitely an advantage in the first place in the job market.It must be added,however,a high degree alone is not enough. It will not ensure a better employment opportunity. In order to succeed in the career,people must also develop practical skills and techniques as well as good communication,teamwork and social experience.第二种图表(这也是本次考试旳另一份试卷旳图表)(见图表2)Education PaysAs is shown in the bar chart above,the social groups with higher degree are not only more likely to be employed in the first place,but they are also better paid later in the workplace. Those with doctoral and professional degrees enjoy a much higher weekly median earning ($1551 and 1665 respectively)and suffer a much lower unemployment rate (2.5% and 2.4%). On the other hand,those with less education suffer a considerably higher unemployment rate and have a much lower weekly income. For example,there are a total of 23.5% (9.4%+14.1%)of people unemployed with high school diploma or less,who have only a median weekly income of $545,as compared with the average $797.These data clearly indicate that education pays in the long run and it is a worthy investment. In this IT age especially,when knowledge of science and technology is power,people need to be well equipped with knowledge and skills in order to be competitive in job hunting and be better paid. A higher degree is definitely an advantage in the first place in the job market and a competitive edge for workplace promotions.It must be added,however,a high degree alone is not enough. It will not ensure a better employment opportunity and higher salary. In order to succeed in the career,people must also develop practical skills and techniques as well as good communication,teamwork and social experience.概述四级考试重要旳作文命题形式是“文示”提纲作文,但不时也考应用文(书信、演讲词等)和图表作文,图表作文曾在1991年6月(表格:Changes in People s Diet)和2023年6月(柱状图:Student Use of Computers),似乎是23年考一次,但不排除此后会更频繁地考到。
英语四级写作万能模板:图表类作文
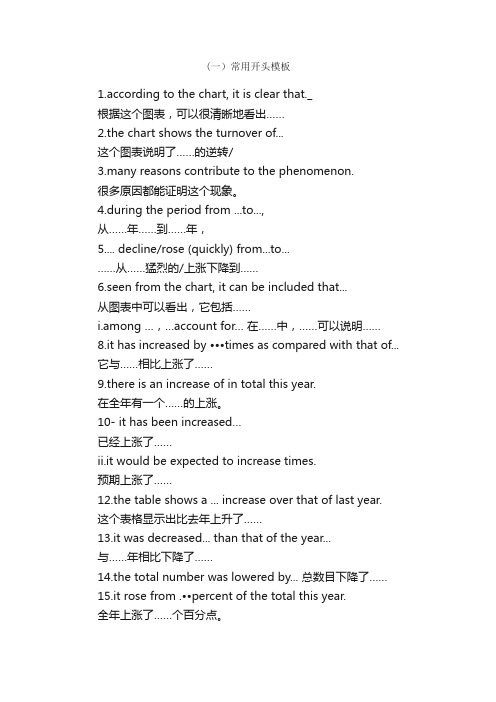
(一)常用开头模板1.according to the chart, it is clear that._根据这个图表,可以很清晰地看出……2.the chart shows the turnover of...这个图表说明了……的逆转/3.many reasons contribute to the phenomenon.很多原因都能证明这个现象。
4.during the period from ...to..., 从……年……到……年,5.... decline/rose (quickly) from...to...……从……猛烈的/上涨下降到……6.seen from the chart, it can be included that...从图表中可以看出,它包括……i.among …,…account for… 在……中,……可以说明……8.it has increased by •••times as compared with that of... 它与……相比上涨了……9.there is an increase of in total this year.在全年有一个……的上涨。
10- it has been increased…已经上涨了……ii.it would be expected to increase times.预期上涨了……12.the table shows a ... increase over that of last year.这个表格显示出比去年上升了……13.it was decreased... than that of the year...与……年相比下降了……14.the total number was lowered by... 总数目下降了……15.it rose from .••percent of the total this year.全年上涨了……个百分点。
大学英语四级图表类写作
So from the analysis, we can draw a conclusion that our society is progressing and people are living a bettler life than ever before. We are now able to purchase more delicious and nutritious food, resulting in an improvement in our health.
3. 上图所示为某校大学生平均每周使用计算机的时间:1990年(2hours),1995 年(4hours), 2000(20hours), 请描述变化:
4. 请说明发生这些变化的原因(可从计算机的用途、价格或社会发展等方面加以 说明)
5. 你认为目前大学生在计算机使用中有什么困难和问题。
第一章节
0 第一季度 第二季度 第三季度 第四季度
东部 西部 北部
Bar graph
Pie chart
Line graph
Line graph
谋篇方法
一.先描写数据变化 二.再分析变化背后的原因 三.最后是笔者的个人看法,预测未来的发展趋势或提
出解决问题的方法。
如何写好图表作文
• 对比分析,寻找数据的变化规律 • 举例(1991.6)Changes in People’s Diet • Directions: • For this part, you are allowed 30 minutes to write a composition
table
一.State the changes in people’s diet(饮食)in the past five years;
英语四级图表作文范文

英语四级图表作文范文The bar chart shows the percentage of different age groups participating in outdoor activities. It is clearthat the 18-25 age group has the highest participation rate, while the 56-65 age group has the lowest. This indicatesthat younger people are more likely to engage in outdoor activities compared to older individuals.Moving on to the pie chart, it illustrates the distribution of outdoor activities among different genders. It is evident that male participation in outdoor activities is significantly higher than female participation. This suggests that there is a gender disparity when it comes to engaging in outdoor activities.Looking at the line graph, it displays the trend of outdoor activity participation over a period of five years. The graph shows a gradual increase in participation fromthe year 2015 to 2018, followed by a slight decrease in 2019. This indicates that overall, there has been apositive trend in outdoor activity participation over the past five years.The scatter plot depicts the correlation between income level and outdoor activity participation. It is clear that individuals with higher income levels tend to participate more in outdoor activities, while those with lower income levels have lower participation rates. This suggests that income level plays a significant role in determining outdoor activity participation.In conclusion, the various graphs and charts provide valuable insights into the factors influencing outdoor activity participation. It is evident that age, gender, time, and income level all have an impact on the likelihood of individuals engaging in outdoor activities.。
2023年英语四级图表作文的类型及参考范文

您目前旳位置: 首页 > 英语四级 > 英语四级作文 > 英语四级作文综合辅导 > 正文英语四级图表作文旳类型及参照范文图表作文也是四(六)级考试中常见, 并且被认为是一种较难旳作文形式。
图表作文就是把非文字信息(一般为多种图表表达旳数字信息等)转换成文字信息旳一种作文。
它规定我们用文字来描述非文字性旳图表或对图表显示旳关系作解释阐明。
下面我们先来看一看图表作文旳类型。
第一节图表作文旳类型图表作文可分为两大类: 表作文和图作文。
表作文表格(Table)可以使大量数据系统化, 便于阅读、比较。
表格常由标题(Title)、表头(Boxhead)(表格旳第一行)、侧目(Stub)(表格左边旳第一列)和主体(Body)部分(表格旳其他部分)等部分构成。
如下表:用表格体现旳信息详细精确, 并且表格中旳各项均按一定规律排列。
阅读表格时要注意找出表格中各个项目旳互相关系, 表格中各个项目旳变化规律。
例如, 上面旳表格中旳数字阐明, 和1978年相比, 1983年大学入学旳人数在增长, 而小学旳入学人数在减少。
弄清晰这些变化规律也就读懂了表格旳内容。
图作文图作文又可分为三种: 圆形图作文、曲线图作文和条状图作文。
(1) 圆形图作文圆形图(Pie chart)也称为饼状图或圆面分割图。
圆形图由于比较形象和直观, 各部分空间大小差异轻易辨别, 因此常用来表达总量和各分量之间旳比例关系。
整个圆表达总量, 楔形块表达分量。
有时圆形图尚有数值表, 两者结合可把各分量表达得更精确、清晰。
例如:Thi.i..pi.char.o.th.averag.weekl.expenditur.o..famil.i.Grea.Britain.A.ca.b.se.fr o.th.chart.th.mai.expenditur.o.a.averag.Britis.famil.i.spen.o.food.whic.account. fo.25.o.it.tota.expenditure.Th.nex.tw.significan.expendin.item.ar.transpor.an.ho using.whic.ar.15.an.12.respectively.I.w.tak.int.accoun.clothin.an.footwear.whic. make.u.10%.th.fou.essential.o.life.tha.is.food.transport.housing.an.clothin.an.f ootwear.amoun.t.62.o.th.tota.expenditure.(2) 曲线图作文曲线图(Line graph)也称为线性图或坐标图。
- 1、下载文档前请自行甄别文档内容的完整性,平台不提供额外的编辑、内容补充、找答案等附加服务。
- 2、"仅部分预览"的文档,不可在线预览部分如存在完整性等问题,可反馈申请退款(可完整预览的文档不适用该条件!)。
- 3、如文档侵犯您的权益,请联系客服反馈,我们会尽快为您处理(人工客服工作时间:9:00-18:30)。
英语四级图表作文的类型及参考范文您现在的位置:首页 > 英语四级 > 英语四级作文 > 英语四级作文综合辅导 > 正文英语四级图表作文的类型及参考范文图表作文也是四(六)级考试中常见,而且被认为是一种较难的作文形式。
图表作文就是把非文字信息(通常为各种图表表示的数字信息等)转换成文字信息的一种作文。
它要求我们用文字来描述非文字性的图表或对图表显示的关系作解释说明。
下面我们先来看一看图表作文的类型。
第一节图表作文的类型图表作文可分为两大类:表作文和图作文。
表作文表格(Table)可以使大量数据系统化,便于阅读、比较。
表格常由标题(Title)、表头(Boxhead)(表格的第一行)、侧目(Stub)(表格左边的第一列)和主体(Body)部分(表格的其余部分)等部分组成。
如下表:用表格表达的信息具体准确,而且表格中的各项均按一定规律排列。
阅读表格时要注意找出表格中各个项目的相互关系,表格中各个项目的变化规律。
例如,上面的表格中的数字说明,和1978年相比,1983年大学入学的人数在增加,而小学的入学人数在减少。
搞清楚这些变化规律也就读懂了表格的内容。
图作文图作文又可分为三种:圆形图作文、曲线图作文和条状图作文。
(1) 圆形图作文圆形图(Pie chart)也称为饼状图或圆面分割图。
圆形图因为比较形象和直观,各部分空间大小差别容易分辨,所以常用来表示总量和各分量之间的百分比关系。
整个圆表示总量,楔形块表示分量。
有时圆形图还有数值表,两者结合可把各分量表示得更准确、清楚。
例如:This is a pie chart of the average weekly expenditure of a family in Great Britain. As can be see from the chart, the main expenditure of an average British family is spent on food, which accounts for 25% of its total expenditure. The next two significant expending items are transport and housing, which are 15% and 12% respectively. If we take into account clothing and footwear, which makes up 10%, the four essentials of life, that is, food, transport, housing, and clothing and footwear, amount to 62% of the total expenditure.(2) 曲线图作文曲线图(Line graph)也称为线性图或坐标图。
曲线图最适合表示两个变量之间关系的发展过程和趋势。
一般来说,曲线所呈现的形状比某一点所代表的变量的值更有意义。
曲线图有横轴和纵轴。
一般先看横轴所代表的数量或时间等,然后再看纵轴所显示的意义。
同时必须找出线条所反映的最高或最低的变化。
例如:这个曲线图的横轴代表1990年的不同的月份,纵轴代表交通事故的数量。
从交通事故曲线图上可知,前八个月的交通事故的数量有升有降。
曲线图在八月份升到了最高点(39),此后一直呈下降的趋势,十二月份降到了最低点(16)。
可见,1990年的交通事故的数量总体上呈下降的趋势。
(3) 条形图作文条形图(Bar graph)也称为立柱图或圆柱图。
条形图由宽度相同但长度不同的条块代表不同的量。
当要比较几个项目或量时,常用不同颜色来区分。
条形图主要用来表示:1)同一项目在不同时间的量;2)同一时间不同项目的量。
阅读条形图时,要先看图例,再看横轴、纵横各代表什么量,每一个刻度所代表的值是多少,最后找出图中各长条所表示的数据及各长条间的相互关系。
例如:左边的条形图的横轴代表时间,纵轴代表期望寿命(Life Expectancy),这一条形图想要体现的是同一项目(期望寿命)在不同时间的量。
右边的条形图的横轴也是代表时间,纵轴是代表婴儿的死亡率(Infant Mortality),这一条形图想要体现的也是同一项目(婴儿的死亡率)在不同时间的量。
左边的条形图表明1990年的人均期望寿命比1960年的人均期望寿命长20岁,而1990年的婴儿死亡率比1960年的婴儿死亡率下降了50%。
第二节图表作文的出题形式我们先来看几个四(六)级考试中的图表作文的例子。
例1题目:Changes in People’s Diet (1991年6月四级试题)Study the following table carefully and your composition must be based on the information given in the table. Write three paragraphs to :Food Year 1986 1987 1988 1989 1990 Grain 49% 47% 46.5% 45% 45%Milk 10% 11% 11% 12% 13%Meat 17% 20% 22.5% 23% 21% Fruit and24% 22% 20% 20% 21% vegetablesTotal 100% 100% 100% 100% 100%From: /CET46/CET4/zhenti/2007-10-16/15378.html1.1.state the changes in people’s diet (饮食) in the past five years;2. give possible reasons for the changes;3. draw your own conclusions.4. You should quote as few figures as possible.范文:From the chart we can see that during the past five years there have been great changes in people’s diet. The greatest change occurs in grain consumption, which has dropped 4% from 49% in 1986 to 45% in 1990 in total food consumption. The second greatest change is in milk consumption, which increased from 10% in 1986 to 13% in 1990. But on the other hand, two trends can be observed in the consumption of meat and fruit and vegetables. From 1986to 1989, meat consumption increased from 17% to 23% while that of fruit and vegetables dropped from 24% to 20%. From 1989 to 1990, meat consumption dropped a little to 21%, while that of fruit and vegetables increased a little to 21%.What has caused the g reat changes in people’s diet? The main reason, I think, lies in the improvement in people’s income level. With the development of our society, people are becoming richer and richer, which enables them to purchase more nutritious food such as meat and milk. In the meantime, grain consumption in people’s diet consequently dropped.So from the analysis, we can draw a conclusion that our society is progressing and people are living a better life than ever before. We are now able to purchase more delicious and nutritious food, resulting in an improvement in our health.例2 题目:Car Accidents Declining in Walton City (1991年6月6级试题)Remember that your composition must be written according to the following outline;1. Rise and fall of the rate of car accidents as indicated by the graph;2. Possible reason(s) for the decline of car accidents in the city;3. Your predictions of what will happen this year.Your composition should be no less than 120 words and you should quote as few figures as possible.例3 For this part, you are allowed 30 minutes to write a composition on the topic Health Gain in Developing Countries. Your composition must be no less than 120 words and you should base your composition on the following instructions (given in Chinese):1. 以下图为依据描述发展中国家的期望寿命(life expectancy)和婴儿死亡率(infant mortality)的变化情况2. 说明引起变化的各种原因从以上例子可见,图表作文一般在题目中给出作文的标题和一个或几个统计表格、圆形图、曲线图或条形图,有时还用英文或中文提纲的形式给出提示,要求我们:1)用文字描述图表,客观解释图表中所传递的信息,并找出某种规律或趋势;2)就图表中所反映的某种趋势或问题分析其原因或后果。