Cu_Groups监控网络
zabbix监控群晖(synology)网卡实时流量带宽
zabbix监控群晖(synology)⽹卡实时流量带宽 之前使⽤zabbix监控的⽹络设备⼀般就是交换机路由器等⽹络设备,最近有个需求,需要监控群晖的⼀些状态,⽐如像内存使⽤率,cpu负载,⽹卡的实时流量等。
当然群晖系统是属于在linux系统上开发的⼀个系统,所以也可以开启root权限,安装zabbix-agent的⽅式去监控,不过开启root不是很安全,毕竟上⾯存的都是些重要资料,最好还是不对系统进⾏修改。
毕竟群晖官⽅也提供了snmp功能,所以我打算使⽤snmp来监控群晖。
那么问题来了...... 使⽤snmp来监控,⾸先得找到需要监控的OID号,还好,群晖提供了⼀个MIB Guide的⽂件,在开启snmp功能页下⾯就有连接。
https:///download/Document/Software/DeveloperGuide/Firmware/DSM/All/enu/Synology_DiskStation_MIB_Guide.pdf 我⼤概翻了⼀下,基本上需要监控的OID都有,我就监控⼀些常⽤的参数。
在监控⽹卡实时流量带宽时,发现⽂档中是没有提供⽹卡的实时流量带宽的OID号的。
⼀般在⼤多数的⽹络设备⼚家都会提供⽹卡的实时速率这个OID。
(也有⽹络设备⼚家没有⽹卡实时流量带宽的OID号)这个时候就需要我们⾃⼰来想办法。
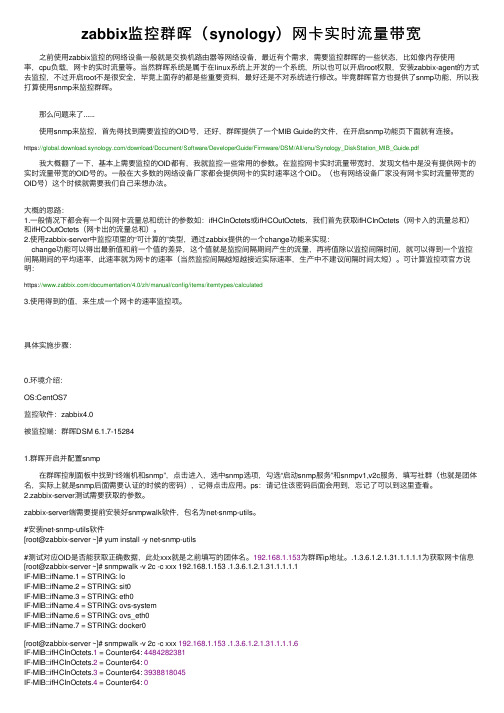
⼤概的思路:1.⼀般情况下都会有⼀个叫⽹卡流量总和统计的参数如:ifHCInOctets或ifHCOutOctets,我们⾸先获取ifHCInOctets(⽹卡⼊的流量总和)和ifHCOutOctets(⽹卡出的流量总和)。
2.使⽤zabbix-server中监控项⾥的“可计算的”类型,通过zabbix提供的⼀个change功能来实现:change功能可以得出最新值和前⼀个值的差异,这个值就是监控间隔期间产⽣的流量,再将值除以监控间隔时间,就可以得到⼀个监控间隔期间的平均速率,此速率就为⽹卡的速率(当然监控间隔越短越接近实际速率,⽣产中不建议间隔时间太短)。
ethereal使用说明

ethereal汉化版用法目录1 Ethereal介绍 51.1 Ethereal为何物? 51.1.1 Ethereal可以帮人们做什么? 51.1.2 界面功能 51.1.3 实时的从不同网络介质抓取数据包 6 1.1.4 导入来自其它抓包工具的文件 61.1.5 为其它抓包工具导出文件 61.1.6 丰富的协议解码器 71.1.7 开放源代码软件 71.1.8 Ethereal不能做什么? 71.2 Ethereal运行平台 71.2.1 Unix 71.2.2 Linux 81.2.3 Microsoft Windows 81.3 那里可以得到ethereal? 81.4 Ethereal的读法 91.5 Ethereal的历史 91.6 Ethereal的设计和维护 91.7 问题报告和获得帮助 91.7.1 Web网站 91.7.2 WIKI 101.7.3 FAQ 101.7.4 邮件列表 101.7.5 问题报告 101.7.6 liunx/unix平台崩溃报告 111.7.7 Windows平台崩溃报告 112 编译和安装ethereal 112.1 介绍 112.2 获得ethereal源代码和应用发布版本 12 2.3 UNIX平台编译ethereal之前准备工作 12 2.4 UNIX平台编译ethereal源代码 132.5 UNIX平台应用版本安装 132.5.1 RedHat 的RPMs方式安装 142.5.2 Debian的安装方式 142.6 解决UNIX下安装失败问题 142.7 Windows下源代码的编译 142.8 Windows下Ethereal安装 142.8.1 安装ethereal 142.8.2 升级ethereal 152.8.3 卸载ethereal 153 用户操作界面 153.1 介绍 153.2 启动ethereal 153.3 ethereal主界面 153.4 “The Menu”主菜单 163.4.1 “File”文件菜单 183.4.2 “Edit”编辑菜单 193.4.3 “View”视图菜单 213.4.4 “GO”跳转菜单 233.4.5 “Capture”抓包菜单 243.4.6 “Analyze”分析菜单 243.4.7 “Statistics”统计报表菜单 263.4.8 “Help”帮助菜单 273.5 “Main”常用工具栏 283.6 “Filter Toolbar”显示过滤器工具栏 303.7 “Packet List”数据包列表窗格 313.8 “Packet Details”数据包信息树窗格 313.9 “Packet Bytes”数据包字节窗格 323.10 “Statusbar”状态栏 324 网络数据包实时抓取 334.1 介绍 334.2 使用Ethereal前的准备工作 334.3 如何开始抓包? 334.4 “Capture Interfaces”抓包网络接口窗口 344.5 “Capture Options”抓包选项窗口 354.5.1 “Capture”抓包常规框 354.5.2 “Capture File(s)”数据包文件框 364.5.3 “Stop Capture…”停止抓包框 374.5.4 “Display Options”显示选型框 384.5.5 “Name Resolution”名称解析框 384.5.6 “Buttons”按键 394.6 数据包文件和文件模式 394.7 “Link-layer header type”链接层数据头类型 40 4.8 抓包过滤器 404.9 抓包状态信息窗口 424.9.1 停止抓包 424.9.2 重新开始抓取 435 数据包文件导入、导出和打印 435.1 介绍 435.2 “Open”打开数据包文件 435.2.1 “Open Capture File”打开数据包文件窗口 44 5.2.2 支持导入文件格式 455.3 “Save As”存储数据包 455.3.1 输出文件格式 465.4 “Merging”合并数据包文件 475.5 “File Sets”文件系 485.6 “Exporting”导出文件 495.6.1 “Exporting as Plain Text File”导出无格式文件 495.6.2 “Export as PostScript File”导出PS格式文件 505.6.3 “Export as CSV(Comma Seperated Values)File”导出CSV(逗号分割)文件 50 5.6.4 “Export as PSML File”导出PSML格式文件 515.6.5 “Export as PDML File”导出PDML格式文件 515.6.6 “Export selected packet bytes”导出被选择数据包数据 525.7 “Printing”打印数据包 535.8 “Packet Range”数据包范围窗格 556 数据包分析 556.1 如何查看数据包 556.2 显示过滤器 606.3 如何书写显示过滤器表达式 616.3.1 显示过滤器字段 616.3.2 比较操作的数据类型和操作符 626.3.3 组合表达式 626.3.4 显示过滤器常见误解 636.4 “Filter Expression”过滤器表达式窗口 646.5 定义和存储过滤器 656.6 搜索数据包 676.6.1 “Find Packet”搜索数据包窗口 676.6.2 “Find Next”寻找下一个 686.6.3 “Find Previous”寻找上一个 686.7 “GO”跳转 686.7.1 “Go Back”后退 686.7.2 “Go Forward”向前 686.7.3 “Go to Packet”跳转到 686.7.4 “Go to Corresponding Packet”跳转到相关数据包 696.7.5 “Go to First Packet”跳到第一个数据包 696.7.6 “Go to Last Packet”跳到最后一个数据包 696.8 标记数据包 696.9 时间显示格式和时间基准点 706.9.1 时间显示格式 706.9.2 时间基准点 707 高级工具 727.1 介绍 727.2 “Following TCP streams”跟踪TCP数据流 727.2.1 TCP数据流跟踪窗口 737.3 Time Stamps时间标记 747.3.1 Ethereal内部时间格式 747.3.2 数据包文件时间格式 747.3.3 时间正确性 747.4 时区问题 757.4.1 什么是时区? 757.4.2 为你的计算机设置正确时间 757.4.3 Ethereal和时区 767.5 数据包重组 767.5.1 什么是数据包重组? 767.5.2 Ethereal如何实现包重组 767.6 名称解析 777.6.1 以太网名称解析(MAC层) 777.6.2 IP名称解析(网络层) 787.6.3 IPX名称解析(网络层) 787.6.4 TCP/UDP端口名称解析(传输层) 787.7 确保数据完整性 787.7.1 Ethereal核对概要 797.7.2 硬件里的概要计算和确认 798 统计 798.1 介绍 798.2 “Summary”统计窗口 808.3 “Protocol Hierrrchy”协议层次统计窗口 81 8.4 “Endpoint”终端统计 828.4.1 Endpoint终端是什么? 828.4.2 终端统计窗口 838.5 会话统计Conversations 838.5.1 什么是会话 838.5.2 会话窗口 838.6 IO曲线图窗口 858.7 服务响应时间统计 869 Ethereal客户配置 879.1 介绍 879.2 定义数据包颜色 879.3 控制协议解析器 899.3.1 “Enabled Protocols”协议解析开关窗口 89 9.3.2 用户配置解码 909.3.3 查看定义的解码方式 919.4 参数选择 921 Ethereal介绍1.1 Ethereal为何物?Ethereal是开源网络数据包分析软件。
Unit+2+Out+of+this+world+Reading+2+课件-

逗号前面是什么成分? as做什么用的?
逗号前是一个as引导的让步状语从句。
as引导让步状从时,从句倒装,as不位于句首。
as 结构为:形容词/副词/名词/动词原形+ +主+谓
(注意:如果是名词位于句首的话,不要带冠词)
Young as he is, he is knowledgeable. (形容词) Much as I respect him, I can not agree with him. (副词) Child as he is, he is very mature. (名词) Try as he might, he still failed in the chemistry experiment. (动原)
➢ 分句性替代:so, not I don’t think so. I’m afraid not.
that引导什么从句? 找到这句话中的虚拟语气。为什么要用虚拟语气?
It’s strange that句式中,that引导的主语从句中用了虚拟语气 (should+do)
It is necessary/ important/ natural/ strange/ surprising that..句型 中,从句常用should + do的虚拟语气(should可省略),表 示强烈的情感色彩。源自Verbs adventure
differ
define reward remark
Nouns
adventure
difference
Adjectives adventurous
different
definition
definite
reward remark
使用Cacti监控你的网络(四)- Cacti脚本及模板
使用Cacti监控你的网络(四)- Cacti脚本及模板(2007-08-30 11:00:55)转载分类:网络监控标签:知识/探索cacti模板脚本rrdtoollinux声明:本系列文档出自石头记,如若转载请注明出处,本人保留文档的所有权,并欢迎转载。
一、Cacti脚本及模板Cacti脚本及模板论坛:/forum-12.html一个完整的cacti脚本及模板列表:/about15067.html1.Advance Ping 脚本及模板下载地址:/about10049.html注:要使用此模板,编译PHP时必须加上--enable-sockets选项来支持套接字。
1).功能:此模板用来监控一个TCP/UDP端口、ICMP的延时情况和丢包情况。
2).下载ss_fping.php脚本并放到/usr/local/apache/htdocs/cacti/scripts/目录下,下载cacti_graph_template_ping_advanced_ping_v1_3.xml模板,用cacti的模板导入页将此模板导入。
3).在Console选项卡下的左侧菜单栏中选择Devices,为要监控的主机新建一个Devices 或选择已有Devices。
在Associated Graph Templates中添加Advanced Pingv1.3模板。
并点击最上面的Create Graphs for this Host链接。
在Graph Templates的选择框中选择PING - Advanced Ping v1.3,然后点击Create按钮,出现以下WEB页。
第一项意思是一次向要监控的端口发送多少个探测包(默认20个),第二项是使用的协议,可以是ICMP、TCP、UDP,第三项是要监控的端口号(只有第二项为TCP或是UDP时使用),填写完成后点击create按钮。
在Console控制台选项卡下的左侧菜单中选择Date Sources,选择以上新建的数据源可以修改以上填写的信息。
fibers polym
ISSN 1229-9197 (print version)ISSN 1875-0052 (electronic version) Fibers and Polymers 2017, Vol.18, No.1, 22-32Ternary Carboxymethyl Chitosan-hemicellulose-nanosized TiO2 Composite as Effective Adsorbent for Removal of Heavy Metal Contaminants from Water Shuping Wu, Jiarui Kan, Xiangzi Dai, Xiaojuan Shen, Kan Zhang, and Maiyong Zhu*Institute of Polymer Materials, School of Materials Science and Engineering, Jiangsu University,Zhenjiang, Jiangsu 212013, P. R. China(Received September 21, 2016; Revised November 14, 2016; Accepted November 18, 2016)Abstract: A ternary composite consisting of carboxymethyl chitosan, hemicellulose, and nanosized TiO2 (CHNT) wasprepared by incorporating TiO2 nanoparticles into the pre-synthesized carboxymethyl chitosan-hemicellulose polysaccharidenetwork. The microstructure and chemical composition of the obtained CHNT was characterized by TEM, SEM, FTIR, andTGA. The adsorption of some toxic heavy metals including Ni(II), Cd(II), Cu(II), Hg(II), Mn(VII), and Cr(VI), onto the as-prepared CHNT composite was investigated. The effects of pH, temperature and contacting time on the adsorption processwere studied. Results revealed that the CHNT composite exhibited efficient adsorption capacity of the above metal ions fromaqueous solution due to its favorable chelating groups in structure. The adsorption process was best described by the pseudo-second-order kinetic model, while isotherm modeling revealed that the Langmuir equation better described the adsorption onCHNT as compared to Freundlich model. Moreover, the CHNT loaded metal ions can be easily regenerated with EDTA andreused repeatedly up to five cycles. The environmental friendly hybrids were expected to be a promising candidate for futurepractical application in heavy metal contaminated water treatment.Keywords: Carboxymethyl chitosan, Hemicellulose, TiO2, Adsorbent, Heavy metalIntroductionEnvironmental contamination by hazardous pollutants is a widespread and increasingly serious problem around the world owing to its long term risk to ecosystems and humans. Among various contaminants, heavy metals undoubtedly can have toxic effect on plants, animals and humans [1]. Therefore, it is essential to develop efficient method to remove undesirable metals from water resources. Nowadays, many techniques including chemical precipitation, ion exchange, coagulation, electrodeposition, solvent extraction, ultrafiltration, and reverse osmosis [2-4], have been developed for the elimination of heavy metal ions. Nevertheless, these methods are limited for wide application either for too high cost or for low efficiency and complex operation processes. Another disadvantage of these methods is the formation of sludge, requiring the additional processes of disposal and confinement. Adsorption technique is considered as a suitable and promising method to remove heavy metals from wastewater due to its flexible operation, high efficiency and low cost. Numerous materials such as activated carbon [5], polymer resin [6], porous silica [7], and so on, are developed as adsorbents for removal of heavy metal contaminants. Unfortunately, the uptake capacities of these materials are low. Meanwhile, they usually remove only a few special species of contaminants. Thus, exploiting novel adsorbent materials with higher adsorption capacities to capture a range of pollutants has attracted increasing interest in recent years.As a naturally occurring biopolymer from crustacean and fungal biomass, chitosan has been received considerable attention for its capability of chemically or physically adsorbing various metal ions [8-12]. It possesses a high ratio of hydroxyl group and amine group, making it conductive to the introduction of new functional groups. These active groups make chitosan efficient in the adsorption of metal ions through coordination or ion-exchange. However, chitosan has few drawbacks such as acidic solubility and low selectivity toward highly toxic heavy metals, which limit the application of chitosan as effective sorbent. So it is desirable to modify chitosan through the introduction of new complexation groups for enhanced its adsorption performance [13-17]. The carboxymethylation of chitosan is regarded as a good chemical modification technique to improve its specificity and capacities toward metal ions [18-21]. Carboxymethyl chitosan (CMC) has many reactive functional groups such as amino group, carboxyl group and hydroxyl group, can reinforce the adsorption selectivity by chelating with metal ions. In spite of its multifunction, the application potential of CMC as sorbent has not been fully commercial development due to water-solube. So chemical cross-linking would provide the potential for regeneration and reuse of adsorbent based on CMC.H emicelluloses (H Cs) are branched biopolymers of low molecular weight with a degree of polymerization in the range of 80-450, which account for 25-35% of lignocellulosic biomass and are the second most abundant polysaccharides after cellulose [22]. HC has abundant hemiacetal hydroxyl groups, which can react with the amino groups of chitosan or chitosan derivatives to form Schiff base compounds via Maillard reaction [23-25]. In addition, Schiff base compounds have the ability to form selective stable complex with heavy*Corresponding author: maiyongzhu@DOI 10.1007/s12221-017-6928-y22CHNT for Removal of Heavy Metals Fibers and Polymers 2017, Vol.18, No.123metals [26-28]. Therefore, cross-linked copolymerization between HC and CMC would open new channels for their exploitation and utilization. Meanwhile, inorganic particles, such as clay [29], diatomite [30], Al2O3 [31], SiO2 [32], Fe3O4 [33], and TiO2 [34,35], have been introduced into the molecular network of polymer materials and can be effective on improving the adsorption performance of adsorbents [6, 36]. Among them, nanosized titanium oxide (TiO2) has been received more attention due to its physical and chemical stability as well as high surface area. TiO2 as a nanofiller can effectively improve the three dimensional molecular network and increase the surface area for metal adsorption. Aliabadi et al. developed the chitosan/TiO2 composite nanofibrous adsorbents for adsorptive removal of Cu(II) and Pb(II). They noted that adsorbents increased the metal ion uptake ability and showed a sign of selectivity in order of Cu(II) > Pb(II) [37]. Keshtkar et al. reported a polyacrylonitrile-TiO2 nanofiber adsorbent fabricated by electrospinning is effective for the removal of Th(IV), Ni(II) and Fe(II), and the nanofiber adsorbent possesses large surface area, desired mechanical strength, and chemical stability [38]. Mahdavi observed that TiO2 nanoparticles modified with humic acid as adsorbents can efficiently remove Cd(II), Cu(II) and Ni(II) [39]. Although the cross-linked/inorganic hybrids have significantly improved the adsorption performance and stability of absorbents, most of the chemical cross-link reagents are expensive, toxic and difficult to prepare, disadvantageous to the broad application. It is necessary to further develop or improve CMC-based adsorbent material that is efficient, eco-friendly, and sustainable.Thus, in this study, a facile method was used to synthesize high performance ternary composite composed of CMC, HC and nanosized TiO2. The morphology and structure of the CH NT were investigated and the adsorption capacities of various heavy metals including Ni(II), Cd(II), Cu(II), Mn(VII), H g(II) and Cr(VI) were evaluated. This work could provide some basic information for the treatment of actual wastewater.ExperimentalMaterialsHC was purchased from Shanghai Hanhong Ltd. (China). Titanium oxide nanopowder (Degussa P25) and sodium dodecyl sulfate (SDS) were purchased from Sigma-Aldrich. CMC and the other chemicals used were of analytical grade obtained from Sinopharm Chemical Reagent Co. Ltd. All aqueous solutions were prepared using purified water with a resistance of 18.2 MΩ·cm.Preparation of CHNT0.04 g nanosized TiO2 powder was added into 50 m l 2 % (v/v) glacial acetic acid containing 56 mg SDS and stirred for 1 h at room temperature. 1.5 g CMC was dissolved into the above solution while maintaining stirring for 4 h with ultrasonic treatment for 15 min at half hour intervals. H C (6.0 g) was dissolved into the suspensions and refluxed under oil bath at 100o C for 2 h to obtain a hydrogel. Then, the hydrogel was heated in drying oven for complete crossing curing at 40o C under atmospheric conditions for 7h and washed with purified water several times to remove the redundant acetic acid. The products was finally freeze-dried for 24 h at -50o C.CharacterizationFTIR spectra of the samples were recorded with KBr discs in the range of 4000-400 cm-1 on Nicolet-170 SX spectro-photometer. The morphology of TiO2 nanoparticles and CHNT on carbon-coated grids was observed by JEM-2100 (HR) transmission electron microscope (TEM). The fracture section of the CHNT was observed using scanning electron microscopy (SEM, H itachi X-650 microscope, Japan). Thermogravimetric analysis (TGA) of the sample was carried out on Pris TGA linked to a Pyris diamond TA Lab System (Perkin-Elmer Co., USA) at a heating rate of 10 K min-1 from 30 to 600o C under a nitrogen atmosphere. The specific surface area of CHNT was investigated by Brunauer-Emmett-Teller (BET) nitrogen sorption-desorption measurement (Micromeritics ASAP2020, USA). Porosities of the CHNT were determined via a modified liquid replacement method [40,41]. The CHNT was permeated with ethanol completely through repeated cycles of vacuum and air charge. The weights of the CHNT at equilibrium, swelling (w2) and dry states (w1) were measured. The porosity of the CHNT, Ф, was calculated from the weight difference between dry and wet samples according to equation (1).(1) where ρethanol and ρCHNT were the density of ethanol and CXTH, respectively.Adsorption StudiesThe adsorption capacities of CH NT for Ni(II), Cd(II), Cu(II), Mn(VII), H g(II) and Cr(VI) were investigated in batch experiments using Atomic Absorption Spectrophotometer (AAS, TAS-990F, China). The effect of pH on the adsorption were carried out at pH 2.0, 4.0 and 6.0 with equilibration for 7 h. Effect of contact time was conducted by placing 0.1 g CHNT in a flask containing 100 m l metal ions (100 mg/l) solution at pH 4.0 for metal ions. The thermodynamic experiments were performed at the solution temperatures of 298 K, 308 K and 318 K, respectively. The adsorption isotherm experiments were performed by adding 0.1 g CHNT into conical flasks containing 100 m l with different heavy metals concentrations (10-600 mg/l) under 100 rpm shaking at 298 K for 7 h. The absolute amount adsorbed of metal ions were calculated by the following equations:Φw2w1/ρethanol–w2w1/ρethanol w2/ρCHNT+–------------------------------------------------------------=24Fibers and Polymers 2017, Vol.18, No.1Shuping Wu et al.(2)where q e was the amount of metal ions adsorbed per unit amount of CH NT (mg/g); C 0 and C e were the initial concentrations of metal ions and the final or equilibrium concentrations of metal ions, respectively (mg/m l ); V was the volume of metal ions solution (m l ), and W was theweight of CHNT (g).Regeneration of CHNTA 0.1 g sample of CHNT was contacted with 100 m l of 100 mg/l metal ions solution, and the mixture was shaken for 7 h. The CH NT loaded with metal ions was separated by filtration and rinsed with deionized water to remove the unabsorbed metal ions. Then, the resin was treated with 20m l of 0.1 M EDTA solution for 2 h [42,43]. Five cycles of consecutive adsorption-desorption-regeneration were carried out to validate the reusability of CH NT. The desorption percentage (D) was calculated as follow:(3)where C EDTA was the metal ion desorbed to the EDTA solution (mg/l ) and C ad was the metal ion adsorbed onto the CHNT (mg/l ).Results and DiscussionStructure of CHNTThe schematic representation for the preparation of the CH NT was illustrated in Figure 1. As we know, sodium dodecyl sulfate (SDS) is an amphipathic molecule containing hydrophilic moiety (head group) and hydrophobic moiety (tail group). At a specific concentration, SDS can form micelles by self-assembly. As shown in Figure 1(a), the formation mechanism of SDS-TiO 2 can be considered that the SDS molecules connect with the TiO 2 substance by hydrophilic force on the head and micellization by hydrophobicq e C 0C e –()V W------------------------=D C EDTA C ad -------------⎝⎠⎛⎞100%×=Figure 2. Microelectronic spectroscope images of CHNT. (a-c) TEM images of pure nanosized TiO 2 (a), CHNT without SDS (b), andCHNT modified by SDS (c). (d-f) Cross-sectional SEM images of CHNT with different magnification corresponding to the picture (c).Figure 1. (a) The formation mechanism of SDS-TiO 2, and (b)schematic illustration for the preparation of CHNT.CHNT for Removal of Heavy Metals Fibers and Polymers 2017, Vol.18, No.125force on the tail [44,45]. The combination of surfactant and inorganic substance allows the construction of hierarchical porous architectures [46]. The amine groups of CMC were crosslinked with H C via Schiff base, and created the network structure of the resin (Figure 1(b)).The SDS surfactant was used to improve dispersibility of TiO 2 in composite. Figure 2 displayed the microelectronic spectroscope images of nanosized TiO 2 and CH NT. As shown, the nanoTiO 2 was in spherical shape and the diameter lay between 15-35 nm (Figure 2(a)). The dispersion stability of the TiO 2 nanoparticles in the polymer matrix is important to improve the 3D network and surface area of CHNT for metal adsorption. After incorporated into the polymer matrix, the TiO 2 nanoparticles without modification by SDS aggregated more significantly (Figure 2(b)). In the presence of SDS, the surfactant molecules were adsorbed on the TiO 2surface and dispersed TiO 2 nanoparticles homogeneously (Figure 2(c)). Figure 2(d)-(f) showed typical SEM image of CH NT. It was noted that CH NT exhibited highly porous structure, indicating that the macrostructured materials with macropore shapes could be synthesized by self-assembly ofsurfactant molecules on the surface of TiO 2 to form surface aggregates [46].In addition, the surface of CH NT was very smooth,indicating the nanoTiO 2 was incorporated into the network of polymer matrix and were benefit for improving the mechanism stability. Figure 3(a) shows the nitrogen adsorption-desorption isotherm of CHNT. The isotherm patterns exhibited a type H3 hysteresis loop according to the IUP AC classification [47], indicating the existence of abundant pores. The BET specific surface areas were determined to be 430 m 2/g. As shown in Figure 3(b), the porosity of CHNT increased with the increase of the content of TiO 2 and reached the maximum 90 % when the weight ratio of TiO 2 to the polymer matrix was 1:0.04.Figure 4 shows the FTIR spectra of HC, CMC and CHNT.In the H C spectrum (Figure 4(a)), several characteristic peaks were observed. The peak at 897 cm -1 can be attributed to the characteristic β-gylcosidic linkage between the sugar units. The broad peak at 1043 cm -1 can be assigned to the stretching and bending vibration of C-O, C-C, and C-OH [25]. The spectrum of CMC (Figure 4(b)) showed, a strong peak at 1415 cm -1 could be assigned to the symmetrical stretching vibration of carboxyl group. The asymmetrical stretching vibration of carboxyl group at around 1652 cm -1 is overlapped with a strong band of N-H stretch at 1629 cm -1.The absorption peak at 1070 cm -1 was assigned to the C-O stretch of secondary hydroxyl group [48,49]. Compared with CMC, CH NT showed a new peak at 1644 cm -1, which is attributed to the C=N stretching vibration derived from the Schiff base [50,51]. In addition, the appearance of the characteristic peaks of hemicellulose confirmed that HC and CMC were successfully combined by thermal cross-linking. The thermal properties of H C, CMC and CH NT were studied by TGA as shown in Figure 5. The weight loss of CHNT in the initial thermal treatment (below 200 o C) was attributed to the loss of SDS, which may not be firmly interacted with nanoTiO 2. At 50% weight loss, thedecomposition temperature of HC, CMC and CHNT was atFigure 3. Nitrogen adsorption-desorption isotherm of CHNT (a),and porosity of CHNT as a function of nanoTiO 2contents (b).Figure 4. FT-IR spectra of HC (a), CMC (b), and CHNT (c).26Fibers and Polymers 2017, Vol.18, No.1Shuping Wu et al.294, 316, and 326 o C, respectively. These results indicated that the nanoTiO 2 was excellent nanofiller for improving the thermal stability property of polymer matrix.Effect of pHIt is well-known that pH is an important parameter controlling the adsorption process. For most biosorption systems, the uptake of heavy metal ions from aqueous solutions using biomass materials as biosorbent occurs with maximum efficiency in a pH range between 4.0 and 6.0. In this pH range, most of heavy metals exist in solutions predominantly as free metal ions, and the ionization degree of functional groups from adsorbent surface is higher enough to allow the electrostatic interactions. As shown in Figure 6, it is obvious that the uptake capacities significantly as pH increases from 2.0 to 4.0, whereas, the adsorption amount decreases at pH from 4.0 to 6.0. This phenomenon can be explained that the ion-exchange interactions between the CHNT and metal ions. At low pH, the protonation of theamino groups results in the reduction of number of binding sites available for the adsorption of metal ions. H owever,with the increase of pH to a certain value, hydroxyl coordination effects play a major role on the process of adsorption, which leads to the weakening of the ion-exchange interactions. In order to ensure quantitative adsorption and avoid the coordination of hydroxyl, the optimum pH of metallic solution is chosen as 4.0 for further studies.Adsorption of Heavy Metal Ions on CHNTTo evaluate the adsorptive potential of the as-prepared CHNT, the removal of heavy metals such as Ni(II), Cd(II),Cu(II), Mn(VII), Hg(II) and Cr(VI) was studied under mild conditions. We studied the effect of the exposure time on the adsorption of these ions. Figure 7 shows the variations of the amount of adsorbed heavy metal ions onto CH NT over contact time. According to the results, the adsorbed amount of metal ions was improved by increasing the exposure time.The uptake amount of heavy metal ions onto the CH NT obeyed the orders: Ni(II)>Cd(II)>Cu(II)>Mn(VII)>H g(II)>Cr(VI). The adsorption capacities of CH NT for Ni(II),Cd(II), Cu(II), Mn(VII), Hg(II) and Cr(VI) were 32.2, 27.6,13.5, 9.4, 4.8 and 4.3 mg/g, respectively.The adsorption mechanism of metal ions by CHNT was investigated using FTIR spectroscopy in the range of 400-4000 cm -1. It can be seen from Figure 8 that the FTIR spectra of CHNT after adsorption of heavy metals exhibited many alterations from that of CHNT before adsorption. Significant changes in the FTIR spectra were observed at the wavenumber between 600 and 1200 cm -1, which may be assigned to the stretching vibration of N-Metal and O-Metal [25,52]. The stretching of carboxyl group was shifted to a lower frequency,thereby indicating complexation through the carboxyl group to metal ions [53,54]. The wide absorption band at 3448 cm -1corresponding to the stretch vibration of O-H was shifting toFigure 5.TGA curves of HC, CMC and CHNT.Figure 6. Effect of pH on the uptake of heavy metal ions by CHNT (initial concentration of metal ions 100 mg/l ; CHNT, 1 g/l ;contact time 7 h; shaking rate 100 rpm; 298 K).Figure 7. Effect of contact time on the uptake of metal ions by CHNT (initial concentration of metal ions 100 mg/l ; CHNT, 1 g/l ;pH 4.0; shaking rate 100 rpm; 298 K).CHNT for Removal of Heavy Metals Fibers and Polymers 2017, Vol.18, No.127the lower wavenumber. Meanwhile, it seemed that the bands at 1629 and 1043 cm -1 assigned to N-H and C-O stretch after the adsorption process shifted to higher frequency. The intensity decrease of C=N and -NH stretching in FTIR spectra suggests the interaction of metal ions with Schiff base. This results indicated that many reactive functional groups such as hydroxyl, amino and carboxyl groups were enhancing the chelating ability with metal ions.Adsorption KineticsTo perform the adsorption process with larger scale, the kinetic parameters and adsorption characteristics of CHNT should be determined. For this reason, Lagergren’s pseudo first-order and pseudo second-order equations were applied to model the adsorption/time data obtained.The pseudo-first-order equation was represented by [55](4)The pseudo-second-order equation can be expressed as [56](5)where q e and q t (mg/g) are the amount of heavy metal ions adsorbed on CH NT at equilibrium and at a given time t ,respectively; k 1 is rate constant (h -1) of pseudo first-order kinetic model for adsorption; k 2 (g/(mg·h)) is the adsorption rate constant of pseudo second-order kinetic model.The plots of ln(q e − q t ) versus t and t /q t versus t are shown in Figure 9, giving k 1, k 2, q e , and R 2 for the Lagergren adsorption and second-order rate equation. Based on the obtained correlation coefficients, the pseudo second-order kinetic equation was feasible to describe the adsorption process, as shown that the correlation coefficients for thefirst-order kinetic model (Figure 9(a)) are lower than the second-order model fits (Figure 9(b)). The calculated results were listed in Table 1. The correlation coefficients for the second-order kinetic model were almost equal to 1 (0.9789-0.9998) for almost all the cases. Also, the calculated q e,cal ,values also agreed with the experimental data q e,exp .The intraparticle diffusion model was further used to identify the importance of diffusion during adsorption process of heavy metal ions onto CH NT composite. The intraparticle diffusion equation most widely applied for sorption system was proposed by Weber and Morris as following [25]:(6)where k d is the intraparticle diffusion rate constant (mg/(g·min 1/2), C is the intercept (mg/g). According to equation (6), a plot of q t versus t 1/2 should be a straight line when adsorption mechanism follows the intraparticle diffusionln q e q t –()ln q e k 1t–=t q t ---1k 2q e 2---------1q e ----⎝⎠⎛⎞t +=q t k d t1/2C +=Figure 8. FT-IR spectra of CHNT before and after adsorption of metal ions. (a) CHNT, (b) CHNT-Cr(VI), (c) CHNT-Cu(II), (d)CHNT-Ni(II), (e) CHNT-Hg(II), (f) CHNT-Cd(II), and (g) CHNT-Mn(VII).Figure 9. Lagergren adsorption diagram of heavy metals on CHNT using different models: pseudo first-order equation (a) and pseudo second-order equation (b) (initial concentration of metal ions 100 mg/l ; CHNT, 1 g/l ; pH 4.0; shaking rate 100 rpm; 298 K).28Fibers and Polymers 2017, Vol.18, No.1Shuping Wu et al.process. If the plot passes through the origin, then intraparticle diffusion is the rate-controlling step. In the case where the lines have a nonzero intercept, external film and intraparticle diffusion contribute to the actual adsorption process. On the other hand, such plots may present multilinearity, which indicates that two or more steps occur in the sorption process. In this study, the intraparticle diffusion plots of various heavy metals adsorbed onto CHNT were displayed in Figure 10. It can be seen that the plots clearly exhibit two distinguishable intercepting lines, a relatively fast increasing step at beginning, followed by a slow increasing and a stagnate afterwards, indicating that the adsorption of heavy metal ions on the adsorbent is a multi-step process. Furthermore, the linear plots at each concentration did not pass through the origin, suggesting that the intraparticle diffusion is not only the rate-controlling step, but that other processes may control the rate of adsorption. The adsorption process was controlled by a multi-step process, involving adsorption on the external surface and diffusion to the surface of the adsorbent.Adsorption IsothermsTo further understand the adsorption process, the adsorption equilibrium of the CH NT is fitted with the Langmuir and Freundlich isotherms. The correlation of equilibrium data using either a theoretical or empirical equation is essential for the adsorption interpretation and prediction of the extent of adsorption. Generally, the Langmuir model, which is represented by equation (7), is based on the assumption of a structurally homogeneous adsorbent where all adsorption sites are identical and energetically equivalent [57]. WhileTable 1. Kinetic parameters for heavy metal ions adsorption by CHNTMetal ion q e,exp (mg/g)Pseudo-first-order model Pseudo-second-order modelk1 (h-1)q e,cal (mg/g)R2k2 (g/(mg·h))q e,cal (mg/g)R2Ni(II)32.50.561870.00.94570.020735.10.9958 Cd(II)27.60.56590.00.88410.016232.40.9789 Cu(II)13.80.628730.30.95410.084014.80.9927 Mn(VII)9.370.542720.00.93940.12659.920.9809 Hg(II) 4.690.548412.00.91680.6880 4.790.9998Cr(VI) 4.000.873511.90.88470.1630 4.380.9958Figure 10. The intraparticle diffusion model for heavy metal ions adsorption by CHNT (initial concentration of metal ions 100 mg/l; CHNT, 1 g/l; pH 4.0; shaking rate 100 rpm; 298 K).Figure 11. Langmuir (a) and Freundlich (b) plots for theadsorption of heavy metal ions onto CHNT (metals concentrations10-600 mg/l; CHNT, 1 g/l; contact time 7 h; pH 4.0; shaking rate100 rpm; 298 K).CHNT for Removal of Heavy Metals Fibers and Polymers 2017, Vol.18, No.129the Freundlich isotherm model, represented by equation (8),is widely used to describe the adsorption on heterogeneous surfaces [58]. Therefore, the adsorption isotherm analysis could provide qualitative information on the capacity of the adsorbent and the nature of the solute-surface interaction.(7)(8)where q e is the amount of heavy metal ions adsorbed at equilibrium (mg/g), C e is the liquid-phase heavy metal ion concentration at equilibrium (mg/l ), constant K L is the Langmuir isotherm constant (l /mg), q max is related to the Langmuir monolayer adsorption capacity (mg/g), K F is the Freunlich isotherm constant (mg/g), and n is the heterogeneity factor.The adsorption of various heavy metals onto CHNT fitted to the Langmuir (plotting C e /q e vs C e ) and Freundlich (plotting ln q e vs ln C e ) isotherm models are shown in Figure 11. As shown in Figure 11(a), the Langmuir isotherm showed a straight line with high correlation coefficient,which indicated that the adsorption of heavy metals onto the CH NT fitted the Langmuir isotherm reasonably well.However, the experimental data do not fit very well to the Freundlich isotherm model, and there is a great difference between the Freundlich plots and the trend lines (Figure 11(b)). A value of 1/n below 1 reveals a normal Langmuir isotherm while 1/n above 1 is an indicative of cooperative adsorption. These results demonstrate that the surface of CHNT is homogeneous with the adsorption mechanism of monolayer uptake. The corresponding parameters for all of the samples obtained from the linear plots of Langmuir and Freundlich isotherm models are listed in Table 2. It can be seen that the linear coefficients of determination (R 2) for the Freundlich isotherm model are lower than 0.95 except Ni(II), which indicate that this model does not describe very well the adsorption processes of the CHNT for these heavy metals. In the case of the Langmuir isotherm model, it can be found from Table 2 that R 2 values are higher than 0.95.Thus, it can be easily concluded that the Langmuir model is much better to describe the adsorption of heavy metal ions onto CHNT than the Freundlich model. This indicates that a monolayer coverage of heavy metal ions has formed on the surface of CH NT. The maximum adsorption capacities ofC e q e -----1K L q max ---------------⎝⎠⎛⎞C e q max ---------⎝⎠⎛⎞+=ln q e ln K F 1n --⎝⎠⎛⎞ln C e+=Table 2. Langmuir and Freundlich isotherm parameters for the metal ions adsorption onto CHNT Metal ion Langmuir modelFreundlich modelK L (l /mg)q m (mg/g)R 2K F (mg/g)n R 2Ni(II)0.0111370.40.983513.0 1.740.9522Cd(II)0.0097555.60.9956 6.9 1.270.9298Cu(II)0.0254526.30.969021.3 1.510.9432Mn(VII)0.001918.60.99200.2 1.140.9454Hg(II)0.004229.90.96600.4 1.570.9299Cr(VI)0.031232.10.99202.22.270.9104Table 3. Comparison of the maximum adsorption capacities with different adsorbents for various metal ionsAdsorbentMaximum adsorption capacity (mg/g)Reference Ni(II)Cd(II)Cu(II)Mn(VII)Hg(II)Cr(VI)Banana peel 1.684----59Coal bottom ash--13.44 2.34--60Coconut shells carbon 83.16-86.0175.6561Ipomea batatas carbon---23.4--62Poly(vinyl alcohol)/silica composites ----113.6-63PET fibers--96.81-120.02-64Polypyrrole (PPy)/SBA-15----200-65Bengal gram husk -8.589.70---66Elaeagnus angustifolia 1.97 2.42---7.1967Carica papaya seeds 5.58---- 5.8568Ficus glomerata -----23.169CHNT370.4555.6526.318.6 29.932.1Present study。
桂香鸡生长规律的研究_李莉
动物营养学报2014,26(7):㊀⁃㊀ChineseJournalofAnimalNutrition㊀doi:10.3969/j.issn.1006⁃267x.2014.07.000桂香鸡生长规律的研究李㊀莉㊀许晟玮㊀梁明振∗(广西大学动物科学与技术学院,南宁530004)摘㊀要:为研究桂香鸡的生长规律,试验随机选取1日龄桂香鸡母鸡810只,根据相关资料报道以及生产实践的经验,分为雏鸡阶段(1 4周龄)㊁育成阶段(5 13周龄)㊁育肥阶段(14 17周龄)3个阶段进行饲养,测定1 17周龄的体重,运用Logistic㊁Gompertz和Bertalanffy3种模型拟合其生长曲线,并对拟合结果进行比较分析㊂结果发现:桂香鸡全期(1 17周龄)体重变化与Bertalanffy模型拟合最好,在生产中应以Bertalanffy模型预测的各周龄体重作为指导;但在预测各阶段重要生长拐点时,以Logistic模型预测的较为准确,其预测的桂香鸡3个阶段的拐点周龄分别为3.98㊁9.30和12.17周龄㊂因此,在桂香鸡生产实践中应分4个阶段进行饲养管理,并在不同生长阶段提供相应营养水平的饲粮,以满足其生长发育需要,确保获得最佳经济效益㊂关键词:桂香鸡;生长规律;拟合曲线;Logistic模型;Gompertz模型;Bertalanffy模型中图分类号:S835㊀㊀㊀㊀文献标识码:A㊀㊀㊀㊀文章编号:1006⁃267X(2014)07⁃0000⁃00收稿日期:2014-01-30基金项目:广西科学研究与技术开发计划项目(桂科攻0992004⁃4);广西玉林市科学研究与技术开发计划项目(玉市校科合201210504);广西梧州市科学研究与技术开发计划项目(梧科201001053)作者简介:李㊀莉(1990 ),女,湖南泸溪人,硕士研究生,动物营养与饲料科学专业㊂E⁃mail:916186340@qq.com㊀㊀动物的生长是一个连续的过程,动物的累积生长随时间变化呈一条拉长的 S 型曲线㊂在早期,生长主要受体内生长动力的作用,增重速度逐渐加快,这个阶段称为自加速阶段,此时的生长不受环境的约束,增重速度达到最大,即生长的一个转折点,也即生长曲线的拐点,以后逐渐下降;由于受自身生理因素反馈抑制和环境的影响,当动物体重达到一定水平时就不再增加,增重停止,此时的体重叫成熟体重或极限体重,这一阶段称为自抑制阶段㊂动物的生长具有非线性的规律,因此可以用非线性的曲线模型进行拟合,常用的生长曲线模型有Logistic㊁Gompertz和Bertalanffy模型等[1-6]㊂桂香鸡是广西凤翔家禽责任有限公司以广西家养土鸡为基础经过长期系统选育出的鸡种,其生产性能较广西家养土鸡有大幅度提高,体型㊁外貌也趋于一致,抗病力较强,推出市场以来深受欢迎,是制作白切鸡的优良鸡种之一,研究其生长发育规律有助于提高各阶段的饲养管理水平,节约饲养成本,增加经济效益㊂因此,本试验拟研究桂香鸡母鸡1 17周龄的生长发育情况,运用Logistic㊁Gompertz和Bertalanffy3种模型拟合其生长曲线,以寻求其生长规律,预测生产性能,同时也为畜禽选育提供参照㊂1㊀材料与方法1.1㊀试验动物及饲养管理㊀㊀随机选取1日龄桂香鸡母鸡810只,按体重一致原则,随机分成9组,饲喂不同的饲粮,每组3个重复(栏),每栏30只㊂参考我国农业部颁布的‘黄羽肉鸡饲养管理技术规程“(NY/T18712010)及部分地方鸡种的有关资料[7],并根据广西凤翔集团畜禽食品有限公司生产实践总结的经验,将桂香鸡分为雏鸡阶段(1 4周龄)㊁育成阶段(5 13周龄)㊁育肥阶段(14 17周龄)3个生长阶段,饲喂不同营养水平的饲粮,采用地面平养,自由采食㊁饮水,执行常规免疫程序和饲养管理㊂本试验在广西凤翔集团畜禽食品有限公司饲料厂进行㊂所用桂香鸡㊁饲料原料均由广西凤翔集团畜网络出版时间:2014-06-18 08:06网络出版地址:/kcms/doi/10.3969/j.issn.1006267x.2014.07.000.html㊀动㊀物㊀营㊀养㊀学㊀报26卷禽食品有限公司提供,配合饲料的制作也由广西凤翔集团畜禽食品有限公司承担㊂3个阶段的饲粮组成及营养水平分别见表1㊁表2和表3㊂表1㊀1 4周龄饲粮组成及营养水平(风干基础)Table1㊀Compositionandnutrientlevelsofdietsat1to4weeksofage(air⁃drybasis)%项目Items组别Groups123456789原料Ingredients玉米Corn61.9559.8556.5165.7563.5656.0463.8558.2855.31豆粕Soybeanmeal23.2928.9729.8825.8827.9933.5324.7928.3529.94次粉Wheatmiddling2.002.003.002.002.003.002.003.503.50麸皮Bran7.004.004.00进口鱼粉Importedfishmeal2.001.503.501.502.002.002.502.804.50猪油Lard1.001.002.003.203.703.80磷酸氢钙CaHPO41.101.200.821.271.101.131.111.000.70石粉Limestone1.211.171.161.161.101.121.161.141.13赖氨酸Lys0.280.160.010.270.100.020.250.12蛋氨酸Met0.170.150.120.170.150.160.140.110.12预混料Premix1.001.001.001.001.001.001.001.001.00合计Total100.00100.00100.00100.00100.00100.00100.00100.00100.00营养水平Nutrientlevels代谢能ME11.5711.5711.5712.1712.1712.7712.7712.7712.77粗蛋白质CP17.5019.0020.5017.5019.0020.5017.5019.0020.50钙Ca0.830.830.830.830.830.830.830.830.83有效磷AP0.370.370.370.370.370.370.370.370.37赖氨酸Lys1.091.091.091.091.091.091.091.091.09蛋氨酸Met0.460.460.460.460.460.460.460.460.46㊀㊀预混料中各成分及其在饲粮中含量Eachcomponentofpremixanditscontentindiets:氯化胆碱cholinechloride0.12%,杆菌肽锌bacitracinzinc0.02%,硫酸抗敌素colistinsulfate0.02%,山道喹santoquin0.015%,旺得丰wonderful0.045%,植酸酶phytase0.02%,应激宁Yingjining0.01%,诺味素Nuoweisu0.01%,复合酶complexenzyme0.02%,食盐NaCl0.24%,硫酸钠Na2SO40.1%,小苏打NaHCO30.1%,石膏粉landplaster0.1%,苏氨酸Thr0.05%,鸡矿chickenmineral0.1%,919多维919multi⁃vitamin0.03%㊂㊀㊀每千克鸡矿中含有Onekgofchickenmineralcontained:Cu6000mg,I350mg,Se500mg,Co200mg,Fe30000mg,Zn50000mg,Mn60000mg;每千克919多维中含有Onekgof919multi⁃vitamincontained:VA40000000IU,VD315000000IU,VE1000000IU,VK310g,VB115g,VB232g,VB620g,VB12100mg,叶酸folicacid5g,烟酸胺nicotinam⁃ide200g,泛酸pantothenicacid54g,生物素biotin500mg㊂下表同Thesameasbelow㊂表2㊀5 13周龄饲粮组成及营养水平(风干基础)Table2㊀Compositionandnutrientlevelsofdietsat5to13weeksofage(air⁃drybasis)%项目Items组别Groups123456789原料Ingredients玉米Corn65.1662.1060.0168.9264.2059.4665.8561.1156.38豆粕Soybeanmeal16.4121.0225.8018.0722.4126.7618.6222.9727.32次粉Wheatmiddling5.005.005.005.005.005.005.005.005.00麸皮Bran6.424.852.3627期李㊀莉等:桂香鸡生长规律的研究续表2项目Items组别Groups123456789菜籽粕Rapeseedmeal3.003.003.003.003.003.003.003.003.00猪油Lard0.200.170.971.552.133.504.084.66磷酸氢钙CaHPO41.101.091.091.181.151.131.191.161.14石粉Limestone1.351.321.291.311.291.261.301.281.25赖氨酸Lys0.270.150.030.260.140.020.250.130.01蛋氨酸Met0.170.150.130.170.140.120.170.150.12预混料Premix1.121.121.121.121.121.121.121.121.12合计Total100.00100.00100.00100.00100.00100.00100.00100.00100.00营养水平Nutrientlevels代谢能ME11.6511.6511.6512.2512.2512.2512.8512.8512.85粗蛋白质CP15.0016.5018.0015.0016.5018.0015.0016.5018.00钙Ca0.800.800.800.800.800.800.800.800.80有效磷AP0.310.310.310.310.310.310.310.310.31赖氨酸Lys0.870.870.870.870.870.870.870.870.87蛋氨酸Met0.410.410.410.410.410.410.410.410.41㊀㊀预混料中各成分及其在饲粮中含量Eachcomponentofpremixanditscontentindiets:氯化胆碱cholinechloride0.12%,山道喹santoquin0.015%,旺得丰wonderful0.045%,植酸酶phytase0.015%,应激宁Yingjining0.01%,诺味素Nuoweisu0.01%,复合酶complexenzyme0.02%,食盐NaCl0.2%,硫酸钠Na2SO40.2%,小苏打NaHCO30.1%,石膏粉landplaster0.2%,苏氨酸Thr0.05%,鸡矿chickenmineral0.1%,919多维919multi⁃vitamin0.035%㊂表3㊀14 17周龄饲粮组成及营养水平(风干基础)Table3㊀Compositionandnutrientlevelsofdietsat14to17weeksofage(air⁃drybasis)%项目Items组别Groups123456789原料Ingredients玉米Corn76.3171.5866.8473.2468.4963.7572.4369.5964.85豆粕Soybeanmeal13.4817.8322.1814.0418.3922.749.9310.3914.74花生麸Peanutbran5.005.005.005.005.005.005.005.005.00玉米蛋白粉Cornglutenmeal3.005.505.50大豆磷脂Soybeanphospholipid0.200.200.200.200.200.200.200.200.20猪油Lard0.641.221.803.173.754.334.954.905.48磷酸氢钙CaHPO41.501.471.451.511.491.461.551.541.52石粉Limestone1.061.031.011.041.021.001.051.051.02赖氨酸Lys0.370.250.120.360.240.120.450.420.30蛋氨酸Met0.180.160.140.180.160.140.180.150.13预混料Premix1.261.261.261.261.261.261.261.261.26合计Total100.00100.00100.00100.00100.00100.00100.00100.00100.00营养水平Nutrientlevels代谢能ME12.3612.3612.3612.9612.9612.9613.5613.5613.56粗蛋白质CP14.2015.7017.2014.2015.7017.2014.2015.7017.20钙Ca0.750.750.750.750.750.750.750.750.753㊀动㊀物㊀营㊀养㊀学㊀报26卷续表3项目Items组别Groups123456789有效磷AP0.350.350.350.350.350.350.350.350.35赖氨酸Lys0.870.870.870.870.870.870.870.870.87蛋氨酸Met0.400.400.400.400.400.400.400.400.40㊀㊀预混料中各成分及其在饲粮中含量Eachcomponentofpremixanditscontentindiets:氯化胆碱cholinechloride0.15%,天丽红Tianlihong0.005%,金黄素Jinhuangsu0.15%,山道喹santoquin0.015%,旺得丰wonderful0.045%,植酸酶phytase0.015%,应激宁Yingjining0.01%,诺味素Nuoweisu0.01%,复合酶complexenzyme0.02%,食盐NaCl0.2%,硫酸钠Na2SO40.2%,小苏打NaHCO30.1%,石膏粉landplaster0.1%,苏氨酸Thr0.1%,鸡矿chickenmineral0.1%,919多维919multi⁃vi⁃tamin0.04%㊂1.2㊀指标测定㊀㊀测定桂香鸡1 17周龄每周龄的体重,并记录整理,计算各周龄的平均体重㊂1.3㊀数据统计与模型表达式(生长曲线拟合)㊀㊀运用SPSS20.0软件非线性回归分析拟合Lo⁃gistic㊁Gompertz和Bertalanffy3种模型的生长曲线,根据桂香鸡不同周龄的体重数据拟合计算出模型参数的最优估计值,建立生长模型,求出各项重要预测值,并依据拟合度(R2)评价生长模型,所用模型参数见表4㊂表4㊀用于拟合的3种非线性生长模型参数Table4㊀Threenonlineargrowthmodelparametersforfitting模型Model表达式Expression拐点体重Inflectionpointweight拐点周龄Inflectionpointweeksofage最大周增重MaximumweightgainaweekLogisticY=A/(1+Be-kt)A/2(lnB)/kkw/2GompertzY=Ae-Bexp(-kt)A/e(lnB)/kkwBertalanffyY=A(1-Be-kt)38A/27(ln3B)/k3kw/2㊀㊀A:极限生长值;k:瞬时生长速度;B:参数;w:拐点体重㊂下表同㊂㊀㊀A:limitedgrowthvalue;k:instantaneousgrowthrate;B:parameter;w:inflectionpointweight.Thesameasbelow.2㊀结果与分析2.1㊀桂香鸡雏鸡阶段生长曲线拟合㊀㊀由表5可知,Logistic㊁Gompertz和Bertalanffy3种模型对桂香鸡雏鸡阶段体重变化曲线拟合良好,拟合度均达到0.998以上,最高的为Bertalan⁃ffy模型,拟合度高达0.999193;预测拐点体重分别为269.28㊁507.21和1935.46g,拐点周龄分别为3.98㊁6.48和15.84周龄,最大周增重分别为82.67㊁99.41和165.46g㊂表6为3种模型对广西桂香鸡雏鸡阶段各周龄体重的预测值与实测值的对比,可以看出,各模型预测值与实测值均相差较小,1和3周龄预测值均高于实测值,2和4周龄预测值均低于实测值㊂2.2㊀桂香鸡育成阶段生长曲线拟合㊀㊀由表7可知,Logistic㊁Gompertz和Bertalanffy3种模型对桂香鸡育成阶段体重变化曲线拟合良好,拟合度均达到0.997以上,最高的为Bertalan⁃ffy模型,拟合度高达0.998241;预测拐点体重分别为768.08㊁765.37和762.59g,拐点周龄分别为9.30㊁9.07和9.10周龄,最大周增重分别为110.44㊁107.15和105.24g㊂表8为3种模型对桂香鸡育成阶段各周龄体重预测值与实测值的对比,可以看出,各模型预测值与实测值均相差较小,可以很好地反映桂香鸡育成阶段体重的变化趋势及增幅㊂47期李㊀莉等:桂香鸡生长规律的研究表5㊀3种拟合曲线模型对桂香鸡1 4周龄生长曲线的参数估计值和拟合度Table5㊀FittingdegreesandparameterevaluationvaluesofgrowthcurvesofthreefittingcurvemodelsforGuixiangchickenat1to4weeksofage项目Items模型ModelLogisticGompertzBertalanffyA538.5651378.7376532.177B11.5143.5640.822k0.6140.1960.057拟合度R20.9985230.9990320.999193拐点体重Inflectionpointweight/g269.28507.211935.46拐点周龄Inflectionpointweeksofage/周龄3.986.4815.84最大周增重Maximumweightgainaweek/g82.6799.41165.46表6㊀桂香鸡1 4周龄体重实测值和3种模型预测值比较Table6㊀ComparisonofmeasuredvalueandestimatedvaluesofthreemodelsofbodyweightforGuixiangchickenat1to4weeksofageg周龄Weeksofage实测值Measuredvalue模型预测值EstimatedvalueofmodelLogisticGompertzBertalanffy172.0074.4873.6572.972127.54123.18124.05123.733188.06190.64190.44189.384271.79270.96270.88269.60表7㊀3种拟合曲线模型对桂香鸡5 13周龄生长曲线的参数估计值和拟合度Table7㊀FittingdegreesandparameterevaluationvaluesofgrowthcurvesofthreefittingcurvemodelsforGuixiangchickenat5to13weeksofage项目Items模型ModelLogisticGompertzBertalanffyA1572.1642080.4892573.752B13.6633.5620.770k0.2810.1400.092拟合度R20.9972220.9980350.998241拐点体重Inflectionpointweight/g768.08765.37762.59拐点周龄Inflectionpointweeksofage/周龄9.309.079.10最大周增重Maximumweightgainaweek/g110.44107.15105.242.3㊀桂香鸡育肥阶段生长曲线拟合㊀㊀由表9可知,Logistic㊁Gompertz和Bertalanffy3种模型对桂香鸡育肥阶段体重变化曲线拟合良好,拟合度均达到0.998以上,最高的为Logistic模型,拟合度高达0.998835;预测的拐点体重分别为1035.12㊁822.69和687.70g,拐点周龄分别为12.17㊁10.71和9.89周龄,最大周增重分别为129.39㊁141.50和150.61g㊂表10为3种模型对桂香鸡育肥阶段各周龄体重预测值与实测值的对比,可以看出,各模型预测值与实测值均相差较小,可以很好地反映桂香鸡育肥阶段体重的变化趋势及增幅㊂5㊀动㊀物㊀营㊀养㊀学㊀报26卷表8㊀桂香鸡5 13周龄体重实测值和3种模型预测值比较Table8㊀ComparisonofmeasuredvalueandestimatedvaluesofthreemodelsofbodyweightforGuixiangchickenat5to13weeksofageg周龄Weeksofage实测值Measuredvalue模型预测值EstimatedvalueofmodelLogisticGompertzBertalanffy5343.56361.21354.79349.336444.17445.22447.02443.907565.24540.05546.48543.808646.91643.55650.77647.099762.93752.42757.47752.0210836.87862.60864.35857.1011972.27969.83969.45961.10121071.071070.281071.161063.00131167.161161.081168.201162.01表9㊀3种拟合曲线模型对桂香鸡14 17周龄生长曲线的参数估计值和拟合度Table9㊀FittingdegreesandparameterevaluationvaluesofbodyweightcurvesofthreefittingcurvemodelsforGuixiangchickenat14to17weeksofage项目Items模型ModelLogisticGompertzBertalanffyA2070.2452236.2972320.993B20.956.3131.413k0.2500.1720.146拟合度R20.9988350.9987450.998714拐点体重Inflectionpointweight/g1035.12822.69687.70拐点周龄Inflectionpointweeksofage/周龄12.1710.719.89最大周增重Maximumweightgainaweek/g129.39141.50150.61表10㊀桂香鸡14 17周龄体重实测值和3种模型预测值比较Table10㊀ComparisonofmeasuredvalueandestimatedvaluesofthreemodelsofbodyweightforGuixiangchickenat14to17weeksofageg周龄Weeksofage实测值Measuredvalue模型预测值EstimatedvalueofmodelLogisticGompertzBertalanffy141269.521268.041267.041265.74151381.031386.921386.051384.83161501.401496.151494.891493.57171591.661593.921593.121592.002.4㊀桂香鸡生长全期(1 17周龄)生长曲线拟合㊀㊀由表11可知,Logistic㊁Gompertz和Bertalan⁃ffy3种模型对桂香鸡全期体重变化曲线拟合良好,拟合度均达到0.995以上,最高的为Bertalan⁃ffy模型,拟合度高达0.999465;预测的拐点体重分别为918.98㊁896.13和940.47g,拐点周龄分别为10.85㊁10.34和10.75周龄,最大周增重分别为121.31㊁112.02和108.62g㊂表12为3种模型对桂香鸡全期各周龄体重预测值与实测值的对比,可以看出,Bertalanffy模型的预测值与实测值相差67期李㊀莉等:桂香鸡生长规律的研究表11㊀3种拟合曲线模型对桂香鸡1 17周龄生长曲线的参数估计值和拟合度Table11㊀FittingdegreesandparameterevaluationvaluesofgrowthcurvesofthreefittingcurvemodelsforGuixiangchickenat1to17weeksofage项目Items模型ModelLogisticGompertzBertalanffyA1837.9622435.9423174.095B6.3353.6410.763k0.2640.1250.077拟合度R20.9955660.9988430.999465拐点体重Inflectionpointweight/g918.98896.13940.47拐点周龄Inflectionpointweeksofage/周龄10.8510.3410.75最大周增重Maximumweightgainaweek/g121.31112.02108.62表12㊀桂香鸡1 17周龄体重实测值和3种模型预测值比较Table12㊀ComparisonofmeasuredvalueandestimatedvaluesofthreemodelsofbodyweightforGuixiangchickenat1to17weeksofageg周龄Weeksofage实测值Measuredvalue模型预测值EstimatedvalueofmodelLogisticGompertzBertalanffy172.00135.69100.3680.292127.54172.84145.98131.363188.06218.84203.21194.694271.79275.06272.08269.025343.56342.67352.01352.826444.17422.41441.84444.497565.24514.32539.99542.388646.91617.50644.56644.979762.93729.97753.55750.7910836.87848.67864.94858.5611972.27969.79976.84967.11121071.071089.161087.561075.44131167.161202.871195.661182.69141269.521307.711299.941288.15151381.031401.531399.491391.21161501.401483.251493.661491.41171591.661552.781582.021588.373㊀讨㊀论㊀㊀目前,众多学者对禽类生长规律都进行了细致的研究,能通过各种数学模型预测各品种不同生长阶段的体重[8-9]㊂吴华莉等[10]研究表明,Lo⁃gistic㊁Gompertz和Bertalanffy3种模型均能很好地拟合浙东白鹅的早期生长规律,拟合度均大于0.99,其中Gompertz模型总体效果最佳,尤其对鹅等[11]运用Logistic㊁Gompertz和Bertalanffy3种模型进行朗德鹅早期生长发育指标的拟合,结果表明Gompertz模型对体重拟合最为合适,Logistic模型对胫骨长和体斜长的拟合效果良好㊂叶昌辉等[12]研究表明,Logistic模型对狮头鹅生长指标的拟合度比Gompertz和Bertalanffy模型高㊂汤青萍等[13]用Logistic㊁Gompertz和Bertalanffy3种模型拟合5个品种鹅的生长曲线,结果表明不同的生7㊀动㊀物㊀营㊀养㊀学㊀报26卷见,由于模型本身具有不同的特点,不同鹅种的生长曲线最优拟合模型不尽相同[14]㊂㊀㊀本试验中,在雏鸡阶段,各模型拟合度均较高,其中以Bertalanffy模型拟合最好,但是在对拐点体重㊁拐点周龄和最大周增重预测方面,Logistic模型的预测值与实际生产中较为接近,可用以指导更换饲粮和改变饲养管理措施㊂Logistic模型预测雏鸡阶段的拐点周龄在3.98周龄,因此,在4周龄时应通过加强营养等必要的饲养管理措施,继续维持桂香鸡的高增重趋势㊂这也正好验证了在实际生产中雏鸡阶段划定为1 4周龄的科学性㊂㊀㊀在育成阶段,3种模型的拟合度均在0.997以上,以Bertalanffy模型拟合最好㊂各模型在拐点体重㊁拐点周龄和最大周增重方面的预测值都较为接近,均可用于指导生产实践㊂3种模型预测的拐点周龄平均在9.15周龄,因此,建议在9周龄结束时改变饲养管理措施,最主要的是通过更换饲粮,及时将育成阶段分为2个部分,以使桂香鸡继续快速生长㊂㊀㊀在育肥阶段,各模型拟合度均较高,其拐点体重㊁拐点周龄和最大周增重的预测值也较为接近,其中Logistic拟合最好,可以用以指导生产实践㊂Logistic模型预测的拐点周龄为12.17周龄,而另外2种模型预测的拐点周龄均在10周龄左右,表明在育肥阶段,桂香鸡已无法达到雏鸡阶段和育成阶段的生长速度,此时应提供较高营养水平的饲粮,以保证其生长,并应在达到上市体重后尽快上市,以提高经济效益㊂㊀㊀本试验中,桂香鸡在生长全期体重围绕3种模型预测值波动幅度不大,拟合度较高,说明3种模型均能用于预测桂香鸡的生长规律㊂桂香鸡全期体重变化与Bertalanffy模型拟合最好,在生产中应以Bertalanffy模型预测的各周龄体重等指标作为指导,掌握桂香鸡养殖生产中不同阶段的生长潜力,制订合理的饲养管理措施,控制鸡体适当增重,以达到理想体重,提高生产水平和经济效益㊂但在预测各阶段重要生长拐点时,以Logistic模型较为准确,其预测的桂香鸡雏鸡阶段㊁育成阶段㊁育肥阶段生长的拐点周龄分别为3.98㊁9.30和12.17周龄,因此,在生产实践中应分4个阶段对桂香鸡进行饲养管理,并在不同生长阶段提供相应4㊀结㊀论㊀㊀①在实际生产中,桂香鸡各生长阶段及全期体重应以Bertalanffy模型的预测值作为参考,但在预测各阶段重要生长拐点以变更饲养管理措施时,应以Logistic模型的预测为主㊂㊀㊀②建议在桂香鸡的饲养过程中分成4个阶段,每阶段提供不同的饲粮组成及营养水平,以满足其生长需要㊂参考文献:[1]㊀张元跃.家禽体生长非线性模型的研究进展[J].家禽科学,2010(1):41-45.[2]㊀张红,龚道清,张军,等.溧阳鸡生长曲线分析与拟合的研究[J].畜牧与兽医,2006,38(2):7-9.[3]㊀肖慎华,闻涛,虞德兵,等.樱桃谷鸭生长曲线拟合与比较分析[J].畜牧与兽医,2008,40(11):45-47.[4]㊀BILGINOC,EMSENE,DAVISME.Comparisonofnon⁃linearmodelsfordescribingthegrowthofscrotalcircumferenceinAwassimalelambs[J].SmallRumi⁃nantResearch,2004,52(1/2):155-160.[5]㊀KUHIHD,KEBREABE,LOPEZS,etal.Anevalua⁃tionofdifferentgrowthfunctionsfordescribingtheprofileofliveweightwithtime(age)inmeatandeggstrainsofchicken[J].PoultryScience,2003,82(10):1536-1543.[6]㊀NARUSHINVG,TAKMAC.Sigmoidmodelfortheevaluationofgrowthandproductioncurvesinlayinghens[J].BiosystemsEngineering,2003,84(3):343-348.[7]㊀王存波,陈国宏,王克华,等.不同鸡种早期生长规律比较及其生长曲线拟合[J].江西农业大学学报,2009,31(2):322-325.[8]㊀AGGREYSE.Comparisonofthreenonlinearandsplineregressionmodelsfordescribingchickengrowthcurve[J].PoultryScience,2002,81(12):1782-1788.[9]㊀MIGNON⁃GRASTEAUS,PILESTM,VARONAL,etal.Geneticanalysisofgrowthcurveparametersformaleandfemalechickensresultingfromselectiononshapeofgrowthcurve[J].JournalofAnimalScience,2000,78(10):2512-2524.[10]㊀吴华莉,周兵,王惠影,等.浙东白鹅生长曲线及拟合分析[J].中国畜牧兽医,2011,38(5):134-137.[11]㊀邝智样,王俐智,朱庆,等.朗德鹅早期生长发育模型87期李㊀莉等:桂香鸡生长规律的研究[12]㊀叶昌辉,钟日聪.狮头鹅生长发育模型的研究[J].石河子大学学报,2005,23(6):694-697.[13]㊀汤青萍,章双杰,陈宽维,等.中国地方鹅种生长曲线拟合和比较分析[J].青岛农业大学学报:自然科学版,2010,27(1):67-70.[14]㊀杨海明,徐琪,戴国俊.禽类三种常用生长曲线浅析[J].中国家禽,2004,8(增刊1):164-166.StudyonGrowthLawofGuixiangChickenLILi㊀XUShengwei㊀LIANGMingzhen∗(CollegeofAnimalScienceandTechnology,GuangxiUniversity,Nanning530004,China)Abstract:InordertoresearchthegrowthlawofGuixiangchicken,eighthundredandten1⁃day⁃oldhensofGuixiangchickenwererandomlyselected.Accordingtorelevantdatareportsandproductionpracticeexperi⁃ence,theyweredividedintothreestages fledgingstage(1to4weeksofage),growingstage(5to13weeksofage)andfatteningstage(14to17weeksofage)forfeeding.ThebodyweightofGuixiangchickenfrom1to17weeksofagewasmeasured.Threemodels(Logistic,GompertzandBertalanffymodels)wereusedtofitthegrowthcurveofGuixiangchicken,andthefittingresultswereanalyzedandcompared.There⁃sultsshowedthatthebestfittingforweightchangeduringallgrowthperiodofGuixiangchickenwasBertalan⁃ffymodelandthereshouldmakeeachweekbodyweightforecastedbyBertalanffymodelasguidanceinpro⁃duction.Buttoforecasteachstageimportantgrowthinflectionpoint,theLogisticmodelwasmoreaccurate.TheinflectionpointweeksofageofGuixiangchickenatthreestageswhichforecastedbyLogisticmodelwere3.98,9.30and12.17weeksofage,respectively.Therefore,itshouldbedividedintofourstagesinproductionandprovidethecorrespondingnutrientlevelsofdietsindifferentgrowthstagesinordertosatisfyitsgrowthanddevelopmentandtoensurethebesteconomicbenefits.[ChineseJournalofAnimalNutrition,2014,26(7):㊀⁃㊀]Keywords:Guixiangchicken;growthlaw;fittingcurve;Logisticmodel;Gompertzmodel;Bertalanffymodel9。
如何使用SNMP来监控Linux服务器
如何使用SNPM 来监控Linux服务器作者: icefired (*********************)2005-9-16[Keywords] SNMP, Linux, Orion NPM, MRTG, Net-SNMP [Objects] Using SNMP to monitor a Linux server[准备]1.Net-SNMP 5.1.2 或 UCD-SNMP 4.2.3下载:/download.html2.A Linux Server: Redhat Linux 7/8/9,RHEL 3/4 或其他Linux 发行版。
3.SNMP Tool: Solarwinds toolset V8.2或 Orion Network Performance Monitor V7.8, 其他支持SNMP监控的工具如HP OpenView, IBM NetView, SNMPC V7均可以。
[步骤]1.安装Net-SNMP 或UCD-SNMP. (三种方法)1.1安装Linux系统时自动安装安装Linux系统的时候选择 UCD-SNMP 和 SNMP-Utility两个安装包就可以了。
1.2使用RPM包来安装,这里以Redhat 9为例来说明。
先检查有无安装旧的版本: rpm –q ucd-snmp全新安装:#rpm –ivh net-snmp-5.1.2-1.rh9.i386.rpm#rpm –ivh net-snmp-devel-5.1.2-1.rh9.i386.rpm1.3使用原代码来安装#wget /sourceforge/net-snmp/net-snmp-5.1.3.1.tar.gz#tar –xzvf net-snmp-5.1.3.1.tar.gz#cd net-snmp-5.1.3.1#./configure# make & make install如果没什么问题则顺利完成安装,Linux的安装和命令使用不在本文讨论范围,请大家查询相关手册。
ethereal使用教程(翻译版)
矿产资源开发利用方案编写内容要求及审查大纲
矿产资源开发利用方案编写内容要求及《矿产资源开发利用方案》审查大纲一、概述
㈠矿区位置、隶属关系和企业性质。
如为改扩建矿山, 应说明矿山现状、
特点及存在的主要问题。
㈡编制依据
(1简述项目前期工作进展情况及与有关方面对项目的意向性协议情况。
(2 列出开发利用方案编制所依据的主要基础性资料的名称。
如经储量管理部门认定的矿区地质勘探报告、选矿试验报告、加工利用试验报告、工程地质初评资料、矿区水文资料和供水资料等。
对改、扩建矿山应有生产实际资料, 如矿山总平面现状图、矿床开拓系统图、采场现状图和主要采选设备清单等。
二、矿产品需求现状和预测
㈠该矿产在国内需求情况和市场供应情况
1、矿产品现状及加工利用趋向。
2、国内近、远期的需求量及主要销向预测。
㈡产品价格分析
1、国内矿产品价格现状。
2、矿产品价格稳定性及变化趋势。
三、矿产资源概况
㈠矿区总体概况
1、矿区总体规划情况。
2、矿区矿产资源概况。
3、该设计与矿区总体开发的关系。
㈡该设计项目的资源概况
1、矿床地质及构造特征。
2、矿床开采技术条件及水文地质条件。
教师资格证高中英语教学设计(优秀4篇)
教师资格证高中英语教学设计(优秀4篇)高中英语教学设计篇一教学准备教学目标Teaching Objectives1. Students are able to learn more about nonverbal humour as well as Charlie Chaplin through network-based.2. Students are able to get the gen eral idea and detailed information of the passage by skimming, scanning as well as interpreta tion and appreciation.3. Students will learn to face difficulties in life with optimism and humour as well as learn to cooperate with others in groups.教学重难点Teaching difficult points1. How to guide students to search for and sort out related information according to the assigned task through the Internet.2. How to cu ltivate students’ learning ability through teamwork based on network.Teaching important points1. Help students to get the general idea and detailed information of the text effectively by skimming and scanning.2. Help students to analyze the reasons for Charlie Chaplin’s success by interpreting the key sentences and get them inspired.教学过程Step 1Lead-in(3 mins)1.Students’ Activities:2.The Purpose of ActivitiesStudents are to appreciate a video clip performed by Mr. Bean.Students will be guided to acquire the form of nonverbal humour in a vivid way,thus eage r to learn about the main character of the text with interest.Step 2Network-based Interactive Learning(25 mins)1.Students’ Activities(1).Students are divided into five groups to search for and sorted out the related information according to the assigned task online(2)A representative of each group is to share the information with the others.2.the Purpose of ActivitiesStudents will develop their ability to effectively sort out information on the Internet throug h group cooperation as well as feel a sense of achievement by their oral presentation.Step3 Text-based Reading(17 mins)Students’ Activities 1. Students are to read the text quickly, and then answer the questions according to the text. 2. Read Paragraph 3 carefully, and then answer the question ---Why did “the little tramp”become Charlie Chaplin’ famous character ?3. Read Paragraph 4 and fill in the blanks。
Unit 2 Bridging Cu23学年高二英语精美课件 精美教案(人教版2019选择性必修二)
Example 1:_H__o_w__t_o__li_v_e__i_n_a_n__u__n_f_a_m_i_l_ia_r _e_n_v__ir_o_n_m__e_n__t _w__it_h__li_m__i_te_d__l_a_n_g_u_a_g__e_s_k_i_l_ls. Example 2:__S__o_m__e_m__a_y__s_t_ru__g_g_l_e_o__r_s_u_f_f_e_r_
and evidence? Conclusion:_C__o_o_p_er_a_t_in_g__w_i_th__p_e_o_p_le_s_f_r_o_m__d_iv_e_r_s_e_c_u_lt_u_r_es__h_e_lps
_u_s _v_ie_w__t_h_e_w__o_rl_d_d_i_ff_e_r_e_n_tl_y_a_n_d__g_iv_e_s_u_s__m_o_r_e_i_n_si_g_h_t.into our
2 Reason 1
Great economic pressure. Chance for cultural exchange
3 Reason 2 4 Reason 3 5 Conclusion
Tremendous pressure: Unfamiliar environment,
limited language skills, not maPtueres,osnaaflegtyropwrothb.lems , different approaches to teaching and learning
2. Skim Reading: Read the text quickly and answer the questions:
• 1) Where are the two passages from? • The two passages are taken from argumentative letters. • Who are the writers?