Spectral Energy Distributions of Hard X-ray selected AGNs in the XMDS Survey
JEM-X background models
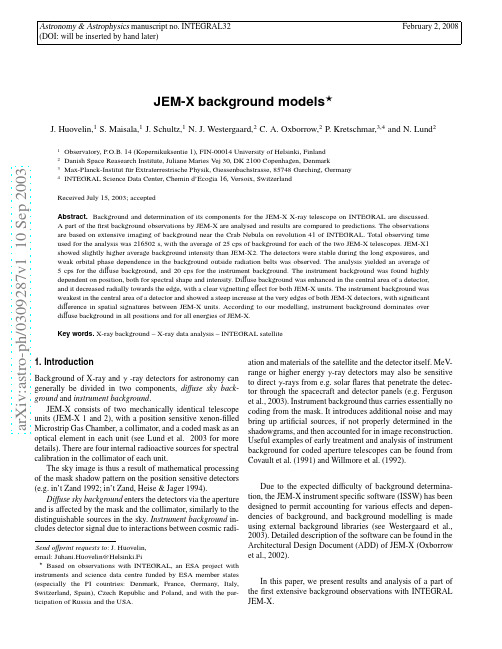
a r X i v :a s t r o -p h /0309287v 1 10 S e p 2003Astronomy &Astrophysics manuscript no.INTEGRAL32February 2,2008(DOI:will be inserted by hand later)JEM-X background models ⋆J.Huovelin,1S.Maisala,1J.Schultz,1N.J.Westergaard,2C.A.Oxborrow,2P.Kretschmar,3,4and N.Lund 21Observatory,P.O.B.14(Kopernikuksentie 1),FIN-00014University of Helsinki,Finland 2Danish Space Reasearch Institute,Juliane Maries Vej 30,DK 2100Copenhagen,Denmark 3Max-Planck-Institut f¨u r Extraterrestrische Physik,Giessenbachstrasse,85748Garching,Germany 4INTEGRAL Science Data Center,Chemin d’Ecogia 16,Versoix,Switzerland Received July 15,2003;accepted Abstract.Background and determination of its components for the JEM-X X-ray telescope on INTEGRAL are discussed.A part of the first background observations by JEM-X are analysed and results are compared to predictions.The observations are based on extensive imaging of background near the Crab Nebula on revolution 41of INTEGRAL.Total observing time used for the analysis was 216502s,with the average of 25cps of background for each of the two JEM-X telescopes.JEM-X1showed slightly higher average background intensity than JEM-X2.The detectors were stable during the long exposures,and weak orbital phase dependence in the background outside radiation belts was observed.The analysis yielded an average of 5cps for the di ffuse background,and 20cps for the instrument background.The instrument background was found highly dependent on position,both for spectral shape and intensity.Di ffuse background was enhanced in the central area of a detector,and it decreased radially towards the edge,with a clear vignetting e ffect for both JEM-X units.The instrument background was weakest in the central area of a detector and showed a steep increase at the very edges of both JEM-X detectors,with significant di fference in spatial signatures between JEM-X units.According to our modelling,instrument background dominates over di ffuse background in all positions and for all energies of JEM-X.Key words.X-ray background –X-ray data analysis –INTEGRAL satellite 1.Introduction Background of X-ray and γ-ray detectors for astronomy can generally be divided in two components,di ffuse sky back-ground and instrument background .JEM-X consists of two mechanically identical telescope units (JEM-X 1and 2),with a position sensitive xenon-filledMicrostrip Gas Chamber,a collimator,and a coded mask as anoptical element in each unit (see Lund et al.2003for moredetails).There are four internal radioactive sources for spectralcalibration in the collimator of each unit.The sky image is thus a result of mathematical processingof the mask shadow pattern on the position sensitive detectors(e.g.in’t Zand 1992;in’t Zand,Heise &Jager 1994).Di ffuse sky background enters the detectors via the apertureand is a ffected by the mask and the collimator,similarly to thedistinguishable sources in the sky.Instrument background in-cludes detector signal due to interactions between cosmic radi-2Huovelin et al.:JEM-X background modelsFig.1.Spatial distribution of the background.Upper panels:JEM-X1,lower panels,JEM-X2.Left panels:Instrument back-ground,Right panels:Diffuse background.The white rectan-gles denote the positions of the calibration sources,which havebeen excluded from our analysis.The collimator signature canbe seen as weak vertical and horizontal line structures in the shadowgrams.The broad vertical lines are due to dead anodes.Also some photon leak from the calibration sources is evident.The sharp and very narrow lines are graphical artifacts causedby the plotting routine.Total intensity of each shadowgram isnormalized to1.Table1.INTEGRAL background pointings during cycle41.45324.0+210850.17000053645.0+122415.14082553645.2+122546.44277553645.3+122543.564468Huovelin et al.:JEM-X background models3Table2.The normalization factors of the background con-tinuum components(10−3photons keV−1cm−2s−1at1keV). Mean and standard deviation of values derived from the six extraction regions at each radius are given.The energy range used in thefitting is4-33keV.Diffuse denotes diffuse sky back-ground,Flat denotes theflat continuum of the instrument back-ground.Note that the normalization is determined on the basis of source spectra from1R in R out JEM-X1JEM-X2pix pix Diffuse Flat Diffuse FlatThe diffuse background decreases towards the edges of the detector,as expected.The instrument background is stronger than expected,dominating the spectrum at all radii.The ten expected K-shell lines(from the109Cd and55Fe calibration sources,collimator(Mo),and detector gas(Xe))were detected close to their nominal positions.This implies that the energy scale is correctly determined.The previously unknown weak line near13keV turned out to be the uranium L-shell line.It most likely originates in the detector beryllium window.Near the edges of the detector,the background is highly nonuniform. Additional nonuniformity in the outer parts was introduced by photon leak from calibration sources,which could not be com-pletely eliminated.We also searched for possible dependence of background on the orbital phase of the observations.The spectrum varied with a range of approximately5%between three separate or-bital sections well outside radiation belts.The variation is sta-tistically significant but small.Also dependence on solar aspect angle and particle radiation level can be utilised in the JEM-X ISSW background modelling.Significant variations were not found.The variation in the solar aspect due to different point-ings was20◦,which is probably not sufficiently large for stud-ies of an effect on instrument background.Also,there was no proper indicator of particle radiation level on INTEGRAL available during our observations to search for a correlation.4.ConclusionsWe have analyzed a part of thefirst INTEGRAL background observations with JEM-X.Estimates of the spatial and spec-tral distributions are obtained for diffuse sky background and instrument background.The total background observed for JEM-X1was28cps,for JEM-X223cps,and25cps on the average.A part(∼1/5)of the excessively large background may be due to residual Crab Nebula emission in JEM-X data.According to XSPECfitting,the diffuse background was at maximum in the centre of the detector and it decreasedra-Fig.2.Four sample background spectra extracted from differ-ent parts of JEM-X2.At the sides of the detector,a blend of K-shell lines from the spacecraft structure is seen.Note also the prominent lines in spectrum extracted from the surround-ings of the calibrationsources.Fig.3.The background extraction regions.Units in both axes are pixels.All regions cover an equal area of the detector. Exclusion of calibration sources(not shown)reduces the ac-tual area of some regions.dially towards the edge,which is due to vignetting.There is also slight asymmmetry in the spatial distribution of the diffuse background,which is caused by a small angular misalignment of the detector plane.The count rate for diffuse background was approximately20%of the total background.The instrument background intensity and spectrum are highly position dependent,with a steep increase near the edges at all radial directions.Leakage of the radiative calibration sources causes residual line emission in the neighbourhood of4Huovelin et al.:JEM-X background modelsTable3.The lines detected from the background.Line ID is the element and transitions producing the line,E is the line en-ergy in keV(Thompson et al.,2001).Subscripts1and2denote the detectors JEM-X1and2,F is the largest line strength de-tected,¯F(N)mean of detected line strengths where N is the number of regions from which the line is detected(maximum is48regions/detector).The Mn/Fe line at6.45keV is a blend of Mn Kβ(6.49keV)and Fe Kα(6.40keV).Line strengths are given in10−3photons cm−2s−1.Note that the line strengths are determined on the basis of source spectra from1Line E F1¯F1(N)F2¯F2(N)Origin the source positions.The count rate for the instrument back-ground was approximately80%of the total background.The total background level varied with a range of approx-imately5%between different orbital sections.the variation is significant,but small.Also,it is impossible to say,what fraction of this,if any,is caused by the simultaneous variation of the so-lar aspect angle of the satellite,and the unknown variations of particle radiation level.We plan to separate these effects by the support of future background observations.Although our modelling is simple,and does not provide accurate absolute estimates of physical backgroundfluxes,it yields information which can be applied to the JEM-X analysis software to properly account for background contribution in spatially resolved spectral data.A thorough analysis of JEM-X background will be presented in a future paper. Acknowledgements.Authors from the Observatory,University of Helsinki acknowledge the Academy of Finland,TEKES,and the Finnish space research programme ANTARES forfinancial support in this research.J.Schultz is grateful for thefinancial support of the Wihuri Foundation.The Danish Space Research Institute acknowl-edges support given to the development of the JEM-X instrument from the PRODEX programme.ReferencesArnaud,K.A.,1996,Astronomical Data Analysis Software and Systems V,eds.Jacoby G.and Barnes J.,ASP Conf.Series V ol.101.Covault,C.E.,Grindlay,J.E.,Manandhar,R.P.,and Braga,J.,1991, IEEE Transact.Nucl.Sci.,V ol.38,No.2.Ferguson,C.,Barlow,E.J.,Bird,A.J.,et al.,2003A&A,this volume in’t Zand,J.,1992,Ph.D.thesis,SRON.in’t Zand,J.,Heise,J.,Jager,R.,1994,A&A288,665.Lund,.N.,Brandt,S.,Budtz-Joergensen,C.,et al.,2003,A&A,this volumeMarshall,F.E.,Boldt,E.A.,Holt,S.S.,et al.,1980,ApJ235,4 Oxborrow C.A.,Kretschmar,P.,Maisala,S.,Westergaard,N.J., Larsson,S.,2002,Instrument Specific Software for JEM-X: Architectural Design Document,DSRI homepage:www.dsri.dk Thompson, A.C.,Attwood, D.T.,Gullikson, E.M.,et al.,2001,“The X-ray data booklet”,2nd ed.,Lawrence Berkley National Laboratory,Univ.of California,available at / Westergaard,N.J.,Kretschmar,P.,Oxborrow,C.A.,et al.,2003,A& A,this volumeWillmore,A.P.,Bertram,D.,Watt,M.P.,et al.,1992,MNRAS258, 621。
英国“钻石”同步辐射光源(DIAMOND)

英国“钻石”同步辐射光源(DIAMOND)2010-08-10 | 文章来源: | 浏览次数: 659 |【大中小】璀璨夺目的“钻石”光源英国第一台第三代同步辐射光源DIAMOND坐落于英国南牛津郡(South Oxfordshire)迪德科特镇(Didcot)。
它的名字来源有两种说法:一种说法是该项目的发起人迈克普尔(Mike Poole)由DIpole And Multipole Output for the Nation at Daresbury(国家在达斯伯里的偶极和多极输出)的缩写构思了DIAMOND这个名字;另一种说法是DIAMOND表达了同步辐射光既硬(指“硬”X射线的电磁波谱区)又明亮,就像“钻石”。
不管哪种说法更准确,与法国“太阳”光源(SOLEIL)相比,英国“钻石”光源(DIAMOND)的名字毫不逊色,DIAMOND 光源就像钻石那样璀璨夺目。
DIAMOND光源的紫外线和X射线具有远非常规光源可比的品质和亮度,其亮度为医用X光机的1千亿倍,科技工作者用它将能更深入地研究物质、材料及生物样品的基本结构。
利用同步辐射技术开展的科学实验,可望在生物技术、医学、环境和材料研究中取得突破性进展。
英国南牛津郡的迪德科特镇DIAMOND光源鸟瞰2002年,英国政府批准建造DIAMOND光源,其辐射能量及光束性能首先被优化为高能的欧洲同步光源ESRF的补充。
它的主要目标是生成高亮度、高强度的可调光源,建成英国第一的研究基地,开展不同学科领域交叉学科的研究。
DIAMOND是40多年来英国投资兴建的最重要的大科学装置和最大的民用科研基地,由英国科学和技术设施委员会STFC的中心实验室研究理事会CCLRC( Council for the Central Laboratory of the Research Councils)与英国最大的生物医学研究慈善机构——威康信托基金会(Wellcome Trust)共同建设,双方各投资86%和14%。
天文学名词

中国天文学会天文学名词审定委员会第1-6批天文学名词的推荐译名The 1st - 6th Drafts for the Chinese-Translation of Astronomical Termsrecommanded byThe Astronomical Terminology Committee of the CASabsolute stability 绝对稳定性absorbing dust mass 致吸尘物质absorption trough 吸收槽abundance standard 丰度标准星accreting binary 吸积双星accretion column 吸积柱accretion flow 吸积流accretion mound 吸积堆accretion ring 吸积环accretion stream 吸积流acoustic mode 声模active binary 活动双星active chromosphere binary 活动色球双星active chromosphere star 活动色球星active optics 主动光学actuator 促动器Adams ring 亚当斯环adaptive optics 自适应光学additional perturbation 附加摄动AGB, asymptotic giant branch 渐近巨星支Alexis, Array of Low-Energy X-ray 〈阿列克希斯〉低能X 射线Imaging Sensors 成象飞行器AM Herculis star 武仙AM 型星amplitude spectrum 变幅谱angular elongation 距角anonymous galaxy 未名星系anonymous object 未名天体anti-jovian point 对木点annular-total eclipse 全环食aperture photometry 孔径测光APM, Automated Photographic Measuring 〈APM〉底片自动测量仪systemapoapse 远质心点apoapse distance 远质心距apogalacticon 远银心点apomartian 远火点apparent association 表观成协apparent luminosity function 视光度函数apparent superluminal motion 视超光速运动apsidal advance 拱线进动apsidal precession 拱线进动Arcturus group 大角星群area image sensor 面成象敏感器area photometry 面源测光area spectroscopy 面源分光argument of pericentre 近心点幅角ASCA, Advanced Satellite for Cosmology 〈ASCA〉宇宙学和天体物理学and Astrophysics 高新卫星asteroidal dynamics 小行星动力学asteroidal resonance 小行星共振asteroid family 小行星族asteroid-like object 类小行星天体asteroseismology 星震学astration 物质改造astroparticle physics 天文粒子物理学astrostatistics 天文统计学asymptotic branch 渐近支asymptotic branch giant 渐近支巨星atmospheric parameter 大气参数ATNT, Australia Telescope National 澳大利亚国立望远镜FacilityATT, Advanced Technology Telescope 〈ATT〉高新技术望远镜automated measuring machine 天文底片自动测量仪automatic photooelectric telescope 自动光电测光望远镜( APT )AXAF, Advanced X-ray Astrophysical 高新X射线天体物理台FacilityBaade's window 巴德窗Baade—Wesselink analysis 巴德—韦塞林克分析Baade—Wesselink mass 巴德—韦塞林克质量Baade—Wesselink method 巴德—韦塞林克方法Baade—Wesselink radius 巴德—韦塞林克半径background galaxy 背景星系Barnard's galaxy ( NGC 6822 ) 巴纳德星系barycentric dynamical time ( TDB ) 质心力学时Belinda 天卫十四Bianca 天卫八bidimensional spectrography 二维摄谱bidimensional spectroscopy 二维分光Big-Bang nucleosynthesis 大爆炸核合成binarity 成双性binary asteroid 双小行星binary flare star 耀变双星binary millisecond pulsar 毫秒脉冲双星binary protostar 原双星bioastronomy 生物天文学bipolar jet 双极喷流bipolar outflow 偶极外向流bipolar planetary nebula 双极行星状星云blazar 耀变体blazarlike activity 类耀活动blazarlike object 耀变体Black-eye galaxy ( M 64 ) 黑眼星系BL Lacertae object 蝎虎天体BL Lacertid 蝎虎天体blue compact galaxy ( BCG ) 蓝致密星系blue straggler 蓝离散星bolometric albedo 热反照率bolometric light curve 全波光变曲线bolometric temperature 热温度Bootes void 牧夫巨洞bow-shock nebula 弓形激波星云box photometry 方格测光broad-band imaging 宽波段成象broad-line radio galaxy ( BLRG ) 宽线射电星系buried channel CCD 埋沟型CCDButterfly nebula 蝴蝶星云BY Draconis star 天龙BY 型星BY Draconis variable 天龙BY 型变星CAMC, Carlsberg Automatic Meridian 卡尔斯伯格自动子午环Circlecannibalism 吞食cannibalized galaxy 被吞星系cannibalizing galaxy 吞食星系cannibalizing of galaxies 星系吞食carbon dwarf 碳矮星Cassegrain spectrograph 卡焦摄谱仪Cassini 〈卡西尼〉土星探测器Cat's Eye nebula ( NGC 6543 ) 猫眼星云CCD astronomy CCD 天文学CCD camera CCD 照相机CCD photometry CCD 测光CCD spectrograph CCD 摄谱仪CCD spectrum CCD 光谱celestial clock 天体钟celestial mechanician 天体力学家celestial thermal background 天空热背景辐射celestial thermal background radiation 天空热背景辐射central overlap technique 中心重迭法Centaurus arm 半人马臂Cepheid distance 造父距离CFHT, Canada-Franch-Hawaii Telecope 〈CFHT〉望远镜CGRO, Compton Gamma-Ray Observatory 〈康普顿〉γ射线天文台chaos 混沌chaotic dynamics 混沌动力学chaotic layer 混沌层chaotic region 混沌区chemically peculiar star 化学特殊星Christmas Tree cluster ( NGC 2264 ) 圣诞树星团chromosphere-corona transition zone 色球-日冕过渡层chromospheric activity 色球活动chromospherically active banary 色球活动双星chromospherically active star 色球活动星chromospheric line 色球谱线chromospheric matirial 色球物质chromospheric spectrum 色球光谱CID, charge injected device CID、电荷注入器件circular solution 圆轨解circumnuclear star-formation 核周产星circumscribed halo 外接日晕circumstellar dust disk 星周尘盘circumstellar material 星周物质circumsystem material 双星周物质classical Algol system 经典大陵双星classical quasar 经典类星体classical R Coronae Borealis star 经典北冕R 型星classical T Tauri star 经典金牛T 型星Clementine 〈克莱芒蒂娜〉环月测绘飞行器closure phase imaging 锁相成象cluster centre 团中心cluster galaxy 团星系COBE, Cosmic Background Explorer 宇宙背景探测器coded mask imaging 编码掩模成象coded mask telescope 编码掩模望远镜collapsing cloud 坍缩云cometary burst 彗暴cometary dynamics 彗星动力学cometary flare 彗耀cometary H Ⅱregion 彗状电离氢区cometary outburst 彗爆发cometary proplyd 彗状原行星盘comet shower 彗星雨common proper-motion binary 共自行双星common proper-motion pair 共自行星对compact binary galaxy 致密双重星系compact cluster 致密星团; 致密星系团compact flare 致密耀斑composite diagram method 复合图法composite spectrum binary 复谱双星computational astrophysics 计算天体物理computational celestial mechanics 计算天体力学contact copying 接触复制contraction age 收缩年龄convective envelope 对流包层cooling flow 冷却流co-orbital satellite 共轨卫星coplanar orbits 共面轨道Copernicus 〈哥白尼〉卫星coprocessor 协处理器Cordelia 天卫六core-dominated quasar ( CDQ ) 核占优类星体coronal abundance 冕区丰度coronal activity 星冕活动、日冕活动coronal dividing line 冕区分界线coronal gas 星冕气体、日冕气体coronal green line 星冕绿线、日冕绿线coronal helmet 冕盔coronal magnetic energy 冕区磁能coronal red line 星冕红线、日冕红线cosmic abundance 宇宙丰度cosmic string 宇宙弦cosmic void 宇宙巨洞COSMOS 〈COSMOS〉底片自动测量仪C-O white dwarf 碳氧白矮星Cowling approximation 柯林近似Cowling mechnism 柯林机制Crescent nebula ( NGC 6888 ) 蛾眉月星云Cressida 天卫九critical equipotential lobe 临界等位瓣cross-correlation method 交叉相关法cross-correlation technique 交叉相关法cross disperser prism 横向色散棱镜crustal dynamics 星壳动力学cryogenic camera 致冷照相机cushion distortion 枕形畸变cut-off error 截断误差Cyclops project 〈独眼神〉计划D abundance 氘丰度Dactyl 艾卫dark halo 暗晕data acquisition 数据采集decline phase 下降阶段deep-field observation 深天区观测density arm 密度臂density profile 密度轮廓dereddening 红化改正Desdemona 天卫十destabiliizing effect 去稳效应dew shield 露罩diagonal mirror 对角镜diagnostic diagram 诊断图differential reddening 较差红化diffuse density 漫射密度diffuse dwarf 弥漫矮星系diffuse X-ray 弥漫X 射线diffusion approximation 扩散近似digital optical sky survey 数字光学巡天digital sky survey 数字巡天disappearance 掩始cisconnection event 断尾事件dish 碟形天线disk globular cluster 盘族球状星团dispersion measure 频散量度dissector 析象管distance estimator 估距关系distribution parameter 分布参数disturbed galaxy 受扰星系disturbing galaxy 扰动星系Dobsonian mounting 多布森装置Dobsonian reflector 多布森反射望远镜Dobsonian telescope 多布森望远镜dominant galaxy 主星系double-mode cepheid 双模造父变星double-mode pulsator 双模脉动星double-mode RR Lyrae star 双模天琴RR 型星double-ring galaxy 双环星系DQ Herculis star 武仙DQ 型星dredge-up 上翻drift scanning 漂移扫描driving system 驱动系统dumbbell radio galaxy 哑铃状射电星系Du Pont Telescope 杜邦望远镜dust ring 尘环dwarf carbon star 碳矮星dwarf spheroidal 矮球状星系dwarf spheroidal galaxy 矮球状星系dwarf spiral 矮旋涡星系dwarf spiral galaxy 矮旋涡星系dynamical age 动力学年龄dynamical astronomy 动力天文dynamical evolution 动力学演化Eagle nebula ( M 16 ) 鹰状星云earty cluster 早型星系团early earth 早期地球early planet 早期行星early-stage star 演化早期星early stellar evolution 恒星早期演化early sun 早期太阳earth-approaching asteroid 近地小行星earth-approaching comet 近地彗星earth-approaching object 近地天体earth-crossing asteroid 越地小行星earth-crossing comet 越地彗星earth-crossing object 越地天体earth orientation parameter 地球定向参数earth rotation parameter 地球自转参数eccentric-disk model 偏心盘模型effect of relaxation 弛豫效应Egg nebula ( AFGL 2688 ) 蛋状星云electronographic photometry 电子照相测光elemental abundance 元素丰度elliptical 椭圆星系elliptical dwarf 椭圆矮星系emulated data 仿真数据emulation 仿真encounter-type orbit 交会型轨道enhanced network 增强网络equatorial rotational velocity 赤道自转速度equatorium 行星定位仪equipartition of kinetic energy 动能均分eruptive period 爆发周期Eskimo nebula ( NGC 2392 ) 爱斯基摩星云estimated accuracy 估计精度estimation theory 估计理论EUVE, Extreme Ultraviolet Explorer 〈EUVE〉极紫外探测器Exclamation Mark galaxy 惊叹号星系Exosat 〈Exosat〉欧洲X 射线天文卫星extended Kalman filter 扩充卡尔曼滤波器extragalactic jet 河外喷流extragalactic radio astronomy 河外射电天文extrasolar planet 太阳系外行星extrasolar planetary system 太阳系外行星系extraterrestrial intelligence 地外智慧生物extreme helium star 极端氦星Fabry-Perot imaging spectrograph 法布里-珀罗成象摄谱仪Fabry-Perot interferometry 法布里-珀罗干涉测量Fabry-Perot spectrograph 法布里-珀罗摄谱仪face-on galaxy 正向星系face-on spiral 正向旋涡星系facility seeing 人为视宁度fall 见落陨星fast pulsar 快转脉冲星fat zero 胖零Fermi normal coordinate system 费米标准坐标系Fermi-Walker transportation 费米-沃克移动fibre spectroscopy 光纤分光field centre 场中心field galaxy 场星系field pulsar 场脉冲星filter photography 滤光片照相观测filter wheel 滤光片转盘find 发见陨星finder chart 证认图finderscope 寻星镜first-ascent giant branch 初升巨星支first giant branch 初升巨星支flare puff 耀斑喷焰flat field 平场flat field correction 平场改正flat fielding 平场处理flat-spectrum radio quasar 平谱射电类星体flux standard 流量标准星flux-tube dynamics 磁流管动力学f-mode f 模、基本模following limb 东边缘、后随边缘foreground galaxy 前景星系foreground galaxy cluster 前景星系团formal accuracy 形式精度Foucaultgram 傅科检验图样Foucault knife-edge test 傅科刀口检验fourth cosmic velocity 第四宇宙速度frame transfer 帧转移Fresnel lens 菲涅尔透镜fuzz 展云Galactic aggregate 银河星集Galactic astronomy 银河系天文Galactic bar 银河系棒galactic bar 星系棒galactic cannibalism 星系吞食galactic content 星系成分galactic merge 星系并合galactic pericentre 近银心点Galactocentric distance 银心距galaxy cluster 星系团Galle ring 伽勒环Galilean transformation 伽利略变换Galileo 〈伽利略〉木星探测器gas-dust complex 气尘复合体Genesis rock 创世岩Gemini Telescope 大型双子望远镜Geoalert, Geophysical Alert Broadcast 地球物理警报广播giant granulation 巨米粒组织giant granule 巨米粒giant radio pulse 巨射电脉冲Ginga 〈星系〉X 射线天文卫星Giotto 〈乔托〉空间探测器glassceramic 微晶玻璃glitch activity 自转突变活动global change 全球变化global sensitivity 全局灵敏度GMC, giant molecular cloud 巨分子云g-mode g 模、重力模gold spot 金斑病GONG, Global Oscillation Network 太阳全球振荡监测网GroupGPS, global positioning system 全球定位系统Granat 〈石榴〉号天文卫星grand design spiral 宏象旋涡星系gravitational astronomy 引力天文gravitational lensing 引力透镜效应gravitational micro-lensing 微引力透镜效应great attractor 巨引源Great Dark Spot 大暗斑Great White Spot 大白斑grism 棱栅GRO, Gamma-Ray Observatory γ射线天文台guidscope 导星镜GW Virginis star 室女GW 型星habitable planet 可居住行星Hakucho 〈天鹅〉X 射线天文卫星Hale Telescope 海尔望远镜halo dwarf 晕族矮星halo globular cluster 晕族球状星团Hanle effect 汉勒效应hard X-ray source 硬X 射线源Hay spot 哈伊斑HEAO, High-Energy Astronomical 〈HEAO〉高能天文台Observatoryheavy-element star 重元素星heiligenschein 灵光Helene 土卫十二helicity 螺度heliocentric radial velocity 日心视向速度heliomagnetosphere 日球磁层helioseismology 日震学helium abundance 氦丰度helium main-sequence 氦主序helium-strong star 强氦线星helium white dwarf 氦白矮星Helix galaxy ( NGC 2685 ) 螺旋星系Herbig Ae star 赫比格Ae 型星Herbig Be star 赫比格Be 型星Herbig-Haro flow 赫比格-阿罗流Herbig-Haro shock wave 赫比格-阿罗激波hidden magnetic flux 隐磁流high-field pulsar 强磁场脉冲星highly polarized quasar ( HPQ ) 高偏振类星体high-mass X-ray binary 大质量X 射线双星high-metallicity cluster 高金属度星团;高金属度星系团high-resolution spectrograph 高分辨摄谱仪high-resolution spectroscopy 高分辨分光high - z 大红移Hinotori 〈火鸟〉太阳探测器Hipparcos, High Precision Parallax 〈依巴谷〉卫星Collecting SatelliteHipparcos and Tycho Catalogues 〈依巴谷〉和〈第谷〉星表holographic grating 全息光栅Hooker Telescope 胡克望远镜host galaxy 寄主星系hot R Coronae Borealis star 高温北冕R 型星HST, Hubble Space Telescope 哈勃空间望远镜Hubble age 哈勃年龄Hubble distance 哈勃距离Hubble parameter 哈勃参数Hubble velocity 哈勃速度hump cepheid 驼峰造父变星Hyad 毕团星hybrid-chromosphere star 混合色球星hybrid star 混合大气星hydrogen-deficient star 缺氢星hydrogenous atmosphere 氢型大气hypergiant 特超巨星Ida 艾达( 小行星243号)IEH, International Extreme Ultraviolet 〈IEH〉国际极紫外飞行器HitchhikerIERS, International Earth Rotation 国际地球自转服务Serviceimage deconvolution 图象消旋image degradation 星象劣化image dissector 析象管image distoration 星象复原image photon counting system 成象光子计数系统image sharpening 星象增锐image spread 星象扩散度imaging polarimetry 成象偏振测量imaging spectrophotometry 成象分光光度测量immersed echelle 浸渍阶梯光栅impulsive solar flare 脉冲太阳耀斑infralateral arc 外侧晕弧infrared CCD 红外CCDinfrared corona 红外冕infrared helioseismology 红外日震学infrared index 红外infrared observatory 红外天文台infrared spectroscopy 红外分光initial earth 初始地球initial mass distribution 初始质量分布initial planet 初始行星initial star 初始恒星initial sun 初始太阳inner coma 内彗发inner halo cluster 内晕族星团integrability 可积性Integral Sign galaxy ( UGC 3697 ) 积分号星系integrated diode array ( IDA ) 集成二极管阵intensified CCD 增强CCDIntercosmos 〈国际宇宙〉天文卫星interline transfer 行间转移intermediate parent body 中间母体intermediate polar 中介偏振星international atomic time 国际原子时International Celestial Reference 国际天球参考系Frame ( ICRF )intraday variation 快速变化intranetwork element 网内元intrinsic dispersion 内廪弥散度ion spot 离子斑IPCS, Image Photon Counting System 图象光子计数器IRIS, Infrared Imager / Spectrograph 红外成象器/摄谱仪IRPS, Infrared Photometer / Spectro- 红外光度计/分光计meterirregular cluster 不规则星团; 不规则星系团IRTF, NASA Infrared Telescope 〈IRTF〉美国宇航局红外Facility 望远镜IRTS, Infrared Telescope in Space 〈IRTS〉空间红外望远镜ISO, Infrared Space Observatory 〈ISO〉红外空间天文台isochrone method 等龄线法IUE, International Ultraviolet 〈IUE〉国际紫外探测器ExplorerJewel Box ( NGC 4755 ) 宝盒星团Jovian magnetosphere 木星磁层Jovian ring 木星环Jovian ringlet 木星细环Jovian seismology 木震学jovicentric orbit 木心轨道J-type star J 型星Juliet 天卫十一Jupiter-crossing asteroid 越木小行星Kalman filter 卡尔曼滤波器KAO, Kuiper Air-borne Observatory 〈柯伊伯〉机载望远镜Keck ⅠTelescope 凯克Ⅰ望远镜Keck ⅡTelescope 凯克Ⅱ望远镜Kuiper belt 柯伊伯带Kuiper-belt object 柯伊伯带天体Kuiper disk 柯伊伯盘LAMOST, Large Multi-Object Fibre 大型多天体分光望远镜Spectroscopic TelescopeLaplacian plane 拉普拉斯平面late cluster 晚型星系团LBT, Large Binocular Telescope 〈LBT〉大型双筒望远镜lead oxide vidicon 氧化铅光导摄象管Leo Triplet 狮子三重星系LEST, Large Earth-based Solar 〈LEST〉大型地基太阳望远镜Telescopelevel-Ⅰcivilization Ⅰ级文明level-Ⅱcivilization Ⅱ级文明level-Ⅲcivilization Ⅲ级文明Leverrier ring 勒威耶环Liapunov characteristic number 李雅普诺夫特征数( LCN )light crown 轻冕玻璃light echo 回光light-gathering aperture 聚光孔径light pollution 光污染light sensation 光感line image sensor 线成象敏感器line locking 线锁line-ratio method 谱线比法Liner, low ionization nuclear 低电离核区emission-line regionline spread function 线扩散函数LMT, Large Millimeter Telescope 〈LMT〉大型毫米波望远镜local galaxy 局域星系local inertial frame 局域惯性架local inertial system 局域惯性系local object 局域天体local star 局域恒星look-up table ( LUT ) 对照表low-mass X-ray binary 小质量X 射线双星low-metallicity cluster 低金属度星团;低金属度星系团low-resolution spectrograph 低分辨摄谱仪low-resolution spectroscopy 低分辨分光low - z 小红移luminosity mass 光度质量luminosity segregation 光度层化luminous blue variable 高光度蓝变星lunar atmosphere 月球大气lunar chiaroscuro 月相图Lunar Prospector 〈月球勘探者〉Ly-αforest 莱曼-α森林MACHO ( massive compact halo 晕族大质量致密天体object )Magellan 〈麦哲伦〉金星探测器Magellan Telescope 〈麦哲伦〉望远镜magnetic canopy 磁蓬magnetic cataclysmic variable 磁激变变星magnetic curve 磁变曲线magnetic obliquity 磁夹角magnetic period 磁变周期magnetic phase 磁变相位magnitude range 星等范围main asteroid belt 主小行星带main-belt asteroid 主带小行星main resonance 主共振main-sequence band 主序带Mars-crossing asteroid 越火小行星Mars Pathfinder 火星探路者mass loss rate 质量损失率mass segregation 质量层化Mayall Telescope 梅奥尔望远镜Mclntosh classification 麦金托什分类McMullan camera 麦克马伦电子照相机mean motion resonance 平均运动共振membership of cluster of galaxies 星系团成员membership of star cluster 星团成员merge 并合merger 并合星系; 并合恒星merging galaxy 并合星系merging star 并合恒星mesogranulation 中米粒组织mesogranule 中米粒metallicity 金属度metallicity gradient 金属度梯度metal-poor cluster 贫金属星团metal-rich cluster 富金属星团MGS, Mars Global Surveyor 火星环球勘测者micro-arcsec astrometry 微角秒天体测量microchannel electron multiplier 微通道电子倍增管microflare 微耀斑microgravitational lens 微引力透镜microgravitational lensing 微引力透镜效应microturbulent velocity 微湍速度millimeter-wave astronomy 毫米波天文millisecond pulsar 毫秒脉冲星minimum mass 质量下限minimum variance 最小方差mixed-polarity magnetic field 极性混合磁场MMT, Multiple-Mirror Telescope 多镜面望远镜moderate-resolution spectrograph 中分辨摄谱仪moderate-resolution spectroscopy 中分辨分光modified isochrone method 改进等龄线法molecular outflow 外向分子流molecular shock 分子激波monolithic-mirror telescope 单镜面望远镜moom 行星环卫星moon-crossing asteroid 越月小行星morphological astronomy 形态天文morphology segregation 形态层化MSSSO, Mount Stromlo and Siding 斯特朗洛山和赛丁泉天文台Spring Observatorymultichannel astrometric photometer 多通道天测光度计( MAP )multi-object spectroscopy 多天体分光multiple-arc method 复弧法multiple redshift 多重红移multiple system 多重星系multi-wavelength astronomy 多波段天文multi-wavelength astrophysics 多波段天体物理naked-eye variable star 肉眼变星naked T Tauri star 显露金牛T 型星narrow-line radio galaxy ( NLRG ) 窄线射电星系Nasmyth spectrograph 内氏焦点摄谱仪natural reference frame 自然参考架natural refenence system 自然参考系natural seeing 自然视宁度near-contact binary 接近相接双星near-earth asteroid 近地小行星near-earth asteroid belt 近地小行星带near-earth comet 近地彗星NEO, near-earth object 近地天体neon nova 氖新星Nepturian ring 海王星环neutrino astrophysics 中微子天文NNTT, National New Technology Telescope国立新技术望远镜NOAO, National Optical Astronomical 国立光学天文台Observatoriesnocturnal 夜间定时仪nodal precession 交点进动nodal regression 交点退行non-destroy readout ( NDRO ) 无破坏读出nonlinear infall mode 非线性下落模型nonlinear stability 非线性稳定性nonnucleated dwarf elliptical 无核矮椭圆星系nonnucleated dwarf galaxy 无核矮星系nonpotentiality 非势场性nonredundant masking 非过剩遮幅成象nonthermal radio halo 非热射电晕normal tail 正常彗尾North Galactic Cap 北银冠NOT, Nordic Optical Telescope 北欧光学望远镜nova rate 新星频数、新星出现率NTT, New Technology Telescope 新技术望远镜nucleated dwarf elliptical 有核矮椭圆星系nucleated dwarf galaxy 有核矮星系number density profile 数密度轮廓numbered asteroid 编号小行星oblique pulsator 斜脉动星observational cosmology 观测宇宙学observational dispersion 观测弥散度observational material 观测资料observing season 观测季occultation band 掩带O-Ne-Mg white dwarf 氧氖镁白矮星one-parameter method 单参数法on-line data handling 联机数据处理on-line filtering 联机滤波open cluster of galaxies 疏散星系团Ophelia 天卫七optical aperture-synthesis imaging 光波综合孔径成象optical arm 光学臂optical disk 光学盘optical light 可见光optical luminosity function 光学光度函数optically visible object 光学可见天体optical picture 光学图optical spectroscopy 光波分光orbital circularization 轨道圆化orbital eccentricity 轨道偏心率orbital evolution 轨道演化orbital frequency 轨道频率orbital inclination 轨道倾角orbit plane 轨道面order region 有序区organon parallacticon 星位尺Orion association 猎户星协orrery 太阳系仪orthogonal transformation 正交变换oscillation phase 振动相位outer asteroid belt 外小行星带outer-belt asteroid 外带小行星outer halo cluster 外晕族星团outside-eclipse variation 食外变光overshoot 超射OVV quasar, optically violently OVV 类星体variable quasar、optically violent variablequasaroxygen sequence 氧序pan 摇镜头parry arc 彩晕弧partial-eclipse solution 偏食解particle astrophysics 粒子天体物理path of annularity 环食带path of totality 全食带PDS, photo-digitizing system、PDS、数字图象仪、photometric data system 测光数据仪penetrative convection 贯穿对流pentaprism test 五棱镜检验percolation 渗流periapse 近质心点periapse distance 近质心距periapsis distance 近拱距perigalactic distance 近银心距perigalacticon 近银心点perimartian 近火点period gap 周期空隙period-luminosity-colour relation 周光色关系PG 1159 star PG 1159 恒星photoflo 去渍剂photographic spectroscopy 照相分光photometric accuracy 测光精度photometric error 测光误差photometric night 测光夜photometric standard star 测光标准星photospheric abundance 光球丰度photospheric activity 光球活动photospheric line 光球谱线planetary biology 行星生物学planetary geology 行星地质学Pleiad 昴团星plerion 类蟹遗迹plerionic remnant 类蟹遗迹plerionic supernova remnant 类蟹超新星遗迹plumbicon 氧化铅光导摄象管pluton 类冥行星p-mode p 模、压力模pointimg accuracy 指向精度point spread function 点扩散函数polarimetric standard star 偏振标准星polarization standard star 偏振标准星polar-ring galaxy 极环星系Portia 天卫十二post AGB star AGB 后恒星post-core-collapse cluster 核心坍缩后星团post-coronal region 冕外区post-main-sequence star 主序后星post red-supergiant 红超巨后星post starburst galaxy 星暴后星系post T Tauri star 金牛T 后星potassium-argon dating 钾氩计年precataclysmic binary 激变前双星precataclysmic variable 激变前变星preceding limb 西边缘、前导边缘precessing-disk model 进动盘模型precession globe 岁差仪precession period 进动周期preflash 预照光pre-main-sequence spectroscopic 主序前分光双星binarypre-planetary disk 前行星盘pre-white dwarf 白矮前身星primary crater 初级陨击坑primordial binary 原始双星principle of mediocrity 折衷原则progenitor 前身星; 前身天体progenitor star 前身星projected density profile 投影密度轮廓proper-motion membership 自行成员星proper reference frame 固有参考架proper reference system 固有参考系proplyd 原行星盘proto-binary 原双星proto-cluster 原星团proto-cluster of galaxies 原星系团proto-earth 原地球proto-galactic cloud 原星系云proto-galactic object 原星系天体proto-Galaxy 原银河系proto-globular cluster 原球状星团proto-Jupiter 原木星proto-planet 原行星proto-planetary disk 原行星盘proto-planetary system 原行星系proto-shell star 原气壳星proto-sun 原太阳pseudo body-fixed system 准地固坐标系Puck 天卫十五pulsar time scale 脉冲星时标pulsation axis 脉动对称轴pulsation equation 脉动方程pulsation frequency 脉动频率pulsation phase 脉动阶段pulsation pole 脉动极pulse light curve 脉冲光变曲线pyrometry 高温测量QPO, quasi-periodic oscillation 似周期振荡quantum cosmology 量子宇宙学quantum universe 量子宇宙quasar astronomy 类星体天文quiescence 宁静态radial pulsator 径向脉动星radial-velocity orbit 分光解radial-velocity reference star 视向速度参考星radial-velocity standard star 视向速度标准星radial-velocity survey 视向速度巡天radio arm 射电臂radio counterpart 射电对应体radio loud quasar 强射电类星体radio observation 射电观测radio picture 射电图radio pollution 射电污染radio supernova 射电超新星rapid burster 快暴源rapidly oscillating Ap star 快速振荡Ap 星readout 读出readout noise 读出噪声recycled pulsar 再生脉冲星reddened galaxy 红化星系reddened object 红化天体reddened quasar 红化类星体red horizontal branch ( RHB ) 红水平分支red nebulous object ( RNO ) 红色云状体Red Rectangle nebula 红矩形星云redshift survey 红移巡天red straggler 红离散星reflex motion 反映运动regression period 退行周期regular cluster 规则星团; 规则星系团relaxation effect 弛豫效应reset 清零resonance overlap theory 共振重叠理论return-beam tube 回束摄象管richness parameter 富度参数Ring nebula ( M 57、NGC 6720 ) 环状星云ring-plane crossing 环面穿越Rosalind 天卫十三ROSA T, Roentgensatellit 〈ROSAT〉天文卫星Rosette Molecular Cloud ( RMC ) 玫瑰分子云Rossby number 罗斯贝数rotating variable 自转变星rotational evolution 自转演化rotational inclination 自转轴倾角rotational modulation 自转调制rotational period 自转周期rotational phase 自转相位rotational pole 自转极rotational velocity 自转速度rotation frequency 自转频率rotation phase 自转相位rotation rate 自转速率rubber second 负闰秒rubidium-strontium dating 铷锶计年Sagittarius dwarf 人马矮星系Sagittarius dwarf galaxy 人马矮星系Sagittarius galaxy 人马星系Saha equation 沙哈方程Sakigake 〈先驱〉空间探测器Saturn-crossing asteroid 越土小行星Saturnian ringlet 土星细环Saturnshine 土星反照scroll 卷滚Sculptor group 玉夫星系群Sculptor Supercluster 玉夫超星系团Sculptor void 玉夫巨洞secondary crater 次级陨击坑secondary resonance 次共振secular evolution 长期演化secular resonance 长期共振seeing management 视宁度控管segregation 层化selenogony 月球起源学separatrice 分界sequential estimation 序贯估计sequential processing 序贯处理serendipitous X-ray source 偶遇X 射线源serendipitous γ-ray source 偶遇γ射线源Serrurier truss 赛路里桁架shell galaxy 壳星系shepherd satellite 牧羊犬卫星shock temperature 激波温度silicon target vidicon 硅靶光导摄象管single-arc method 单弧法SIRTF, Space Infrared Telescope 空间红外望远镜Facilityslitless spectroscopy 无缝分光slit spectroscopy 有缝分光slow pulsar 慢转脉冲星SMM, Solar Maximum MIssion 太阳极大使者SMT, Submillimeter Telescope 亚毫米波望远镜SOFIA, Stratospheric Observatory for 〈索菲雅〉机载红外望远镜Infrared Astronomysoft γ-ray burst repeater 软γ暴复现源soft γrepeater ( SGR ) 软γ射线复现源SOHO, Solar and Heliospheric 〈索贺〉太阳和太阳风层探测器Observatorysolar circle 太阳圈solar oscillation 太阳振荡solar pulsation 太阳脉动solar-radiation pressure 太阳辐射压solar-terrestrial environment 日地环境solitary 孤子性soliton star 孤子星South Galactic Cap 南银冠South Galactic Pole 南银极space density profile 空间密度轮廓space geodesy 空间大地测量space geodynamics 空间地球动力学Spacelab 空间实验室spatial mass segregation 空间质量分层speckle masking 斑点掩模speckle photometry 斑点测光speckle spectroscopy 斑点分光spectral comparator 比长仪spectrophotometric distance 分光光度距离spectrophotometric standard 分光光度标准星spectroscopic period 分光周期specular density 定向密度spherical dwarf 椭球矮星系spin evolution 自旋演化spin period 自旋周期spin phase 自旋相位spiral 旋涡星系spiral arm tracer 示臂天体Spoerer minimum 斯珀勒极小spotted star 富黑子恒星SST, Spectroscopic Survey Telescope 分光巡天望远镜standard radial-velocity star 视向速度标准星standard rotational-velocity star 自转速度标准星standard velocity star 视向速度标准星starburst 星暴starburst galaxy 星暴星系starburst nucleus 星暴star complex 恒星复合体star-formation activity 产星活动star-formation burst 产星暴star-formation efficiency ( SFE ) 产星效率star-formation rate 产星率star-formation region 产星区star-forming region 产星区starpatch 星斑static property 静态特性statistical orbit-determination 统计定轨理论theorysteep-spectrum radio quasar 陡谱射电类星体stellar environment 恒星环境stellar halo 恒星晕stellar jet 恒星喷流stellar speedometer 恒星视向速度仪stellar seismology 星震学Stokes polarimetry 斯托克斯偏振测量strange attractor 奇异吸引体strange star 奇异星sub-arcsec radio astronomy 亚角秒射电天文学Subaru Telescope 昴星望远镜subcluster 次团subclustering 次成团subdwarf B star B 型亚矮星subdwarf O star O 型亚矮星subgiant branch 亚巨星支submilliarcsecond optical astrometry 亚毫角秒光波天体测量submillimeter astronomy 亚毫米波天文submillimeter observatory 亚毫米波天文台submillimeter photometry 亚毫米波测光submillimeter space astronomy 亚毫米波空间天文submillimeter telescope 亚毫米波望远镜submillisecond optical pulsar 亚毫秒光学脉冲星submillisecond pulsar 亚毫秒脉冲星submillisecond radio pulsar 亚毫秒射电脉冲星substellar object 亚恒星天体subsynchronism 亚同步subsynchronous rotation 亚同步自转Sunflower galaxy ( M 63 ) 葵花星系sungrazer comet 掠日彗星supercluster 超星团; 超星系团supergalactic streamer 超星系流状结构supergiant molecular cloud ( SGMC ) 超巨分子云superhump 长驼峰superhumper 长驼峰星supermaximum 长极大supernova rate 超新星频数、超新星出现率supernova shock 超新星激波superoutburst 长爆发superwind galaxy 超级风星系supporting system 支承系统surface activity 表面活动surface-brightness profile 面亮度轮廓surface-channel CCD 表面型CCDSU Ursae Majoris star 大熊SU 型星SWAS, Submillimeter Wave Astronomy 亚毫米波天文卫星Satallitesymbiotic binary 共生双星symbiotic Mira 共生刍藁symbiotic nova 共生新星synthetic-aperture radar 综合孔径雷达systemic velocity 质心速度TAMS, terminal-age main sequence 终龄主序Taurus molecular cloud ( TMC ) 金牛分子云TDT, terrestrial dynamical time 地球力学时television guider 电视导星器television-type detector 电视型探测器Tenma 〈天马〉X 射线天文卫星terrestrial reference system 地球参考系tetrad 四元基thermal background 热背景辐射thermal background radiation 热背景辐射thermal pulse 热脉冲thermonuclear runaway 热核暴涨thick-disk population 厚盘族thinned CCD 薄型CCDthird light 第三光源time-signal station 时号台timing age 计时年龄tomograph 三维结构图toner 调色剂torquetum 赤基黄道仪TRACE, Transition Region and Coronal 〈TRACE〉太阳过渡区和日冕Explorer 探测器tracker 跟踪器transfer efficiency 转移效率transition region line 过渡区谱线trans-Nepturnian object 海外天体Trapezium cluster 猎户四边形星团triad 三元基tri-dimensional spectroscopy 三维分光triquetum 三角仪tuning-fork diagram 音叉图。
eds单一光谱

eds单一光谱
EDS,全称为能量色散X射线光谱仪,是一种常用的元素分析仪器。
其工作原理基于X射线与物质相互作用后产生的能量色散现象。
当X射线管产生的X射线辐射在物体表面时,待测样品的内层电子被逐出,产生空穴,整个原子体系处于不稳定的激发态。
外层电子自发地以辐射跃迁的方式回到内层填补空穴,产生X特征射线。
这些X射线的能量与入射能量无关,而是由两能级之间的能量差决定。
当这些特征X射线光子进入硅渗锂探测器后,它们将硅原子电离,产生若干电子-空穴对。
这些电子-空穴对的数量与光子的能量成正比。
利用偏压收集这些空穴电子对,经过一系列转换器后变成电压脉冲供给多脉冲高度分析器,并计数能谱中每个能带的脉冲数。
EDS谱峰的峰位对应一个元素,这是因为不同层的电子跃迁会产生不同的谱线。
因此,EDS谱线是把所有特征X射线脉冲的累积分开得到的。
这使得我们可以理解,谱线越多,说明外层电子占有壳层越多。
然而,需要强调的是,谱峰的数量与元素的含量高低并没有直接关系。
定量分析是根据不同元素来选择不同线系的谱峰强度以及这个元素的响应值来做计算的。
XPS EDS 分析
A synchrotron XPS study of the vanadia–titania system as a modelfor monolayer oxide catalystsNicola J.Price 1,John B.Reitz 2,Robert J.Madix 1,2,*,E.I.Solomon 2aDepartment of Chemical Engineering,Standford University,Stanford,CA 94305,USAbDepartment of Chemistry,Stanford University,Stanford,CA 94305,USAReceived 16December 1997;accepted 23June 1998AbstractThe deposition of vanadium metal onto stoichiometric TiO 2(110)has been studied with photoelectron spectroscopy from low to high coverages of vanadium.A synchrotron source was employed in XPS experiments for the study of submonolayer coverages of vanadium in order to determine the oxidation state of the vanadia species formed at submonolayer coverages.The exposure of the titania surface to vanadium metal results in charge-transfer from vanadium to titania at the interface.At low doses of the metal vigorous interaction between the metal and titania surface yields reduction of the Ti 4ϩspecies to Ti 3ϩat the interface,as evidenced by both changes in the lineshape of the Ti 2p XPS spectra and Ti LIII-edge spectra.Concurrent with this surface reduction vanadium metal is oxidized.At higher vanadium doses the vanadium 2p binding energy indicates the formation of metallic vanadium.When metallic vanadium deposition is followed by exposure of the surface to oxygen,only one vanadium species remains on the surface,the binding energy of which corresponds to that of the oxide present initially at low doses of vanadium metal.By comparison of the V 2p binding energies to those of bulk oxides,it appears that the oxidation state of the vanadium in the oxide species is ϩ3,suggesting the formation of V 2O 3on the surface.Vanadium LIII-edge data also suggest that V 2O 5is not formed by the oxidation of predosed vanadium metal.᭧1999Elsevier Science B.V.All rights reserved.Keywords:Binding energy;Monolayer oxide catalysts;Vanadia–titania systems1.IntroductionThe vanadia–titania system has received consider-able attention in recent years [1–3].Vanadia supported on titania is used as a catalyst for a number of industrially important reactions,including the selective catalytic reduction (SCR)of NO x by NH 3and hydrocarbon oxidation [4,5].It has been reported that the catalytic activity of vanadia monolayers supported on a titania surface is greatly enhanced ascompared to unsupported V 2O 5,or vanadia supported on other metal oxides such as Al 2O 3or SiO 2[4,6].Not only does the TiO 2act as a support for the vanadia,thus increasing the total catalyst surface area,but enhanced catalytic activity or specificity may result from interactions between the support and the cata-lyst.Indeed,it has been postulated that as a result of its complex nature,more than one vanadium species exists at the vanadia–titania interface [7],although earlier studies have indicated that in such systems vanadium is present in oxidation state ϩ5[8,9].There is surprisingly little known about the structure or electronic structure of these mixed oxide layers,0368-2048/99/$-see front matter ᭧1999Elsevier Science B.V.All rights reserved.PII:S0368-2048(98)00291-6*Corresponding author.Tel.:001-415-7232402;Fax:001-415-7239780;e-mail:rjm@both of which are fundamental to an understanding of the origin of the unique catalytic properties of these mixed oxide overlayers.Such information should be accessible by the study of model oxide surfaces utilizing single crystal oxide supports.The aim of the present study was to probe the state of the interface formed when various vanadium species(metallic and oxidic)were deposited on the stoichiometric surface of TiO2(110).This surface was chosen as its structure is well understood and clean, stoichiometric surfaces can be prepared with relative ease.In a recent study by Zhang et al.[10],XPS was utilized to characterizefilms formed during vana-dium/vanadia deposition on both the stoichiometric and reduced surfaces of TiO2(110).For low vanadium exposures on the stoichiometric titania surface the vanadium was in an oxidized state.For higher vana-dium coverages,metallic vanadium was the dominant species.While it was concluded that initially vana-dium was oxidized,the oxidation state of the vana-dium in this layer remained undetermined due to the low intensity of the laboratory X-ray source used.In the work reported here,a synchrotron X-ray source was used to determine the oxidation state of vanadium in the vanadia species formed at the VO x TiO2inter-face,even at submonolayer coverages.2.ExperimentalAll experiments were performed in a stainless steel ultrahigh vacuum(UHV)chamber with a base pressureϳ1×10Ϫ10Torr at Standford Synchrotron Radiation Laboratories(SSRL)on VUV beamline10-1,which employs a spherical grating monochromator. Entrance and exit slits were adjusted to maintain a resolution better than0.3eV.The photon energy used was tuned such that the observed photoelectrons had kinetic energies in the80–200eV range in order to minimize the electron escape depth.For Ti2p 550eV photons were employed;for V2p650eV photons were used.Raw data were normalized to the current of the storage ring,using an I0detector. Peak positions were referenced to the position of the Ti2p3/2peak of titania in its fully oxidized form, which was taken to be458eV.[11]The UHV chamber was equipped with low-energy electron diffraction (LEED),and a double-pass cylindrical mirror analyzer(CMA),operated at a pass energy of 25eV,was used for electron energy analysis.The 10mm×10mm TiO2(110)(rutile)sample was attached to a molybdenum stub by tantalum clips at the base of an XYZ manipulator.Surface heating was performed using a resistively heated tungstenfilament which was situated behind the molybdenum stub.The crystal temperature was measured using a chromel/ alumel thermocouple which was spotwelded to the sample support;calibration of the true surface temperature was determined with an optical pyrom-eter.Gas doses for sample cleaning and oxidation exposure were performed by backfilling the chamber through a Varian variable leak valve using high purity gases(MathesonϾ99.9%),monitoring the pressure with an ionization gauge.Deposition of metallic vana-dium was carried out using an evaporator in which a tungstenfilament wrapped with99.999%vanadium wire(ESPI,0.005@diameter)was resistively heated. The source was surrounded with a tantalum shield to limit the deposition of the metal to a small region.The evaporator was outgassed thoroughly before use. The single crystal TiO2(110)surface was slightly bulk reduced by annealing in vacuo for a period ofϳ12h at800K.This annealing process produces a sufficient number of bulk vacancies in the sample to ensure necessary conductivity,such that charging is not a problem during XPS measurements.Following this procedure,no observable charging effects were apparent throughout the course of the experiments. The stoichiometric surface of titania(i.e.,where the titanium cations exist in the Ti4ϩ3d0electronic state) was prepared by argon-ion bombardment for20min at2keV(5×10Ϫ5Torr argon)followed by10min at 0.5keV(5×10Ϫ5Torr argon)and then by annealing the sample to800K and cooling inϳ50mbarr O2for a period of5min.Surface order was checked with LEED,and very sharp(1×1)LEED patterns were obtained for the stoichiometric TiO2(110)surface prepared following this procedure.The reduced TiO2(110)surface(i.e.Ti3ϩ,3d1)was prepared following the same argon-ion bombardment condi-tions,but without the subsequent oxygen anneal. Surface cleanliness was checked with XPS.The XPS spectra werefit by Gaussian line shapes. In a single comparison,a Gaussian/Lorenzian mix gave identical results to within0.1%.Spin-orbit split peaks were constrained to their theoretical ratio.N.J.Price et al./Journal of Electron Spectroscopy and Related Phenomena98–99(1999)257–266 2583.Results and discussion3.1.Stoichiometric and reduced TiO2(110)Fig.1illustrates Ti2p XPS spectra for both the stoichiometric and reduced(ion bombarded)surfaces of TiO2(110).For the stoichiometric surface only one oxidation state of titanium is detected,the binding energy for this species being typical for titanium in oxidation stateϩ4[11].On the reduced TiO2(110) surface the presence of two titanium species is evident.Aside from the contributions from Ti4ϩspecies,shoulders present on the lower binding energy side of the Ti2p1/2and Ti2p3/2peaks are observed which can be attributed to Ti3ϩ,as has been observed in previous studies[12–15].This surface reduction indicates the presence of negatively charged oxygen vacancies in the surface region,the negative charge being shared by titanium cations adja-cent to the defect sites.It is possible that in some cases the titanium cations are reduced even beyond theϩ3 state,although such species were not detected in these studies.Reduction of TiO2to Ti2O3is also readily observed in valence band photoemission spectra[10].N.J.Price et al./Journal of Electron Spectroscopy and Related Phenomena98–99(1999)257–266259Fig.1.Ti2p XPS spectra for both the reduced(b)and stiochiometric(d)surfaces of TiO2(110).Plots(a)and(c)are the deconvolvedfits for the reduced and clean surfaces,respectively.3.2.Interaction between vanadium metal and stoichiometric TiO 2(110)Fig.2illustrates Ti 2p XPS spectra recorded for increasing vanadium metal deposition on the stoichio-metric surface of TiO 2(110).It is clear from the emer-gence of the low binding energy shoulder in the Ti 1p spectrum even at low vanadium exposures,which is present already at 20s exposure (curve c)and quite apparent at 70s exposure (curve d),that the vanadium metal interacts very strongly with this surface.Indeed,the effect of vanadium metal deposition is to reduce the titania surface in a way similar to that observed for an argon-ion bombarded surface.The shoulders at lower binding energy continue to develop with increasing vanadium coverage,indicative of forma-tion of Ti 3ϩcations.The ratio of the intensities of Ti 3ϩto Ti 4ϩfor both the Ti 2p 1/2and the Ti 2p 3/2peaks increases with increasing vanadium deposition,indicating that for higher vanadium exposures there is a preponderance of Ti 3ϩspecies in the surface region.However,the total emission from the Ti 2p core levels is attenuated with increasing vanadium deposition,consistent with overlayer formation on the surface.N.J.Price et al./Journal of Electron Spectroscopy and Related Phenomena 98–99(1999)257–266260Fig.2.Ti 2p XPS spectra recorded for various vanadium metal exposures on the stoichiometric surface of TiO 2(110).Data for (b)10s,(c)20s,(e)110s,(f)150s,(g)310s and exposures.(a)and (h)are the fits to the data for 10s (curve b)and 630s (curve i),respectively.The corresponding V 2p XPS data for this series of experiments is shown in Fig.3.At low vanadium exposure (submonolayer regime),a single vanadium species with binding energies for V 2p 1/2at 515eV (Fig.3,curves b and c)forms.As the vanadium expo-sure is increased,a second species with V2p 1/2and V 2p 3/2binding energies at 520.4eV and 512.8eV emerges (Fig.3,curves d–i).From both the V 2p and Ti 2p XPS data it is clear that charge-transfer processes occur at the V/TiO 2(110)interface.The fact that the vanadium has a strong affinity for oxygen results in competition between vanadium and the supporting titanium oxide for oxygen,resulting in the reduction of the titania and oxidation of the vanadium to VO x .Comparison of the binding energies of the V 2p core levels for the initial species to those obtained for bulk vanadium oxide powders [16–18](see Table 1),suggests that the initially-formed vanadium species is present in oxidation state 3ϩ,or,nomin-ally,V 2O 3.This result is in basic agreement with pervious work,in which the oxide was inferred to be either V 2O 3or VO 2from thermodynamic argu-ments [10].The binding energies of the second species,also present in the submonolayer regime,the amount of which increases continuously with higher exposures,is attributed to metallic vanadium [16–18].In a recent study of vanadium deposition TiO 2(001)it has been suggested that this species is vanadium in an oxidized form,as reduction of the titania surface is still seen as the amount of this species on the surface increases [19].However,by consideration of the integrated peak intensities of both species in the present study,it is evident that the amount of VO x (proposed to be V 2O 3)increases as more vanadium is deposited,even when the low binding energy species is present.Thus,it is suggested that the continued reduction of the titania surface,also observed in this work (Fig.2),is still due to the forma-tion of V 2O 3following vanadium metal deposition on the areas of the titania surface already reduced by vanadium.That the V 2p peak intensity of the VO x species continues to increase,even with the increase in metallic vanadium is strongly suggestive of three-dimensional island formation.The formation of V 2O 3necessarily relies on interaction of the vanadium with surface oxygen.It is likely that layers of vanadium metal form on top of the vanadia islands and henceN.J.Price et al./Journal of Electron Spectroscopy and Related Phenomena 98–99(1999)257–266261Fig.3.The corresponding V 2p XPS data for the same vanadium exposures as in Fig.2.The different curves have the same signifi-cance as in Fig.2.Table 1Binding energies of vanadium oxides.All values are in electron volts.Values are taken from Refs.[16–18]Material V 2p 3/2binding energy V 2p 1/2binding energy V 2O 5516.9[16]524.3[16]516.4[17]523.8[17]516.6[18]—VO 2516.2[16]523.5[16]516.1[17]523.1[17]515.7[18]—V 2O 3515.7[16]523.3[16]515.6[17]—V512.4[16]519.9[16]513.0[17]520.6[17]512.4[18]—can be seen in the XPS data even as the amount of V2O3continues to increase.The vanadium oxide formed can grow initially in a uniform layer over the titania surface orfirst form in two-dimensional islands.Of note here is the observa-tion that even when the second(metallic)vanadium species appears and grows on the titania surface,the intensity of the V2p3/2oxide peak still increases with increasing vanadium deposition(Table2).Thus, metallic vanadium appears tofind lattice oxygen originally associated with the TiO2surface,even at high exposures.This result suggest that the surface oxide grows by three-dimensional island formation or by start of a vanadium layer on top of the vanadia/titania reduced surface before a full,single layer is completed.The latter growth mechanism is compatible with a very short migration length of the metallic vanadium as it is deposited.Of note, however,is a recent combined XPS/AFM study by Chiarello et al.[15]which indicates that three-dimen-sional cone-like towers of either VO2or V2O3(spec-trometer resolution would not allow for determination of oxide species)are formed following vanadium metal deposition and oxidation in5×10Ϫ4Torr of oxygen on a stoichiometric TiO2(110)surface.3.3.Interaction of VϩO2with stochiometricTiO2(110)In an attempt to form a a higher oxidation state of vanadium on the stoichiometric titania surface,vana-dium metal was deposited and subsequently oxidized. Following vanadium metal deposition,the surface was exposed to5×10Ϫ5Torr oxygen,initially for a period offive minutes;for higher vanadium exposures oxygen was dosed for up to20min.All the experi-ments were carried out at room temperature.Fig.4 shows V2p XPS data collected for increasing vana-dium exposure and oxidation.Initially,only one vana-dium species is formed on the surface with V2p1/2and V2p3/2binding energies of523.4and515.8eV, respectively(Fig.4,curves b–e),equal to within experimental accuracy to the binding energies measured at low exposure of the surface to metallic vanadium without oxygen present.In the latter case, the fact that vanadium oxide rather than metallic vanadium initially forms on the surface is probably due to the availability of bridging oxygen species, which protrude in rows from the titania surface plane[20].In the case of vanadium metal deposition on the reduced titania surface(prepared by argon-ion bombardment to create oxygen vacancies),only layers of metallic vanadium are formed[10],indi-cating that depletion of the oxygen layer at the surface leaves no oxygen for vanadium oxidation following deposition.In the presence of ambient oxygen, adsorbed metallic vanadium readily converts to vana-dium oxide.Without this oxygen metallic vanadium remains(Fig.4,curve f).Subsequent exposure to oxygen results in conversion of this metal to the oxide,however.Higher oxides of vanadium, e.g. V2O5,were not produced by oxygen exposures up to temperatures of723K.In all cases the postoxidized surface contains only fully oxidized titanium,i.e.Ti4ϩ(Fig.5).Similar results are seen in the Fe/TiO2(110)system, as studied by Diebold et al.[21].Iron was evaporated onto the stoichiometric TiO2(110)surface for coverages of0.3–2.2ml and SXPS and resonant photoemission spectra were recorded after every exposure.For initial coverages(belowϳ0.7ml), the formation of Fe2ϩspecies at the surface,along with reduction of the Ti4ϩare seen in the Ti3s and Fe3p photoelectron spectra.At0.7ml it is clear that there is some metallic iron present on the surface, evidenced by a shoulder appearing at lower binding energy in the Fe3p spectrum,the contribution to this peak increasing with increasing iron deposition. Following a160L does of oxygen the metallic Fe and also the Fe2ϩspecies are oxidised to Fe3ϩ.Reso-nant photoemission studies concluded that FeN.J.Price et al./Journal of Electron Spectroscopy and Related Phenomena98–99(1999)257–266 262Table2Intergrated V2p3/2peak intensityies for V4ϩand V0species,takenfrom Fig.3Deposition time(s)IntergratedV2p3/2intensity ofV4ϩspecies Intergrated V2p3/2 intensity of V0species200.05—700.080.02 1100.120.03 1500.150.05 3100.260.12 6300.40.25adsorption induces defect states of Ti3d character and that these states are localised at the Ti atoms and that the bonding is predominantly via the surface bridging oxygen species.4.V LIII-edge and Ti LIII-edge dataVanadium L-edge and titanium L-edge spectra also contain information relevant to the form of the oxide formed at the interface.Fine structure in the L to D transitions differ and depend on the local electronic and geometrical structure.Thus,comparison of the L-edgefine structure of the surface oxide to those of model compounds is useful in identifying the state of the surface oxide.4.1.Titanium LIII-edgesFig.6shows the titanium LIII-edge recorded for the stoichiometric,reduced and metallic vanadium-dosed surfaces of TiO2(110).In all three of the plots,the spin-orbit splitting of the Ti2p orbitals is apparent. The stoichiometric surface(Fig.6,curve a)shows theN.J.Price et al./Journal of Electron Spectroscopy and Related Phenomena98–99(1999)257–266263Fig.4.V2p XPS spectra for various vanadium exposures followed by exposure to5×10Ϫ5Torr oxygen pressure for the times listed.(b)60s V,300s O2,(c)120s V,300s O2,(d)240s V,300s O2,(e)240s V,500s O2,(f)480s V,no oxygen,(g)480s V,600s O2,(i)480s V,1200s O2.(a)and(h)are the deconvolvedfits to the data of curves(b)and(i),respectively.most structure,with the 2p 1/2and 2p 3/2orbitals further split into the t 2g and e g orbitals.With the deposition of metallic vanadium the splitting becomes less distinct,and a distinct low energy transition centered around 459.5eV appears.On the argon bombarded surface,the t 2g Ϫe g orbitals.With the deposition of metallic vanadium the splitting is no longer resolvable,and only two broad features,presumably due to spin-orbit split peaks broadened by crystal field splitting,are observed.Whereas the Ti 4ϩcations in the rutile structure exist in an octahedral environment,it is possible that reduced surfaces possess a range of local symmetries,such that the d-orbitals will produce overlapping states.Further,as Ti 3ϩis 3d 1,additional splittings in the edge will occur due to correlation of the unpaired d electron and the unpaired core electron.All these factors will serve to split all the states that contribute to the edge hence making a more diffuse,broad edge structure,as is observed in Fig.6(b)and (c).Furthermore,the feature present at 459.5eV for the vanadium-reduced surface becomes obscured onthe argon bombarded surface due to broadening of the 2p 3/2peak,but still appears as a shoulder on the low energy side.The broadening of the t 2g and e g sets of orbitals on the argon bombarded surface suggest that there is appreciable local disorder on this surface.The extent of disorder is greater than that produced by deposition of vanadium.Based on the intensity of the Ti2p XPS signal,it would appear that the sputtered surface is more heavily reduced than the ‘vanadium-reduced’surface.It is quite clear that there are multiple reduced Ti cations following Ar ϩbombardment.This Ti L-edge data may be compared with the results of Diebold et al.For Mn deposition on TiO 2(110)[22].Similarly,Mn interacts strongly with TiO 2(110)resulting in a reduction of the titanium and corresponding oxidation of Mn.The Ti 2p XPS show similar trends to those observed here for V/TiO 2.Upon deposition of a Mn layer about 17A˚thick,the X-ray absorption features abruptly broaden indicativeN.J.Price et al./Journal of Electron Spectroscopy and Related Phenomena 98–99(1999)257–266264Fig.5.Ti 2p XPS spectra for the stoichiometric TiO 2surface.Each curve corresponds to identical dosing conditions as those in Fig.4.Fig.6.Ti LIII-edge spectra for the (a)stoichiometric,(b)metallic vanadium-dosed,and (c)argon bombarded surfaces of TiO 2(110).of a disordering of the system[compare Fig.6(b)]. Annealing this surface causes a partial restoration of the original order.4.2.Vanadium LIII-edgesVanadium LIII edge data was recorded for V2O5 powders for comparison to the edge data recorded for the VϩO2/TiO2(110)and V.TiO2(110).The edge data were recorded in constantfinal state (CFS)mode;the electron energy analyser was set to detect electrons corresponding to the V LMM Auger transition(Fig.7).The clear pre-edge features in the V2O5V-edge spectrum at513.3and515eV are clearly not present at any vanadia coverage in the V LIII-edge spectrum at513.3and515eV are clearly not present at any vanadia coverage in the V LIII-edge data recorded for the vanadium deposited on TiO2(110)in the presence of oxygen at any of the coverages(Fig.7).5.SummaryModel vanadium–titania and vanadia–titania surface overlayers were studied as a means of probing charge transfer processes occurring at metal–oxide and oxide–oxide interfaces.The results presented in this paper are in basic agreement with previous studies of the vanadium–titania,vanadia–titania systems. The use of a high intensity X-ray source allowed for the oxidation state of vanadia species formed to be determined following vanadium deposition on the stoichiometric TiO2(110)surface,even at submono-layer coverages.It was found that upon vanadium deposition,the titania surface was reduced with both Ti4ϩand Ti3ϩcations present in the surface region. Vanadium deposition appears to follow either FM or SK growth.Titanium LIII-edge spectra for the stoi-chiometric,reduced(by argon-ion bombardment)and for the surface exposed to vanadium metal provided additional evidence for reduction of the titania surface.For higher vanadium coverages the formation of a metallic layer on top of the vanadia layer was observed.For surfaces prepared by vanadium deposi-tion followed by oxidation only one vanadium species was seen to form on the surface,the binding energy of which corresponded to V2O3,thus indicating that the vandium had been oxidized due to the oxygen ambient.Metallic vanadium was seen in this series of experiments only if the surface was not exposed to sufficient oxygen following metal evaporation. Vanadium LIII-edge spectra also indicate that the oxide of vanadium formed is not V2O5under the conditions employed.The growth of vanadium and vanadia on TiO2 should be placed in perspective with the growth of other metals on the same surface.In a recent review the growth of metalfilms on TiO2is discussed.[23] More reactive metals,i.e.those with high heats of formation of their bulk oxides,formfilms which ‘wet’the surface completely,whereas less reactive metals exhibit3D island growth.The more reactive metals(e.g.Al,Cr,Hf,V)reduce the titania surface, whereas the less reactive species(e.g.Au,Cu,Pd,Pt,N.J.Price et al./Journal of Electron Spectroscopy and Related Phenomena98–99(1999)257–266265Fig.7.Vanadium edge spectra for(a)–(e)the stoichiometeric TiO2 surface exposed to metallic vanadium followed by oxygen,(a)60s V,300s O2,(b)120s V,300s O2,(c)240s V,300s O2,(d)240s V, 600s O2,(e)480s V,600s O2,and(f)V2O5powder.Rh)do not.A number of processes may occur upon heating of the metal layers.Alkalai metals desorption completes with oxidation of the metal.For vanadium, chromium and mangenese oxidation and/or diffusion into the interior of the titania occurs.In some instances(e.g.Fe,Rh,Ni,Pd and Pt)encapsulation may occur.The behavior of vanadium observed in our studies is entirely consistent with this general pattern. AcknowledgementsThis work was supported by the NSF-MRSEC program through the Center of Materials Research at Stanford University.References[1]T.Tanaka,H.Yamashita,R.Tsuchitani,T.Funabiki,S.Yoshida,J.Chem.Soc.Faraday Trans.84(1988)2987. [2]M.Sambi,E.Pin,G.Sangiovanni,L.Zaratin,G.Granozzi,F.Parmigiani,Surf.Sci.349(1996)L169.[3]R.Koslowski,R.F.Pettifer,J.M.Thomas,J.Phys.Chem.87(1983)5176.[4]H.Bosch,F.Janssen,Catal.Today2(1988)369.[5]A.Baiker,P.Dollenmeier,M.Glinski,A.Reller,Appl.Catal.35(1987)351.[6]G.C.Bond,S.F.Tahir,Appl.Catal.71(1991)1.[7]G.Centi,E.Giamello,D.Pinelli,F.Trifiro,J.Catal.130(1991)220.[8]G.Bond,C.Flamerz,R.Shukri,Faraday Disc.Chem.Soc.87(1989)65.[9]H.Hausinger,H.Schemlz,H.Knozinger,Appl.Catal.39(1988)369.[10]Z.Zhang,V.E.Henrich,Surf.Sci.277(1992)263.[11]J.F.Moulder,W.F.Stickle,P.E.Sobol and K.D.Momber,Handbook of X-ray Photoelectron Spectroscopy,1992. [12]G.Chiarello,D.Robba,G.De Michele,F.Parmigiani,Appl.Surf.Sci.64(1993)91.[13]M.A.Henderson,Surf.Sci.343(1995)L1156.[14]U.Diebold,J.-M.Pan,T.E.Madey,Surf.Sci.331-333(1995)845.[15]G.Chiarello,R.Barberi,A.Amoddeo,L.S.Caputi,E.Cola-vita,Appl.Surf.Sci.99(1996)15.[16]G.A.Sawatzky,D.Post,Phys.Rev.B.20(1979)1546.[17]J.Kasperkiewicz,J.A.Kovacich,D.Lichtman,J.ElectronSpectrosc.Relat.Phenom.32(1983)123.[18]S.L.T.Andersson,J.Chem.Soc.Faraday Trans.75(1979)1356.[19]D.Robba,D.M.Ori,P.Sangalli,G.Chiarello,L.E.Depero,F.Parmigiani,Surf.Sci.380(1997)311.[20]V.E.Henrich,R.L.Kurtz,Phys.Rev.B.23(1981)6280.[21]U.Diebold,H.-S.Tao,N.D.Shinn,T.E.Madey,Phys.Rev.B50(1994)14474.[22]U.Diebold,N.D.Shinn,Surf.Sci.343(1995)53.[23]V.Persuad,T.E.Madey,The growth and properties of ultra-thin epitaxial layers,in:D.A.King,D.P.Woodruff(Eds.),The Chemical Physics of Solid Surfaces and Heterogeneous Cata-lysis,Vol.8,Elsevier Science,Amsterdam,1997.N.J.Price et al./Journal of Electron Spectroscopy and Related Phenomena98–99(1999)257–266 266。
XANES理论

量子力学其中一个最突出的成就就是严格求解了氢原子的薛定谔方程,从 而对氢原子光谱和性质给出了相当满意的说明。
通过对氢原子薛定谔方程的求解,我们可以给出原子的轨道表达式,这是 我们了解和研究复杂原子及分子结构的基础。
轨道
表达式
角度部分表达式
s
px py pz dx2-y2 dz2 dxy dxz dyz
北京同步辐射装置XANES谱讲习班,2010年6月7-8日
Atomic Orbitals: A Review
d z2
d x2−y2
d xy
d yz
d xz
北京同步辐射装置XANES谱讲习班,2010年6月7-8日
例如,如果激发的内层电子是1s轨道上的电子,那么它的 初态波函数φi为偶函数,由于中间的偶极跃迁操作算符r 具有奇函数性质,因此只有当这个激发的电子的末态波函 数φf具有奇函数性质时,这个积分才不等于零。
对于单重态到三重态的跃迁,假设初态波函数 ϕkϕkαβ 为其中α和 β表示自
旋相反的自旋函数;终态波函数为 在跃迁矩阵元中将包含
ϕkϕ jα 2
或者
ϕkϕ jβ 2
。
∫ αβ dσ
其中dσ 为自旋坐标中的体积元。根据自旋波函数的正交性,这个积分为零,
因此单重态到三重态的跃迁是禁阻的。 而在单重态到单重态或者三重态到三重态的跃迁中,因为
但是,芯态激发的电子并不能跃迁到 所有的未占据轨道,也就是说,芯态 电子吸收一定能量的X射线光子后跃 迁到未占据轨道具有一定的选择性。
北京同步辐射装置XANES谱讲习班,2010年6月7-8日
这种选择性体现在吸收截面计算中的跃迁矩阵元中,
< φi | rK ⋅ εG | φ f >
Extragaactic X-ray Binary Stars Beacons for Stellar- and :河外星系的X射线双星的恒星和信标
Metallicity of Hot Gas in Ellipticals
MOS+PN for NGC4472, NGC4649, and NGC1399
O/Fe ~ 0.3 - 0.4 Mg/Fe ~ 1.2 - 1.5 Ni/Fe ~ 3 - 7
Stellar Source for Soft Component?
M31 (diffuse) LX (0.5-2 keV): 1.7 x 1038 ergs s-1 LX (2-7 keV): 5.3 x 1037 ergs s-1
LX(0.5-2 keV)/ LX(2-7 keV) = 3.2
Total 0.5 - 2.0 keV flux Source: 85% Background: 15%
Source 0.5 - 2.0 keV flux Gas: 85% LMXBs:15%
Source of Low Metallicity Gas
How are both LX/Lopt and low metallicity achieved? One solution: ongoing accretion of pristine gas surrounding galaxies dilutes to subsolar metallicities
Cause of LX vs. Lopt Dispersion
Environmental? ram pressure stripping: LX - cluster environment ICM pressure confinement: LX “stifling” Internal? - variation in Type Ia supernovae-driven winds - variation in depth of dark matter gravitational potential Low LX/Lopt in low density environments. High and low LX/Lopt in high density environments. (e.g., Brown & Bregman 2000)
6-EDSWDS
能量分辨率 用能谱峰的半高宽来表示:
E —由于产生电荷的统计性得到的探测器的半高宽 EN —考虑与统计变化、探测器和前置放大器中的噪声 有关的振幅展宽造成的增量 Attken和woo(1971)指出,对Mn K ,(5.9keV)的最 大理论分辨率约为100eV。现代使用的探测器的分辨 率为136eV或更好些,已接近理论值了。我校的EDS 的能量分辨率为154ev。
4
工作原理
GND UOR UIR
SDD
UBACK
1
2
3
3
Charge Collection:
Signal
2
Event 1
signal 1
1
Event 2
signal 2
Event 3
signal 3 tDrift2 tDrift3 Time 5
Si(Li)探测器前端有一个的窗口,让x射 线进入,还要保持真空。 一般用铍薄膜(厚8~10m)来制作窗 口,但铍薄膜对低能x射线吸收严重,不 能分析比Na(Z=11)轻的元素。 现代EDS多用有机膜(厚0.3~0.5m )制作窗口,或无窗口,可分析Be(Z=4) 以上的元素。
6
牛津仪器的电制冷能谱
DryCool
X-Act
X-Max SEM TEM
7
8
放大系统:
漂移硅半导体检测器产生电压脉冲很小,要 通过高信噪比的场效应管前置放大器放大,然后 再经过主放大器放大和整形。显然,放大器增益 的选择必须保证输出电压信号幅值正比于单个入 射x光子的能量。
9
分析展谱系统: 放大器输出的脉冲信号输入多道脉冲高度分析 器。多道脉冲高度分析器中的模数转换器首先把 脉肿模拟信号转换成数字信号,建立起电压脉冲 幅值(即对应x光子能量)与道址的对应关系。根据 不同道址上(对应不同能量的x光子)记录的x光子的 数目,就可确定各种元素的x射线强度。 它是作为测定样品中各元素相对含量的信息。 然后,在x—y记录仪或阴极射线管上把脉冲数— 脉冲高度(对应于x光子的能量)曲线显示出来, 这即是x光子的能谱曲线。
Fermi伽马射线暴的光谱能量关系
Fermi伽马射线暴的光谱能量关系骆娟娟; 米立功【期刊名称】《《贵州大学学报(自然科学版)》》【年(卷),期】2019(036)005【总页数】5页(P38-42)【关键词】伽马射线暴; Fermi卫星; 能量关系; 光度关系【作者】骆娟娟; 米立功【作者单位】黔南民族师范学院物理与电子科学学院贵州都匀558000【正文语种】中文【中图分类】P145.31967年科学家们偶然发现了伽马射线暴,伽马射线暴简称伽马暴(GRBs),是宇宙中高能伽马光子急剧增加又急剧衰减的现象[1]。
它是宇宙中最明亮最遥远的光源[2-4],可以作为早期宇宙学的探针。
过去的几十年中,科学家们发现了很多光谱能量关系[5]。
例如:lag-luminosity关系,variability关系Amati关系[6-9],Ghirlanda关系[7]和Yonetoku关系[5-10]等。
本文是基于Fermi卫星经过一定选择标准的数据样本,主要对峰值能量-均质能量和峰值能量-均质光度做再修订,此外提出了长短暴[11]可以通过这两种关系分类[6]的结论。
峰值能量Epeak指一个完整的暴在E2N(E)&νFν能谱中出现的能量最高值。
均质能量Eiso指一个完整的暴所具有的各向同性能量。
均质光度Liso指一个完整的暴所具有的各向同性光度。
1 样本选择和计算本文收集了Fermi卫星2010年12月至2018年12月红移已知的GRBs的数据样本。
共有84个已知红移的Fermi暴,其中有81个长暴,3个短暴。
1.1 均质能量的计算实际的计算过程中,采用了平滑幂率的光谱拟合:其中,Φ表示光子能谱分布函数,E0表截断能。
热辐射流量Sbolo和观测流量S满足[12]:1.2 均质光度的计算本文使用Band函数拟合。
单位时间,单位面积内观测的光子个数Pph满足[12]:分三种情况讨论,Pph满足关系式[12]:(1)Emax≤(α-β)E0,(2)Emin≤(α-β)E0≤Emax,Pph=;(3)Emin≥(α-β)E0,Pph=不分区间推演出不同的归一化常数A的值:(1)Emax≤(α-β)E0,(2)Emin≤(α-β)E0≤Emax,(3)Emin≥(α-β)E0,峰值能量通量erg/cm2/s,可以通过下面的公式计算:同样地,分成三个不同区间计算Fγ[13-15]。
ASTM材料与实验标准.E94
Designation:E94–04Standard Guide forRadiographic Examination1This standard is issued under thefixed designation E94;the number immediately following the designation indicates the year of original adoption or,in the case of revision,the year of last revision.A number in parentheses indicates the year of last reapproval.A superscript epsilon(e)indicates an editorial change since the last revision or reapproval.1.Scope1.1This guide2covers satisfactory X-ray and gamma-ray radiographic examination as applied to industrial radiographic film recording.It includes statements about preferred practice without discussing the technical background which justifies the preference.A bibliography of several textbooks and standard documents of other societies is included for additional infor-mation on the subject.1.2This guide covers types of materials to be examined; radiographic examination techniques and production methods; radiographicfilm selection,processing,viewing,and storage; maintenance of inspection records;and a list of available reference radiograph documents.N OTE1—Further information is contained in Guide E999,Practice E1025,Test Methods E1030and E1032.1.3Interpretation and Acceptance Standards—Interpretation and acceptance standards are not covered by this guide,beyond listing the available reference radiograph docu-ments for castings and welds.Designation of accept-reject standards is recognized to be within the cognizance of product specifications and generally a matter of contractual agreement between producer and purchaser.1.4Safety Practices—Problems of personnel protection against X rays and gamma rays are not covered by this document.For information on this important aspect of radiog-raphy,reference should be made to the current document of the National Committee on Radiation Protection and Measure-ment,Federal Register,U.S.Energy Research and Develop-ment Administration,National Bureau of Standards,and to state and local regulations,if such exist.For specific radiation safety information refer to NIST Handbook ANSI43.3,21 CFR1020.40,and29CFR1910.1096or state regulations for agreement states.1.5This standard does not purport to address all of the safety problems,if any,associated with its use.It is the responsibility of the user of this standard to establish appro-priate safety and health practices and determine the applica-bility of regulatory limitations prior to use.(See1.4.)1.6If an NDT agency is used,the agency shall be qualified in accordance with Practice E543.2.Referenced Documents2.1ASTM Standards:3E543Practice for Evaluating Agencies that Perform Non-destructive TestingE746Test Method for Determining Relative Image Quality Response of Industrial Radiographic Film SystemsE747Practice for Design,Manufacture,and Material Grouping Classification of Wire Image Quality Indicators (IQI)Used for RadiologyE801Practice for Controlling Quality of Radiological Ex-amination of Electronic DevicesE999Guide for Controlling the Quality of Industrial Ra-diographic Film ProcessingE1025Practice for Design,Manufacture,and Material Grouping Classification of Hole-Type Image Quality Indi-cators(IQI)Used for RadiologyE1030Test Method for Radiographic Examination of Me-tallic CastingsE1032Test Method for Radiographic Examination of WeldmentsE1079Practice for Calibration of Transmission Densitom-etersE1254Guide for Storage of Radiographs and Unexposed Industrial Radiographic FilmsE1316Terminology for Nondestructive ExaminationsE1390Guide for Illuminators Used for Viewing Industrial RadiographsE1735Test Method for Determining Relative Image Qual-ity of Industrial Radiographic Film Exposed to X-Radiation from4to25MVE1742Practice for Radiographic ExaminationE1815Test Method for Classification of Film Systems for Industrial Radiography2.2ANSI Standards:1This guide is under the jurisdiction of ASTM Committee E07on Nondestruc-tive Testing and is the direct responsibility of Subcommittee E07.01on Radiology (X and Gamma)Method.Current edition approved January1,2004.Published February2004.Originally approved st previous edition approved in2000as E94-00.2For ASME Boiler and Pressure Vessel Code applications see related Guide SE-94in Section V of that Code.3For referenced ASTM standards,visit the ASTM website,,or contact ASTM Customer Service at service@.For Annual Book of ASTM Standards volume information,refer to the standard’s Document Summary page on the ASTM website.Copyright©ASTM International,100Barr Harbor Drive,PO Box C700,West Conshohocken,PA19428-2959,United States.PH1.41Specifications for Photographic Film for Archival Records,Silver-Gelatin Type,on Polyester Base 4PH2.22Methods for Determining Safety Times of Photo-graphic Darkroom Illumination 4PH4.8Methylene Blue Method for Measuring Thiosulfate and Silver Densitometric Method for Measuring Residual Chemicals in Films,Plates,and Papers 4T9.1Imaging Media (Film)—Silver-Gelatin Type Specifi-cations for Stability 4T9.2Imaging Media—Photographic Process Film Plate and Paper Filing Enclosures and Storage Containers 42.3Federal Standards:Title 21,Code of Federal Regulations (CFR)1020.40,Safety Requirements of Cabinet X-Ray Systems 5Title 29,Code of Federal Regulations (CFR)1910.96,Ionizing Radiation (X-Rays,RF,etc.)52.4Other Document:NBS Handbook ANSI N43.3General Radiation Safety Installations Using NonMedical X-Ray and Sealed Gamma Sources up to 10MeV 63.Terminology3.1Definitions —For definitions of terms used in this guide,refer to Terminology E 1316.4.Significance and Use4.1Within the present state of the radiographic art,this guide is generally applicable to available materials,processes,and techniques where industrial radiographic films are used as the recording media.4.2Limitations —This guide does not take into consider-ation special benefits and limitations resulting from the use of nonfilm recording media or readouts such as paper,tapes,xeroradiography,fluoroscopy,and electronic image intensifi-cation devices.Although reference is made to documents that may be used in the identification and grading,where appli-cable,of representative discontinuities in common metal cast-ings and welds,no attempt has been made to set standards of acceptance for any material or production process.Radiogra-phy will be consistent in sensitivity and resolution only if the effect of all details of techniques,such as geometry,film,filtration,viewing,etc.,is obtained and maintained.5.Quality of Radiographs5.1To obtain quality radiographs,it is necessary to consider as a minimum the following list of items.Detailed information on each item is further described in this guide.5.1.1Radiation source (X-ray or gamma),5.1.2V oltage selection (X-ray),5.1.3Source size (X-ray or gamma),5.1.4Ways and means to eliminate scattered radiation,5.1.5Film system class,5.1.6Source to film distance,5.1.7Image quality indicators (IQI’s),5.1.8Screens and filters,5.1.9Geometry of part or component configuration,5.1.10Identification and location markers,and 5.1.11Radiographic quality level.6.Radiographic Quality Level6.1Information on the design and manufacture of image quality indicators (IQI’s)can be found in Practices E 747,E 801,E 1025,and E 1742.6.2The quality level usually required for radiography is 2%(2-2T when using hole type IQI)unless a higher or lower quality is agreed upon between the purchaser and the supplier.At the 2%subject contrast level,three quality levels of inspection,2-1T,2-2T,and 2-4T,are available through the design and application of the IQI (Practice E 1025,Table 1).Other levels of inspection are available in Practice E 1025Table 1.The level of inspection specified should be based on the service requirements of the product.Great care should be taken in specifying quality levels 2-1T,1-1T,and 1-2T by first determining that these quality levels can be maintained in production radiography.N OTE 2—The first number of the quality level designation refers to IQI thickness expressed as a percentage of specimen thickness;the second number refers to the diameter of the IQI hole that must be visible on the radiograph,expressed as a multiple of penetrameter thickness,T .6.3If IQI’s of material radiographically similar to that being examined are not available,IQI’s of the required dimensions but of a lower-absorption material may be used.6.4The quality level required using wire IQI’s shall be equivalent to the 2-2T level of Practice E 1025unless a higher or lower quality level is agreed upon between purchaser and supplier.Table 4of Practice E 747gives a list of various hole-type IQI’s and the diameter of the wires of corresponding EPS with the applicable 1T,2T,and 4T holes in the plaque IQI.Appendix X1of Practice E 747gives the equation for calcu-lating other equivalencies,if needed.7.Energy Selection7.1X-ray energy affects image quality.In general,the lower the energy of the source utilized the higher the achievable radiographic contrast,however,other variables such as geom-etry and scatter conditions may override the potential advan-tage of higher contrast.For a particular energy,a range of thicknesses which are a multiple of the half value layer,may be radiographed to an acceptable quality level utilizing a particu-lar X-ray machine or gamma ray source.In all cases the specified IQI (penetrameter)quality level must be shown on the radiograph.In general,satisfactory results can normally be obtained for X-ray energies between 100kV to 500kV in a range between 2.5to 10half value layers (HVL)of material thickness (see Table 1).This range may be extended by as much as a factor of 2in some situations for X-ray energies in the 1to 25MV range primarily because of reduced scatter.4Available from American National Standards Institute (ANSI),25W.43rd St.,4th Floor,New York,NY 10036.5Available from ernment Printing Office Superintendent of Documents,732N.Capitol St.,NW,Mail Stop:SDE,Washington,DC 20401.6Available from National Technical Information Service (NTIS),U.S.Depart-ment of Commerce,5285Port Royal Rd.,Springfield,V A22161.8.Radiographic Equivalence Factors8.1The radiographic equivalence factor of a material is that factor by which the thickness of the material must be multi-plied to give the thickness of a “standard”material (often steel)which has the same absorption.Radiographic equivalence factors of several of the more common metals are given in Table 2,with steel arbitrarily assigned a factor of 1.0.The factors may be used:8.1.1To determine the practical thickness limits for radia-tion sources for materials other than steel,and8.1.2To determine exposure factors for one metal from exposure techniques for other metals.9.Film9.1Various industrial radiographic film are available to meet the needs of production radiographic work.However,definite rules on the selection of film are difficult to formulate because the choice depends on individual user requirements.Some user requirements are as follows:radiographic quality levels,exposure times,and various cost factors.Several methods are available for assessing image quality levels (see Test Method E 746,and Practices E 747and E 801).Informa-tion about specific products can be obtained from the manu-facturers.9.2Various industrial radiographic films are manufactured to meet quality level and production needs.Test Method E 1815provides a method for film manufacturer classification of film systems.A film system consist of the film andassociated film processing ers may obtain a classi-fication table from the film manufacturer for the film system used in production radiography.A choice of film class can be made as provided in Test Method E 1815.Additional specific details regarding classification of film systems is provided in Test Method E 1815.ANSI Standards PH1.41,PH4.8,T9.1,and T9.2provide specific details and requirements for film manufacturing.10.Filters10.1Definition —Filters are uniform layers of material placed between the radiation source and the film.10.2Purpose —The purpose of filters is to absorb the softer components of the primary radiation,thus resulting in one or several of the following practical advantages:10.2.1Decreasing scattered radiation,thus increasing con-trast.10.2.2Decreasing undercutting,thus increasing contrast.10.2.3Decreasing contrast of parts of varying thickness.10.3Location —Usually the filter will be placed in one of the following two locations:10.3.1As close as possible to the radiation source,which minimizes the size of the filter and also the contribution of the filter itself to scattered radiation to the film.10.3.2Between the specimen and the film in order to absorb preferentially the scattered radiation from the specimen.It should be noted that lead foil and other metallic screens (see 13.1)fulfill this function.10.4Thickness and Filter Material —The thickness and material of the filter will vary depending upon the following:10.4.1The material radiographed.10.4.2Thickness of the material radiographed.10.4.3Variation of thickness of the material radiographed.10.4.4Energy spectrum of the radiation used.10.4.5The improvement desired (increasing or decreasing contrast).Filter thickness and material can be calculated or determined empirically.11.Masking11.1Masking or blocking (surrounding specimens or cov-ering thin sections with an absorptive material)is helpful in reducing scattered radiation.Such a material can also be usedTABLE 1Typical Steel HVL Thickness in Inches [mm]forCommon EnergiesEnergyThickness,Inches [mm]120kV 0.10[2.5]150kV 0.14[3.6]200kV 0.20[5.1]250kV0.25[6.4]400kV (Ir 192)0.35[8.9]1MV0.57[14.5]2MV (Co 60)0.80[20.3]4MV 1.00[25.4]6MV 1.15[29.2]10MV1.25[31.8]16MV and higher1.30[33.0]TABLE 2Approximate Radiographic Equivalence Factors for Several Metals (Relative to Steel)MetalEnergy Level100kV 150kV 220kV 250kV400kV1MV2MV4to 25MV192Ir60CoMagnesium 0.050.050.08Aluminum0.080.120.180.350.35Aluminum alloy 0.100.140.180.350.35Titanium0.540.540.710.90.90.90.90.9Iron/all steels 1.0 1.0 1.0 1.0 1.0 1.0 1.0 1.0 1.0 1.0Copper 1.51.6 1.4 1.41.4 1.1 1.1 1.2 1.1 1.1Zinc 1.4 1.3 1.3 1.2 1.1 1.0Brass 1.4 1.3 1.3 1.2 1.1 1.0 1.1 1.0Inconel X 1.4 1.3 1.3 1.3 1.3 1.3 1.3 1.3Monel 1.7 1.2Zirconium2.4 2.3 2.0 1.7 1.5 1.0 1.0 1.0 1.2 1.0Lead 14.014.012.0 5.0 2.52.7 4.0 2.3Hafnium 14.012.09.03.0Uranium20.016.012.04.03.912.63.4to equalize the absorption of different sections,but the loss of detail may be high in the thinner sections.12.Back-Scatter Protection12.1Effects of back-scattered radiation can be reduced by confining the radiation beam to the smallest practical cross section and by placing lead behind thefilm.In some cases either or both the back lead screen and the lead contained in the back of the cassette orfilm holder will furnish adequate protection against back-scattered radiation.In other instances, this must be supplemented by additional lead shielding behind the cassette orfilm holder.12.2If there is any question about the adequacy of protec-tion from back-scattered radiation,a characteristic symbol (frequently a1⁄8-in.[3.2-mm]thick letter B)should be attached to the back of the cassette orfilm holder,and a radiograph made in the normal manner.If the image of this symbol appears on the radiograph as a lighter density than background, it is an indication that protection against back-scattered radia-tion is insufficient and that additional precautions must be taken.13.Screens13.1Metallic Foil Screens:13.1.1Lead foil screens are commonly used in direct contact with thefilms,and,depending upon their thickness, and composition of the specimen material,will exhibit an intensifying action at as low as90kV.In addition,any screen used in front of thefilm acts as afilter(Section10)to preferentially absorb scattered radiation arising from the speci-men,thus improving radiographic quality.The selection of lead screen thickness,or for that matter,any metallic screen thickness,is subject to the same considerations as outlined in 10.4.Lead screens lessen the scatter reaching thefilm regard-less of whether the screens permit a decrease or necessitate an increase in the radiographic exposure.To avoid image unsharp-ness due to screens,there should be intimate contact between the lead screen and thefilm during exposure.13.1.2Lead foil screens of appropriate thickness should be used whenever they improve radiographic quality or penetram-eter sensitivity or both.The thickness of the front lead screens should be selected with care to avoid excessivefiltration in the radiography of thin or light alloy materials,particularly at the lower kilovoltages.In general,there is no exposure advantage to the use of0.005in.in front and back lead screens below125 kV in the radiography of1⁄4-in.[6.35-mm]or lesser thickness steel.As the kilovoltage is increased to penetrate thicker sections of steel,however,there is a significant exposure advantage.In addition to intensifying action,the back lead screens are used as protection against back-scattered radiation (see Section12)and their thickness is only important for this function.As exposure energy is increased to penetrate greater thicknesses of a given subject material,it is customary to increase lead screen thickness.For radiography using radioac-tive sources,the minimum thickness of the front lead screen should be0.005in.[0.13mm]for iridium-192,and0.010in.[0.25mm]for cobalt-60.13.2Other Metallic Screen Materials:13.2.1Lead oxide screens perform in a similar manner to lead foil screens except that their equivalence in lead foil thickness approximates0.0005in.[0.013mm].13.2.2Copper screens have somewhat less absorption and intensification than lead screens,but may provide somewhat better radiographic sensitivity with higher energy above1MV.13.2.3Gold,tantalum,or other heavy metal screens may be used in cases where lead cannot be used.13.3Fluorescent Screens—Fluorescent screens may be used as required providing the required image quality is achieved.Proper selection of thefluorescent screen is required to minimize image unsharpness.Technical information about specificfluorescent screen products can be obtained from the manufacturers.Goodfilm-screen contact and screen cleanli-ness are required for successful use offluorescent screens. Additional information on the use offluorescent screens is provided in Appendix X1.13.4Screen Care—All screens should be handled carefully to avoid dents and scratches,dirt,or grease on active surfaces. Grease and lint may be removed from lead screens with a solvent.Fluorescent screens should be cleaned in accordance with the recommendations of the manufacturer.Screens show-ing evidence of physical damage should be discarded.14.Radiographic Image Quality14.1Radiographic image quality is a qualitative term used to describe the capability of a radiograph to showflaws in the area under examination.There are three fundamental compo-nents of radiographic image quality as shown in Fig.1.Each component is an important attribute when considering a specific radiographic technique or application and will be briefly discussed below.14.2Radiographic contrast between two areas of a radio-graph is the difference between thefilm densities of those areas.The degree of radiographic contrast is dependent upon both subject contrast andfilm contrast as illustrated in Fig.1.14.2.1Subject contrast is the ratio of X-ray or gamma-ray intensities transmitted by two selected portions of a specimen. Subject contrast is dependent upon the nature of the specimen (material type and thickness),the energy(spectral composition, hardness or wavelengths)of the radiation used and the intensity and distribution of scattered radiation.It is independent of time,milliamperage or source strength(curies),source distance and the characteristics of thefilm system.14.2.2Film contrast refers to the slope(steepness)of the film system characteristic curve.Film contrast is dependent upon the type offilm,the processing it receives and the amount offilm density.It also depends upon whether thefilm was exposed with lead screens(or without)or withfluorescent screens.Film contrast is independent,for most practical purposes,of the wavelength and distribution of the radiation reaching thefilm and,hence is independent of subject contrast. For further information,consult Test Method E1815.14.3Film system granularity is the objective measurement of the local density variations that produce the sensation of graininess on the radiographicfilm(for example,measured with a densitometer with a small aperture of#0.0039in.[0.1 mm]).Graininess is the subjective perception of a mottled random pattern apparent to a viewer who sees smalllocaldensity variations in an area of overall uniform density (that is,the visual impression of irregularity of silver deposit in a processed radiograph).The degree of granularity will not affect the overall spatial radiographic resolution (expressed in line pairs per mm,etc.)of the resultant image and is usually independent of exposure geometry arrangements.Granularity is affected by the applied screens,screen-film contact and film processing conditions.For further information on detailed perceptibility,consult Test Method E 1815.14.4Radiographic definition refers to the sharpness of the image (both the image outline as well as image detail).Radiographic definition is dependent upon the inherent un-sharpness of the film system and the geometry of the radio-graphic exposure arrangement (geometric unsharpness)as illustrated in Fig.1.14.4.1Inherent unsharpness (U i )is the degree of visible detail resulting from geometrical aspects within the film-screen system,that is,screen-film contact,screen thickness,total thickness of the film emulsions,whether single or double-coated emulsions,quality of radiation used (wavelengths,etc.)and the type of screen.Inherent unsharpness is independent of exposure geometry arrangements.14.4.2Geometric unsharpness (U g )determines the degree of visible detail resultant from an “in-focus”exposure arrange-ment consisting of the source-to-film-distance,object-to-film-distance and focal spot size.Fig.2(a)illustrates these condi-tions.Geometric unsharpness is given by the equation:U g 5Ft /d o(1)where:U g =geometric unsharpness,F =maximum projected dimension of radiation source,t =distance from source side of specimen to film,and d o =source-object distance.N OTE 3—d o and t must be in the same units of measure;the units of U g will be in the same units as F .N OTE 4—A nomogram for the determination of U g is given in Fig.3(inch-pound units).Fig.4represents a nomogram in metric units.Example:Given:Source-object distance (d o )=40in.,Source size (F)=500mils,andSource side of specimen to film distance (t)=1.5in.Draw a straight line (dashed in Fig.3)between 500mils on the F scale and 1.5in.on the t scale.Note the point on intersection (P)of this line with the pivot line.Draw a straight line (solid in Fig.3)from 40in.on the d o scale through point P and extend to the U g scale.Intersection of this line with the U g scale gives geometrical unsharpness in mils,which in the example is 19mils.Inasmuch as the source size,F ,is usually fixed for a given radiation source,the value of U g is essentially controlled by the simple d o /t ratio.Geometric unsharpness (U g )can have a significant effect on the quality of the radiograph;therefore source-to-film-distance (SFD)selection is important.The geometric unsharpness (U g )equation,Eq 1,is for information and guidance and provides a means for determining geometric unsharpness values.The amount or degree of unsharpness should be minimized when establishing the radiographic technique.Radiographic Image QualityRadiographic ContrastFilm System Granularity Radiographic DefinitionSubject Contrast Film Contrast •Grain size and distribution within the film emulsion •Processing conditions(type and activity of developer,temperature of developer,etc.)•Type ofscreens (that is,fluorescent,lead or none)•Radiation quality (that is,energy level,filtration,etc.•Exposure quanta (that is,intensity,dose,etc.)InherentUnsharpness Geometric Unsharpness Affected by:•Absorption differences in specimen (thickness,composition,density)•Radiation wavelength •Scattered radiationAffected by:•Type of film•Degree of development (type of developer,time,temperature and activity of developer,degree of agitation)•Film density •Type ofscreens (that is,fluorescent,lead or none)Affected by:•Degree of screen-film contact •Total film thickness •Single ordouble emulsion coatings •Radiation quality •Type and thickness of screens (fluorescent,lead or none)Affected by:•Focal spot or source physical size •Source-to-film distance •Specimen-to-film distance•Abruptness of thickness changes in specimen •Motion of specimen or radiation sourceReduced or enhanced by:•Masks and diaphragms •Filters•Lead screens •Potter-Bucky diaphragmsFIG.1Variables of Radiographic ImageQualityFIG.2Effects of Object-Film Geometry15.Radiographic Distortion15.1The radiographic image of an object or feature within an object may be larger or smaller than the object or feature itself,because the penumbra of the shadow is rarely visible in a radiograph.Therefore,the image will be larger if the object or feature is larger than the source of radiation,and smaller if object or feature is smaller than the source.The degree of reduction or enlargement will depend on the source-to-object and object-to-film distances,and on the relative sizes of the source and the object or feature (Fig.2(b )and (c )).15.2The direction of the central beam of radiation should be perpendicular to the surface of the film whenever possible.The object image will be distorted if the film is not aligned perpendicular to the central beam.Different parts of the object image will be distorted different amount depending on the extent of the film to central beam offset (Fig.2(d )).16.Exposure Calculations or Charts16.1Development or procurement of an exposure chart or calculator is the responsibility of the individual laboratory.16.2The essential elements of an exposure chart or calcu-lator must relate the following:16.2.1Source or machine,16.2.2Material type,16.2.3Material thickness,16.2.4Film type (relative speed),16.2.5Film density,(see Note 5),16.2.6Source or source to film distance,16.2.7Kilovoltage or isotope type,N OTE 5—For detailed information on film density and density measure-ment calibration,see Practice E 1079.16.2.8Screen type andthickness,FIG.3Nomogram for Determining Geometrical Unsharpness (Inch-PoundUnits)16.2.9Curies or milliampere/minutes,16.2.10Time of exposure,16.2.11Filter (in the primary beam),16.2.12Time-temperature development for hand process-ing;access time for automatic processing;time-temperature development for dry processing,and16.2.13Processing chemistry brand name,if applicable.16.3The essential elements listed in 16.2will be accurate for isotopes of the same type,but will vary with X-ray equipment of the same kilovoltage and milliampere rating.16.4Exposure charts should be developed for each X-ray machine and corrected each time a major component is replaced,such as the X-ray tube or high-voltage transformer.16.5The exposure chart should be corrected when the processing chemicals are changed to a different manufacturer’s brand or the time-temperature relationship of the processormay be adjusted to suit the exposure chart.The exposure chart,when using a dry processing method,should be corrected based upon the time-temperature changes of the processor.17.Technique File17.1It is recommended that a radiographic technique log or record containing the essential elements be maintained.17.2The radiographic technique log or record should con-tain the following:17.2.1Description,photo,or sketch of the test object illustrating marker layout,source placement,and film location.17.2.2Material type and thickness,17.2.3Source to film distance,17.2.4Film type,17.2.5Film density,(see Note 5),17.2.6Screen type andthickness,FIG.4Nomogram for Determining Geometrical Unsharpness (MetricUnits)。
- 1、下载文档前请自行甄别文档内容的完整性,平台不提供额外的编辑、内容补充、找答案等附加服务。
- 2、"仅部分预览"的文档,不可在线预览部分如存在完整性等问题,可反馈申请退款(可完整预览的文档不适用该条件!)。
- 3、如文档侵犯您的权益,请联系客服反馈,我们会尽快为您处理(人工客服工作时间:9:00-18:30)。
arXiv:astro-ph/0703255v1 12 Mar 2007SpectralEnergyDistributionsofHardX-rayselectedAGNsintheXMDSSurvey
M.Polletta1,M.Tajer2,3,L.Maraschi2,G.Trinchieri2,C.J.Lonsdale1,L.Chiappetti4S.Andreon2,M.Pierre5,O.LeF`evre6,G.Zamorani7,D.Maccagni4,O.Garcet8,J.Surdej8,A.Franceschini9,D.Alloin5,D.L.Shupe10,J.A.Surace10,F.Fang10,M.Rowan-Robinson11,H.E.Smith1,L.Tresse6
ABSTRACTWepresentthespectralenergydistributions(SEDs)ofahardX-rayselectedsample.Thesamplecontains136sourceswithF2−10keV>10−14ergcm−2s−1and132areAGNs.Thesourcesaredetectedina1deg2areaoftheXMM-Newton-MediumDeepSurveywhereopticaldatafromtheVVDS,CFHTLSsurveys,andinfrareddatafromtheSWIREsurveyareavailable.BasedonaSEDfittingtechniquewederivephotometricredshiftswithσ(1+z)=0.11and6%ofoutliersandidentifyAGNsignaturesin83%oftheobjects.Thisfractionishigherthanderivedwhenaspectroscopicclassificationisavailable.Theremaining17+9−6%ofAGNsshowsstar-forminggalaxySEDs(SFclass).ThesourceswithAGNsignaturesaredividedintwoclasses,AGN1(33+6−1%)andAGN2(50+6−11%).TheAGN1andAGN2classesincludesourceswhoseSEDsarefittedbytype1andtype2AGNtemplates,respectively.Onaverage,AGN1sshowsoftX-rayspectra,consistentwithbeingunabsorbed,whileAGN2sandSFsshowhardX-rayspectra,consistentwithbeingabsorbed.TheanalysisoftheaverageSEDsasafunctionofX-rayluminosityshowsareddeningoftheIRSEDs,consistentwithadecreasingcontributionfromthehostgalaxyathigherluminosities.TheAGNsintheSFclassesarelikelyobscuredinthemid-infrared,assuggestedbytheirlowL3−20µm/Lcorr0.5−10keVratios.WeconfirmthepreviouslyfoundcorrelationforAGNsbetweentheradioluminosityandtheX-rayandthemid-infraredluminosities.TheX-ray-radiocorrelationcanbeusedtoidentifyheavilyabsorbedAGNs.However,theestimatedradiofluxesforthemissingAGNpopulationresponsibleforthebulkofthebackgroundatE>10keVaretoofainttobedetectedeveninthedeepestcurrentradiosurveys.
Subjectheadings:X-rays:galaxies–Infrared:galaxies–quasars:general–Galaxies:active
Bologna,Italy8Institutd’AstrophysiqueetdeG´eophysique,Universit´e
deLi`ege,All´eedu6Aoˆut17,4000Li`ege1,Belgium9DipartimentodiAstronomia,Universit`adiPadova,Vi-
colodell’Osservatorio2,I-35122,Padova,Italy10SpitzerScienceCenter,CaliforniaInstituteofTechnol-
ogy,100-22,Pasadena,CA91125,USA11AstrophysicsGroup,BlackettLaboratory,Imperial
College,PrinceConsortRoad,London,SW72BW,UK
1thedeepestX-rayobservations,e.g.theChan-draDeepSurveys,CDFN(Brandtetal.2001;Bargeretal.2002)andCDFS(Giacconietal.2002;Rosatietal.2002).TheexistenceofalargepopulationofAGNsthatisstillundetected,eveninthedeepestX-raysurveys,issuggestedbytheunresolvedX-raybackground(Worsleyetal.2005)andbythediscoveryofAGNsnotde-tectedatX-rayenergies,butidentifiedatradioandinfraredwavelengths(Pollettaetal.2006;Higdonetal.2005;Donleyetal.2005).Multi-wavelengthobservationsofAGNsarenecessarytomakeacensusofAGNsandtofullycharacterizethem.CurrentfacilitiesandprojectspermittostudylargeAGNsamplesthroughouttheentirewave-lengthspectrum,fromradiowavelengthstoX-rayenergies.Severalwideanddeepmulti-wavelengthsurveysarecurrentlybeingperformedprovidingenougharea,coverageandsensitivitytosamplethemulti-wavelengthpropertiesofAGNs.Adif-ficulttaskthatmulti-wavelengthsurveysneedtofaceistheidentificationofAGN.AGNsusuallyrepresentonlyasmallfractionofsourcescom-paredtothepopulationdetectedatopticalandIRwavelengthsandtheirpropertiescanbeelu-sive.ObscuredAGNscanbeelusivebecausetheiropticalemissionresemblesthatofnormalgalax-iesandthereforetheycannotbeidentifiedbythecolor-selectiontechniquesusedforQSOs(e.g.Schmidt&Green1983),orbecausetheirspec-tradonotshowanyAGNsignature.TheirIRemissioncanbedominatedbyPAHfeatures,typ-icalofstar-forminggalaxies,insteadofcontinuumemissionfromhotdust.Radioobservationsre-vealtheradio-loudpopulationofobscuredAGNs(e.g.radiogalaxies),butthiscomprisesonlyasmallfraction,∼10%,ofthetotalAGNpopula-tion.AhardX-rayselectionfailstodetecttheluminousnarrow-lineAGNsinthenumberspre-dictedbysomemodelsoftheCXRB.InordertoobtainacompletepictureoftheAGNpopulation,selectionbiasesneedtobetakenintoaccount.ThefractionofAGNsmissedinob-servationsinnarrowenergywindows,e.g.X-rays,infrared,oroptical,isnotwellknown.Moreover,thedispersioninthespectralenergydistributions(SEDs)ofallkindofAGNsneedstobewellchar-acterizedtoevaluatewhichandwhatfractionofAGNsaremissedinawavelengthwindowandde-tectedinanotherbecauseoftheunmatcheddepthsoftheobservationsatdifferentwavelengths.TheSEDsarealsoimportantforevolutionarymod-els(Treisteretal.2004;Silvaetal.2004;Xuetal.2003;Ballantyneetal.2006),andtoestimatethecontributionofaccretiontothecosmicback-grounds.Inthiswork,wecharacterizetheSEDsofasampleofAGNsselectedinthehardX-raysandinvestigatehowtheyvaryasafunctionofX-rayabsorption,luminosity,redshift,andhostgalaxycontribution.AselectioninthehardX-raysminimizesthebiasagainstabsorbedAGNscomparedtosamplesselectedatsoftorbroad-bandX-rayenergies.OuranalysisisbasedonthesourcesdetectedbyXMM-Newtonina1deg2regionoftheXMM-NewtonMediumDeepSurvey(XMDS;Chiappettietal.2005,,here-inafterPaperI)intheXMM-LargeScaleSur-veyfield(XMM-LSS;Pierreetal.2004,2007).ThisregionhasalsobeenobservedaspartoftheSpitzerWide-AreaInfraredExtragalacticSur-vey(SWIRE)(Lonsdaleetal.2003)legacypro-gram,oftheVIMOSVLTDeepSurvey(VVDS;McCrackenetal.2003;LeF`evreetal.2004),andoftheCanada-FranceHawaiiTelescopeLegacy“Deep”(D1)Survey.Theavailablemulti-wavelengthdataset,thesourcecatalog,andtheX-rayobservationsanddataaresummarizedinSection2anddescribedindetailinacompanionpaper(Tajeretal.2007,hereinafterPaperII).Here,wepresentthetechniqueusedtoclassifytheSEDsandtoestimatephotometricredshifts(Section3).WedividethesampleinthreemainAGNclassesbasedontheirSEDs:AGN1,AGN2,andstar-forming(SF)likeAGNs.TheaveragepropertiesoftheSEDsofthethreeAGNclassesaredescribedinSection4.Luminositiesandab-sorptionareestimatedandtheirroleinshapingtheobservedSEDsarediscussedinSection5.TherelationshipbetweentheX-rayandthemid-IRluminositiesisinvestigatedinSection6,andthevariationsofthemid-IRoverX-rayluminosityratioasafunctionofX-rayluminosityandAGNclassarediscussedinSection6.TheaverageSEDsofthethreeclassesregroupedbyX-rayluminos-ityarediscussedinSection7.TheanalysisoftheAGNIRcolorscomparedwiththeirluminos-ity,redshiftandSEDclassificationispresentedinSection8.Forasub-setofsources,radiodataare