数学专业英语课后部分
数学专业英语(Doc版).13
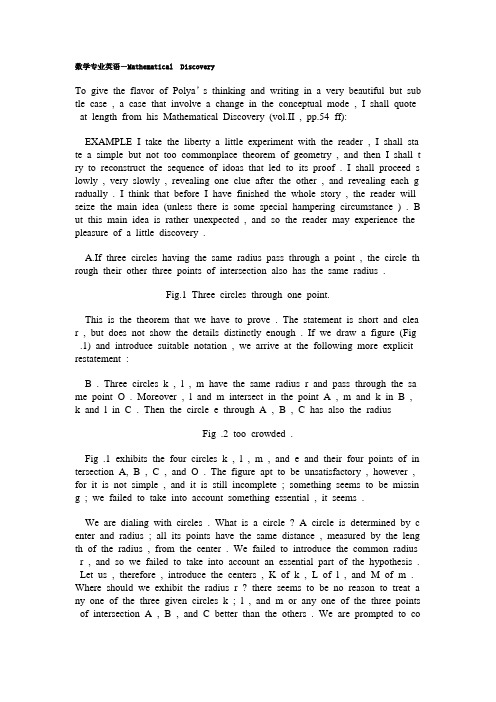
数学专业英语-Mathematical DiscoveryTo give the flavor of Polya’s thinking and writing in a very beautiful but sub tle case , a case that involve a change in the conceptual mode , I shall quote at length from his Mathematical Discovery (vol.II , pp.54 ff):EXAMPLE I take the liberty a little experiment with the reader , I shall sta te a simple but not too commonplace theorem of geometry , and then I shall t ry to reconstruct the sequence of idoas that led to its proof . I shall proceed s lowly , very slowly , revealing one clue after the other , and revealing each g radually . I think that before I have finished the whole story , the reader will seize the main idea (unless there is some special hampering circumstance ) . B ut this main idea is rather unexpected , and so the reader may experience the pleasure of a little discovery .A.If three circles having the same radius pass through a point , the circle th rough their other three points of intersection also has the same radius .Fig.1 Three circles through one point.This is the theorem that we have to prove . The statement is short and clea r , but does not show the details distinctly enough . If we draw a figure (Fig .1) and introduce suitable notation , we arrive at the following more explicit restatement :B . Three circles k , l , m have the same radius r and pass through the sa me point O . Moreover , l and m intersect in the point A , m and k in B , k and l inC . Then the circle e through A , B , C has also the radiusFig .2 too crowded .Fig .1 exhibits the four circles k , l , m , and e and their four points of in tersection A, B , C , and O . The figure apt to be unsatisfactory , however , for it is not simple , and it is still incomplete ; something seems to be missin g ; we failed to take into account something essential , it seems .We are dialing with circles . What is a circle ? A circle is determined by c enter and radius ; all its points have the same distance , measured by the leng th of the radius , from the center . We failed to introduce the common radius r , and so we failed to take into account an essential part of the hypothesis . Let us , therefore , introduce the centers , K of k , L of l , and M of m . Where should we exhibit the radius r ? there seems to be no reason to treat a ny one of the three given circles k ; l , and m or any one of the three points of intersection A , B , and C better than the others . We are prompted to connect all three centers with all the points of intersection of the respective circl e ; K with B , C , and O , and so forth .The resulting figure (Fig . 2) is disconcertingly crowded . There are so many lines , straight and circular , that we have much trouble old-fashioned maga zines . The drawing is ambiguous on purpose ; it presents a certain figure if you look t it in the usual way , but if you turn it to a certain position and lo ok at it in a certain peculiar way , suddenly another figure flashes on you , s uggesting some more or less witty comment on the first . Can you recognize i n our puzzling figure , overladen with straight and circles , a second figure th at makes sense ?We may hit in a flash on the right figure hidden in our overladen drawing , or we may recognize it gradually . We may be led to it by the effort to sol ve the proposed problem , or by some secondary , unessential circumstance . For instance , when we are about to redraw our unsatisfactory figure , we ma y observe that the whole figure is determined by its rectilinear part (Fig . 3) .This observation seems to be significant . It certainly simplifies the geometri c picture , and it possibly improves the logical situation . It leads us to restate our theorem in the following form .C . If the nine segmentsKO , KC , KB ,LC , LO , LA ,MB , MA , MO ,are all equal to r , there exists a point E such that the three segmentsEA , EB , EC ,are also equal to r .Fig . 3 It reminds you -of what ?This statement directs our attention to Fig . 3 . This figure is attractive ; it reminds us of something familiar . (Of what ?)Of course , certain quadrilaterals in Fig .3 . such as OLAM have , by hypo thesis , four equal sided , they are rhombi , A rhombus I a familiar object ; having recognized it , we can “see “the figure better . (Of what does the whole figure remind us ?)Oppositc sides of a rhombus are parallel . Insisting on this remark , we reali ze that the 9 segments of Fig . 3 . are of three kinds ; segments of the same kind , such as AL , MO , and BK , are parallel to each other . (Of what d oes the figure remind us now ?)We should not forget the conclusion that we are required to attain . Let us a ssume that the conclusion is true . Introducing into the figure the center E or the circle e , and its three radii ending in A , B , and C , we obtain (suppos edly ) still more rhombi , still more parallel segments ; see Fig . 4 . (Of wha t does the whole figure remind us now ?)Of course , Fig . 4 . is the projection of the 12 edges of a parallele piped h aving the particularity that the projection of all edges are of equal length .Fig . 4 of course !Fig . 3 . is the projection of a “nontransparent “parallelepiped ; we see o nly 3 faces , 7 vertices , and 9 edges ; 3 faces , 1 vertex , and 3 edges are invisible in this figure . Fig . 3 is just a part of Fig . 4 . but this part define s the whole figure . If the parallelepiped and the direction of projection are so chosen that the projections of the 9 edges represented in Fig . 3 are all equa l to r (as they should be , by hypothesis ) , the projections of the 3 remainin g edges must be equal to r . These 3 lines of length r are issued from the pr ojection of the 8th, the invisible vertex , and this projection E is the center o f a circle passing through the points A , B , and C , the radius of which is r .Our theorem is proved , and proved by a surprising , artistic conception of a plane figure as the projection of a solid . (The proof uses notions of solid g eometry . I hope that this is not a treat wrong , but if so it is easily redresse d . Now that we can characterize the situation of the center E so simply , it i s easy to examine the lengths EA , EB , and EC independently of any solid geometry . Yet we shall not insist on this point here .)This is very beautiful , but one wonders . Is this the “light that breaks fo rth like the morning . “the flash in which desire is fulfilled ? Or is it merel y the wisdom of the Monday morning quarterback ? Do these ideas work out in the classroom ? Followups of attempts to reduce Polya’s program to practi cal pedagogics are difficult to interpret . There is more to teaching , apparentl y , than a good idea from a master .——From Mathematical ExperienceVocabularysubtle 巧妙的,精细的clue 线索,端倪hamper 束缚,妨碍disconcert 使混乱,使狼狈ambiguous 含糊的,双关的witty 多智的,有启发的rhombi 菱形(复数)rhombus 菱形parallelepiped 平行六面体projection 射影solid geometry 立体几何pedagogics 教育学,教授法commonplace 老生常谈;平凡的。
数学专业英语(Doc版).12
数学专业英语(Doc版).12数学专业英语-Linear ProgrammingLinear Programming is a relatively new branch of mathematics.The cornerstone of this exciting field was laid independently bu Leonid V. Kantorovich,a Russ ian mathematician,and by Tjalling C,Koopmans, a Yale economist,and George D. Dantzig,a Stanford mathematician. Kantorovich’s pioneering work was moti vated by a production-scheduling problem suggested by the Central Laboratory of the Len ingrad Plywood Trust in the late 1930’s. The development in the U nited States was influenced by the scientific need in World War II to solve lo gistic military problems, such as deploying aircraft and submarines at strategic positions and airlifting supplies and personnel.The following is a typical linear programming problem:A manufacturing company makes two types of television sets: one is black and white and the other is color. The company has resources to make at most 300 sets a week. It takes $180 to make a black and white set and $270 to make a color set. The company does not want to spend more than $64,800 a wee k to make television sets. If they make a profit of $170 per black and white set and $225 per color set, how many sets of each type should the company make to have a maximum profit?This problem is discussed in detail in Supplementary Reading Material Lesson 14.Since mathematical models in linear programming problems consist of linear in equalities, the next section is devoted to suchinequalities.Recall that the linear equation lx+my+n=0represents a straight line in a plane. Every solution (x,y) of the equation lx+my+n=0is a point on this line, and vice versa.An inequality that is obtained from the linear equation lx+my+n=0by replacin g the equality sign “=”by an inequality sign < (less than), ≤(less than or equal to), > (greater than), or ≥(greater than or equal to) is called a linear i nequality in two variables x and y. Thus lx+my+n≤0, lx+my+n≥0are all lin ear liequalities. A solution of a linear inequality is an ordered pair (x,y) of nu mbers x and y for which the inequality is true.EXAMPLE 1 Graph the solution set of the pair of inequalities SOLUTION Let A be the solution set of the inequality x+y-7≤0 and B be th at of the inequalit y x-3y +6 ≥0 .Then A∩B is the solution set of the given pair of inequalities. Set A is represented by the region shaded with horizontal lines and set B by the region shaded with vertical lines in Fig.1. Therefore thecrossed-hatched region represents the solution set of the given pair of inequali ties. Observe that the point of intersection (3.4) of the two lines is in the solu tion set.Generally speaking, linear programming problems consist of finding the maxim um value or minimum value of a linear function, called the objective function, subject to some linear conditions, called constraints. For example, we may wa nt to maximize the production or profit of a company or to maximize the num ber of airplanes that can land at or take off from an airport during peak hours; or we may want to minimize the cost of production or of transportation or to minimize grocery expenses while still meeting the recommended nutritional re quirements, all subject to certain restrictions. Linearprogramming is a very use ful tool that can effectively be applied to solve problems of this kind, as illust rated by the following example.EXAMPLE 2 Maximize the function f(x,y)=5x+7y subject to the constraintsx≥0 y≥0x+y-7≤02x-3y+6≥0SOLUTION First we find the set of all possible pairs(x,y) of numbers that s atisfy all four inequalities. Such a solution is called a feasible sulution of the problem. For example, (0,0) is a feasible solution since (0,0) satisf ies the giv en conditions; so are (1,2) and (4,3).Secondly, we want to pick the feasible solution for which the giv en function f (x,y) is a maximum or minimum (maximum in this case). S uch a feasible solution is called an optimal solution.Since the constraints x ≥0 and y ≥0 restrict us to the first quadrant, it follows from example 1 that the given constraints define the polygonal regi on bounded by the lines x=0, y=0,x+y-7=0, and 2x-3y+6=0, as shown in Fig.2.Fig.2.Observe that if there are no conditions on the values of x and y, then the f unction f can take on any desired value. But recall that our goal is to determi ne the largest value of f (x,y)=5x+7y where the values of x and y are restrict ed by the given constraints: that is, we must locate that point (x,y) in the pol ygonal region OABC at which the expression 5x+7y has the maximum possibl e value.With this in mind, let us consider the equation 5x+7y=C, where C is any n umber. This equation represents a family ofparallel lines. Several members of this family, corresponding to different values of C, are exhibited in Fig.3. Noti ce that as the line 5x+7y=C moves up through the polygonal region OABC, th e value of C increases steadily. It follows from the figure that the line 5x+7y =43 has a singular position in the family of lines 5x+7y=C. It is the line farth est from the origin that still passes through the set of feasible solutions. It yiel ds the largest value of C: 43.(Remember, we are not interested in what happen s outside the region OABC) Thus the largest value of the function f(x,y)=5x+7 y subject to the condition that the point (x,y) must belong to the region OAB C is 43; clearly this maximum value occurs at the point B(3,4).Fig.3.Consider the polygonal region OABC in Fig.3. This shaded region has the p roperty that the line segment PQ joining any two points P and Q in the regio n lies entirely within the region. Such a set of points in a plane is called a c onvex set. An interesting observation about example 2 is that the maximum va lue of the objective function f occurs at a corner point of the polygonal conve x set OABC, the point B(3,4).The following celebrated theorem indicates that it was not accidental.THEOREM (Fundamental theorem of linear programming) A linear objective function f defined over a polygonal convex set attains a maximum (or minim um) value at a corner point of the set.We now summarize the procedure for solving a linear programming problem:1.Graph the polygonal region determined by the constraints.2.Find the coordinates of the corner points of the polygon.3.Evaluate the objective function at the corner points.4.Identify the corner point at which the function has an optimal value.Vocabularylinear programming 线形规划 quadrant 象限objective function 目标函数 convex 凸的constraints 限制条件,约束条件 convex set 凸集feaseble solution 容许解,可行解corner point 偶角点optimal solution 最优解simplex method 单纯形法Notes1. A Yale economist, a Stanford mathematician 这里Yale Stanford 是指美国两间著名的私立大学:耶鲁大学和斯坦福大学,这两间大学分别位于康涅狄格州(Connecticut)和加里福尼亚州(California)2. subject to some lincar conditions 解作“在某些线形条件的限制下”。
数学专业英语25
However, our primary purpose is to discuss calculus. Concepts from analytic geometry that are required for this purpose will be discussed as needed.
不过,我们的主要目的是讨论微积分。为此,解析几 何中的概念将只是在必要时讨论。
R.笛卡儿提出了一种好得多的办法,并建立了解析几 何(也称为笛卡儿几何)这个学科。
Descartes’ idea was to represent geometric points by numbers. The procedure for points in a plane is this :
笛卡儿的思想就是用数来表示几何点,在平面上找点 的过程如下:
如果想拓展微积分的范围与应用,需要进一步研究解 析几何,而这种研究需用到向量的方法来实现。
Until then, all that is required from analytic geometry is a little familiarity with drawing graph of function.
一个几何图形是满足一个或多个特殊条件的点集,比 如平面上的曲线。
By translating these conditions into expressions, involving the coordinates x and y, we obtain one or more equations which characterize the figure in question.
A deeper study of analytic geometry is needed to extend the scope and applications of calculus, and this study will be carried out using vector method.
数学专业英语(Doc版).14

数学专业英语-MathematicansLeonhard Euler was born on April 15,1707,in Basel, Switzerland, the son of a mathematician and Caivinist pastor who wanted his son to become a pastor a s well. Although Euler had different ideas, he entered the University of Basel to study Hebrew and theology, thus obeying his father. His hard work at the u niversity and remarkable ability brought him to the attention of the well-known mathematician Johann Bernoulli (1667—1748). Bernoulli, realizing Euler’s tal ents, persuaded Euler’s father to change his mind, and Euler pursued his studi es in mathematics.At the age of nineteen, Euler’s first original work appeared. His paper failed to win the Paris Academy Prize in 1727; however this loss was compensated f or later as he won the prize twelve times.At the age of 28, Euler competed for the Pairs prize for a problem in astrono my which several leading mathematicians had thought would take several mont hs to solve.To their great surprise, he solved it in three days! Unfortunately, th e considerable strain that he underwent in his relentless effort caused an illness that resulted in the loss of the sight of his right eye.At the age of 62, Euler lost the sight of his left eye and thus became totally blind. However this did not end his interest and work in mathematics; instead, his mathematical productivity increased considerably.On September 18, 1783, while playing with his grandson and drinking tea, Eul er suffered a fatal stroke.Euler was the most prolific mathematician the world has ever seen. He made s ignificant contributions to every branch of mathematics. He had phenomenal m emory: He could remember every important formula of his time. A genius, he could work anywhere and under any condition.George cantor (March 3, 1845—June 1,1918),the founder of set theory, was bo rn in St. Petersburg into a Jewish merchant family that settled in Germany in 1856.He studied mathematics, physics and philosophy in Zurich and at the University of Berlin. After receiving his degree in 1867 in Berlin, he became a lecturer at the university of Halle from 1879 to 1905. In 1884,under the stra in of opposition to his ideas and his efforts to prove the continuum hypothesis, he suffered the first of many attacks of depression which continued to hospita lize him from time to time until his death.The thesis he wrote for his degree concerned the theory of numbers; however, he arrived at set theory from his research concerning the uniqueness of trigon ometric series. In 1874, he introduced for the first time the concept of cardinalnumbers, with which he proved that there were “more”transcendental numb ers than algebraic numbers. This result caused a sensation in the mathematical world and became the subject of a great deal of controversy. Cantor was troub led by the opposition of L. Kronecker, but he was supported by J.W.R. Dedek ind and G. Mittagleffer. In his note on the history of the theory of probability, he recalled the period in which the theory was not generally accepted and cri ed out “the essence of mathematics lies in its freedom!”In addition to his work on the concept of cardinal numbers, he laid the basis for the concepts of order types, transfinite ordinals, and the theory of real numbers by means of fundamental sequences. He also studied general point sets in Euclidean space a nd defined the concepts of accumulation point, closed set and open set. He wa s a pioneer in dimension theory, which led to the development of topology.Kantorovich was born on January 19, 1912, in St. Petersburg, now called Leni ngrad. He graduated from the University of Leningrad in 1930 and became a f ull professor at the early age of 22.At the age of 27, his pioneering contributi ons in linear programming appeared in a paper entitled Mathematical Methods for the Organization and planning of production. In 1949, he was awarded a S talin Prize for his contributions in a branch of mathematics called functional a nalysis and in 1958, he became a member of the Russian Academy of Science s. Interestingly enough, in 1965,kantorovich won a Lenin Prize fo r the same o utstanding work in linear programming for which he was awarded the Nobel P rize. Since 1971, he has been the director of the Institute of Economics of Ma nagement in Moscow.Paul R. Halmos is a distinguished professor of Mathematics at Indiana Univers ity, and Editor-Elect of the American Mathematical Monthly. He received his P h.D. from the University of Illinois, and has held positions at Illinois, Syracuse, Chicago, Michigan, Hawaii, and Santa Barbara. He has published numerous b ooks and nearly 100 articles, and has been the editor of many journals and se veral book series. The Mathematical Association of America has given him the Chauvenet Prize and (twice) the Lester Ford award for mathematical expositio n. His main mathematical interests are in measure and ergodic theory, algebraic, and operators on Hilbert space.Vito Volterra, born in the year 1860 in Ancona, showed in his boyhood his e xceptional gifts for mathematical and physical thinking. At the age of thirteen, after reading Verne’s novel on the voyage from earth to moon, he devised hi s own method to compute the trajectory under the gravitational field of the ear th and the moon; the method was worth later development into a general proc edure for solving differential equations. He became a pupil of Dini at the Scu ola Normale Superiore in Pisa and published many important papers while still a student. He received his degree in Physics at the age of 22 and was made full professor of Rational Mechanics at the same University only one year lat er, as a successor of Betti.Volterra had many interests outside pure mathematics, ranging from history to poetry, to music. When he was called to join in 1900 the University of Rome from Turin, he was invited to give the opening speech of the academic year. Volterra was President of the Accademia dei Lincei in the years 1923-1926. H e was also the founder of the Italian Society for the Advancement of Science and of the National Council of Research. For many years he was one of the most productive scientists and a very influential personality in public life. Whe n Fascism took power in Italy, Volterra did not accept any compromise and pr eferred to leave his public and academic activities.Vocabularypastor 牧师 hospitalize 住进医院theology 神学 thesis 论文strain 紧张、疲惫transcendental number 超越数relentless 无情的sensation 感觉,引起兴趣的事prolific 多产的controversy 争论,辩论depression 抑郁;萧条,不景气essence 本质,要素transfinite 超限的Note0. 本课文由几篇介绍数学家生平的短文组成,属传记式体裁。
数学专业英语(Doc版).22

数学专业英语-The Normal DistributionWe shall begin by considering some simple continuously variable quantity like stature.We know this varies greatly from one individual to another ,and may al so expect to find certain average differences between people drawn from differ ent social classes or living in different geographical areas,etc.Let us suppose th at a socio-medical survey of a particular community has provided us with a re presentative sample of 117 males whose heights are distributed as shown in th e first and third columns of Table 1.Table 1.Distribution of stature in 117 malesWe shall assume that the original measurements were made as accurately as possible,but that they are given here only to the mearest 0.02 m (i.e.2 cm).Thu s the group labeled “1.66”contains all those men whose true measurements were between 1065 and 1067 m.One si biable to run into trouble if the exact methods of recording the measurements and grouping them are not specified ex actly.In the example just given the mid-point of the interval labeled”1.66”m. But suppose that the original readings were made only to the nearest 0.01 m (i.e. 1 cm )and then “rounded up “to the nearest multiple of 0.02 m.We sho uld then have “1.65”, which covers the range 1.645 to 1.655,included with “1.66”.The interval “1.66”would then contain all measurements lying betwe en 1.645 m and 1.665 m .for which the mid-point is 1.655 m. The difference of 5 mm from the supposed value of 1.66 m could lead to serious inaccuracy in certain types of investigation.A convenient visual way of presenting such data is shown in fig. 1, in which the area of e ach rectangle is ,on the scale used, equal to the observed proportion or percentage of indiv iduals whose height falls in the corresponding group.The total area covered by all the recta ngles therefore adds up to unity or 100per cent .This diagram is called a histogram.It is ea sily constructed when ,sa here ,all the groups are of the same width.It is also easily adapt ed to the case when the intervals are uneqal, provided we remember that the areas of the rec tangles must be proportional to the numbers of units concerned.If, for example, we wished to group togcther the entries for the three groups 1.80,1.82 and 1.84 m,totaling 7 individuals or 6 per cent of the total,then we should need a rectangle whose base covered 3working grou ps on the horizontal scale but whose height was only 2 units on the vertical scale shown in the diagram.In this way we can make allowance for unequal grouping intervals ,but it is usua lly less troublesome if we can manageto keep them all the same width.In some books histogram s are drawn so that the area of each rectangle is equal to the actual number (instend of the proportion) of individuals in the corresponding group.It is better, however, to use proport ions, sa different histograms can then be compared directly.----------------------------------------------The general appearance of the rectangles in Fig.1 is quite striking ,especially the tall hump in the centre and the rapidly falling tails on each side.There are certain minor irregularities in the pattern, and these would, in general ,be more ronounced if the size of the sample were smaller. Conversely, weth larger sa mples we usually find that the set of rectangles presents a more regular appearance. This suggests that if we had a very large number of measurements ,the ultimate shape of the picture for a suitably small wi dth of rectangle would be something very like a smooth curve,Such a curve could be regarded as represe nting the true ,theoretical or ideal distribution of heights in a very(or ,better,infinitely)large population of individuals.What sort of ideal curve can we expect ? There are seveala theoretical reasons for expecting the so-call ed Gaussiao or “normal “curve to turn up in practice;and it is an empirical fact that such a curve lften describes with sufficient accuracy the shape of histograms based on large numbers of obscrvations. More over,the normal curve is one of the easiest to handle theoretically,and it leads to types of statistical analy sis that can be carried out with a minimum amount of computation. Hence the central importance of this distribution in statistical work .The actual mathematical equation of the normal curve is where u is the mean or average value and is t he standard deviation, which is a measure of the concentration of frequency about the mean. More will b e said about and later .The ideal variable x may take any value from to .However ,some real measureme nts,like stature, may be essentially positive. But if small values are very rare ,the ideal normal curve ma y be a sufficiently close approximation. Those readers who are anxious to avoid as much algebraic mani pulation as possible can be reassured by the promise that no derect use will be made in this book of th e equation shown. Most of the practical numerical calculations to which it leads are fairly simple.Fig. 1 shows a normal curve, with its typocal symmetrical bell shape , fitted by suitable methods to the data embodied in the rectangles. This is not to say that the fitted curve is actually the t rue, ideal one t o which the histogram approxime.tes; it is merely the best approximation we can find.The mormal curve used above is the curve we have chosen to represent the frequency distribution of st ature for thr ideal or infinitely large population. This ideal poplation should be contrasted with the limite d sample of obsrever. Values that turns up on any occasion when we make actual measurements in the r eal world. In the survey mentioned above we had a sample of 117 men .If the community were sufficie ntly large for us to collect several samples of this size, we should find that few if any of the correspon ding histograms were exactly the same ,although they might all be taken as illustrating the underlying fre quency distribution. The differences between such histograms constitute what we call sampling variation, and this becomes more prominent at the size of sample decreases.VocabularySocio-medical survey 社会医疗调查表 visual 可见的。
《数学专业英语》课件
Introduction to Mathematics Professional EnglishMathematics Professional English VocabularyGrammar and Expression in Mathematical English
01
Definition and Importance
Course content: covering basic mathematical vocabulary, mathematical formulas and symbols, academic paper reading and writing, academic speeches and communication, mathematical literature translation, and other aspects.
Course objectives and content
Course objective: To cultivate students' mastery of basic vocabulary, grammar, and expression in mathematics related English, and to improve their English reading, writing, communication, and translation abilities in the field of mathematics.
English interface of software and tools
Learn how to read and understand English documentation for mathematical software and tools, master the professional terms and expressions in the documentation, and lay a foundation for in-depth learning and application.
数学专业英语(吴炯圻)
New Words & Expressions:algebra 代数学geometrical 几何的algebraic 代数的identity 恒等式arithmetic 算术, 算术的measure 测量,测度axiom 公理numerical 数值的, 数字的conception 概念,观点operation 运算constant 常数postulate 公设logical deduction 逻辑推理proposition 命题division 除,除法subtraction 减,减法formula 公式term 项,术语trigonometry 三角学variable 变化的,变量2.1 数学、方程与比例Mathematics, Equation and Ratio4Mathematics comes from man’s social practice, for example, industrial and agricultural production, commercial activities, military operations and scientific and technological researches.1-A What is mathematics数学来源于人类的社会实践,比如工农业生产,商业活动,军事行动和科学技术研究。
And in turn, mathematics serves the practice and plays a great role in all fields. No modern scientific and technological branches could be regularly developed without the application of mathematics. 反过来,数学服务于实践,并在各个领域中起着非常重要的作用。
数学专业英语第二版的课文翻译
数学专业英语第二版的课文翻译 数学专业英语(第二版)课文翻译。 第一章:数学基础概念。 1.1 集合论基础。 原文。 A set is a collection of objects, and these objects are called elements of the set. We usually use capital letters, such as A, B, C, … to denote sets, and lowercase letters a, b, c, … to denote elements of sets. If a is an element of the set A, we write a∈ A, and read “a belongs to A” or “a is in A”. If a is not an element of A, we write a∉ A, and read “a does not belong to A” or “a is not in A”.
翻译。 集合是对象的总体,这些对象被称为集合的元素。我们通常用大写字母,如 A、B、C 等来表示集合,用小写字母 a、b、c 等来表示集合的元素。如果 a 是集合 A 的一个元素,我们记作 a∈ A,读作“a 属于 A” 或者 “a 在 A 中”。如果 a 不是集合 A 的元素,我们记作 a∉ A,读作“a 不属于 A” 或者 “a 不在 A中”。
1.2 函数的概念。 原文。 A function f from a set A to a set B is a rule that assigns to each element x in A exactly one element y in B. We write y = f(x), and call x the independent variable and y the dependent variable. The set A is called the domain of the function f, and the set of all values f(x) for x∈ A is called the range of f. 翻译。 从集合 A 到集合 B 的函数 f 是这样一个规则:它给集合 A 中的每一个元素 x 都恰好在集合 B 中指定一个元素 y。我们记作 y = f(x),并称 x 为自变量,y 为因变量。集合 A 被称为函数 f 的定义域,对于 x∈ A,所有 f(x) 的值构成的集合被称为 f的值域。
数学专业英语
数学专业英语第二章精读课文-- 入门必修2.1 数学方程与比例(Mathematics,Equation and Ratio)一、词汇及短语:1. Cha nge the terms about变形2. full of :有许多的充满的例The StreetS are full of people as on a holiday像假日一样,街上行人川流不息)3. in groups of ten??4. match SOmething against sb. “匹配”例Long ago ,when people had to Count many things ,they matChed them against their fingers. 古时候,当人们必须数东西时,在那些东西和自己的手指之间配对。
5. grow out of 源于由…引起例Many close friendships grew out of common acquaintance6. arrive at 得出(到达抵达达到达成)例We both arrived at the Same COnclusion我们俩个得出了相同的结论)7. stand for “表示,代表”8. in turn “反过来,依次”9. bring about 发生导致造成10. arise out of 引起起源于11. express by “用…表示”12. occur 发生,产生13. come from 来源于,起源于14. resulting method 推论法15. be equal to 等于的相等的例TWiCe two is equal to four(2 乘以 2 等于4)16. no matter 无论不管17. mathematical analysis 数学分析18. differential equation 微分方程19. higher mathematics 高等数学higher algebra 高等代数20. equation of condition 条件等式二句型及典型翻译1. For a long period of the history of mathematics, the centric place of mathematicalmethods was occupied by the logical deductions “在数学史的很长的时期内,是逻辑推理一直占据数学方法的中心地位”2. An equation is a statement of the equality between two equal numbers or numbersymbols.equation :“方程”“等式” 等式是关于两个数或数的符号相等的一种陈述3. In such an equation either the two members are alike, or become alike onperformance of the indicated operation. 这种等式的两端要么一样,要么经过执行指定的运算后变成一样。
数学专业英语答案之2.2 几何与三角
2.2 几何与三角词组翻译1.学会institution,建筑师 architect, 机械师 machinist, 制图员draftsman, 测量者surveyor, 木匠carpenter2.点point, 端点endpoint, 线line, 直线straight line, 线段 line segment, 曲线curved line, 折线 broken line, 射线ray , 平面 plane,曲面 curved surface3.立体solid, 柱体cylinder, 立方体cube,球 sphere, 棱锥pyramid,圆锥 cone ,4.圆circle,圆心 center, 直径diameter, 半径radius, 半圆semicircle, 弦chord, 弧arc, 优弧major arc, 劣弧minor arc5.角angle, 边side, 三角形triangle, 直角三角形right triangle,斜边 hypotenuse, 直角边right-angle side6.长度length,宽度 breadth/width,厚度 thickness, 位置position7.几何的geometrical,立体的 three-dimensional , 弯曲的curved,等距离的equidistant ,无限的 infinite8.培养创造力train originality,必须的毅力 necessary perseverance , 提高鉴赏力raise/improve the appreciation ability9.消失了的边界vanishing boundaries/landmarks,有序性和优美感 orderliness and sense of beauty, 几何图形大量存在geometric forms abound in , 定理成立的先决条件a prerequisite to a theorem 汉译英1.许多专家都认为数学是学习其他科学技术的必备基础和先决条件。
- 1、下载文档前请自行甄别文档内容的完整性,平台不提供额外的编辑、内容补充、找答案等附加服务。
- 2、"仅部分预览"的文档,不可在线预览部分如存在完整性等问题,可反馈申请退款(可完整预览的文档不适用该条件!)。
- 3、如文档侵犯您的权益,请联系客服反馈,我们会尽快为您处理(人工客服工作时间:9:00-18:30)。
数学专业英语课后部分习题答案 数学专业英语课后部分习题答案 2.1 数学、方程与比例 (1)数学来源于人类的社会实践,包括工农业的劳动,商业、军事和科学技术研究等活动。 Mathematics comes from man’s social practice, for example, industrial and agricultural production, commercial activities, military operations and scientific and technological researches. (2)如果没有运用数学,任何一个科学技术分支都不可能正常地发展。 No modern scientific and technological branches could be regularly developed without the application of mathematics. (3)符号在数学中起着非常重要的作用,它常用于表示概念和命题。 Notations are a special and powerful tool of mathematics and are used to express conceptions and propositions very often. (4)17 世纪之前,人们局限于初等数学,即几何、三角和代数,那时只考虑常数。 Before 17th century, man confined himself to the elementary mathematics, i. e. , geometry, trigonometry and algebra, in which only the constants were considered. (5)方程与算数的等式不同在于它含有可以参加运算的未知量。 Equation is different from arithmetic identity in that it contains unknown quantity which can join operations. (6)方程又称为条件等式,因为其中的未知量通常只允许取某些特定的值。 Equipment is called an equation of condition in that it is true only for certain values of unknown quantities in it. (7)方程很有用,可以用它来解决许多实际应用问题。 Equations are of very great use. We can use equations in many mathematical problems. (8)解方程时要进行一系列移项和同解变形,最后求出它的根,即未知量的值。 To solve the equation means to move and change the terms about without making the equation untrue, until the root of the equation is obtained, which is the value of unknown term. 2.2 几何与三角 (1)许多专家都认为数学是学习其他科学技术的必备基础和先决条件。 Many experts recognize that mathematics is the necessary foundation and prerequisite of studying other science technology. (2)西方国家的专家认为几何起源于巴比伦和埃及人的土地测量技术,其实中国古代的数学 家对几何做了许多出色的研究。 The western experts think that geometry had its origin in the measurements by the Babylonians and Egyptians of their lands. Infect, the ancient Chinese mathematicians made much remarkable study for geometry. (3)几何的学习使学生在思考问题时更周密和审慎,他们将不会盲目接受任何结论。 In studying geometry, the student is taught to think clearly and critically and he is led away from the practice of blind acceptance of any conclusions. (4)数学培养学生的分析问题的能力,使他们能应用毅力、创造性和逻辑推理来解决问题。 Studying mathematics can develop the students’ ability to analyze problems and utilizing perseverance, originality, and logical reasoning in solving the problem. (5)几何主要不是研究数,而是形,例如三角形,平行四边形和圆,虽然它也与数有关。 Geometry mainly studies hot numbers but figures such as triangles, parallelograms and circles, though it is related with numbers. (6)一个立体(图形)有长、宽和高;面(曲面或平面)有长和宽,但没有厚度;线(直线 或曲线)有长度,但既没有宽度,也没有厚度;点只有位置,却没有大小。 A solid (figure) has length, width and height. A surface (curved surface or plane surface) has length and width, but no thickness. A line (straight line or curved line) has length, but no width and thickness. A point has position, but no dimension. (7)射线从某个点出发无限延伸;两条从同一点出发的射线构成了角。这两条射线称为这个 角的两边,当这两边位于同一直线上且方向相反时,所得的角是平角。 A ray starts from a point and extends infinitely far. Two rays starting from one point form an angle, which are called two edges of the angle. When two edges lie in the same line and have opposite direction named plane angle. (8)平面上的闭曲线当其中每一点到一个固定点的距离均相等时叫做圆。这个固定点称为圆 心,经过圆心且其两个端点在圆周上的线段称为这个圆的直径,直径的一半叫做半径,这条 曲线的长度叫做周长。 A circle is a closed curve lying in one plane, all points of which are equidistant from a fixed point. The fixed point called the center. A diameter of a circle is a line segment through the center of the circle with endpoints on the circle. Half of the diameter is called radius. The length of the circle is called circumference. 2.3 集合论的基本概念 (1)由小于 10 且能被 3 整除的正整数组成的集是整数集的子集。 The set consisting of those positive integers less than 10 which are divisible by 3 is a subset of the set of all integers. (2)如果方便,我们通过在括号中列举元素的办法来表示集。 When convenient, we shall designate sets by displaying the elements in braces. (3)用符号 表示集的包含关系,也就是说,式子 A B 表示 A 包含于 B。 The relation is referred to as set inclusion; AB means that A is contained in B. (4)命题 A B 并不排除 B A 的可能性。 The statement AB does not rule out the possibility that BA. (5)基础集可根据使用场合不同而改变。 The underlying set may vary from one application to another according to using occasions. (6)为了避免逻辑上的困难,我们必须把元素 x 与仅含有元素 x 的集{x}区别开来。 To avoid logical difficulties, we must distinguish between the element x and the set {x} whose only element is x. (7)图解法有助于将集合之间的关系形象化。 Diagrams often help using visualize relationship between sets. (8)定理的证明仅仅依赖于概念和已知的结论,而不依赖于图形。 The proofs of theorems rely only on the definitions of the concepts and known result, not on the diagrams. 2.4 整数、有理数与实数 整数 (1)严格说,这样描述整数是不完整的,因为我们并没有说明“依此类推”或“反复加 1” 的含义是什么。