NASACR-1998-208708 Properties of PZT-Based Piezoelectric Ceramics Between –150 and 250 o C
_Ni_P_TiO_2_ZnO_复合涂层的制备及其在天然海水中的耐蚀性
2.1 复 合 涂 层 表 面 形 貌 图1 为 碳 钢 表 面 Ni-P 及 (Ni-P)/(TiO2/ZnO)
复合涂层表面微 观 形 貌。 由 图 1 可 见,碳 钢 试 样 在 化学镀前表面有清 晰 划 痕,施 加 化 学 镀 后 划 痕 大 量 减少,表明 其 表 面 已 形 成 了 一 层 较 厚 的 保 护 涂 层。 已形成的 Ni-P 镀层表面光滑致密,化学镀过程中形
图2为 Ni-P 及 (Ni-P)/(TiO2/ZnO)复 合 涂 层 的 XRD 测试图谱。镀态 Ni-P 具有宽阔的馒头状弱 衍射峰,呈现典型的非 晶 结 构。Ni-P 镀 层 经 过 热 处 理后晶化明显,析出 镍 和 Ni3P 晶 体,并 随 热 处 理 温 度升高而晶化趋于完善。(Ni-P)/(TiO2/ZnO)复 合 涂层的热处理晶化行为及相组成与 Ni-P 镀层类似, 温度升高促使结晶 完 善,镀 层 的 预 先 热 处 理 与 否 并 未明显影响复合涂层的相组成。由于 TiO2/ZnO 复 合膜层厚度很薄,其在 Ni-P 表面的涂覆并未明显影 响复合 涂 层 的 结 晶 行 为,也 未 检 测 到 TiO2 或 者 ZnO 晶体的存在,这一 结 果 与 该 复 合 膜 层 涂 覆 在 碳 钢表面的 XRD 测试结果相一致。 2.3 电 化 学 极 化 曲 线
于 东 云 等 :(Ni-P)/(TiO2/ZnO)复 合 涂 层 的 制 备 及 其 在 天 然 海 水 中 的 耐 蚀 性 能
1 试 验
试验选用1cm×1cm×0.2cm 的 Q235碳钢, 试样表面用 砂 纸 逐 级 打 磨 至 1 200# ,丙 酮 清 洗、碱 洗(10%NaOH,质 量 分 数,5 min)、除 锈(10%HCl, 体积 分 数,30s)、超 声 活 化 (5% HCl,体 积 分 数, 30s),最后去离子水清洗。化学镀 的 镀 液 配 方 包 括 硫 酸 镍 、次 亚 磷 酸 钠 、醋 酸 钠 、柠 檬 酸 ,用 氨 水 调 节 镀 液 pH 至4.8,在80 ℃水浴中施镀 3h,在碳钢表面 形成 Ni-P 镀 层。 在 Ni-P 镀 层 表 面 通 过 溶 胶-凝 胶 技术制备 TiO2/ZnO 纳 米 膜 层:将 钛 酸 四 丁 酯 溶 入 无 水 乙 醇 ,室 温 下 搅 拌 并 逐 滴 加 入 水 、乙 酸 和 无 水 乙 醇的混合溶液,获 得 透 明 TiO2 溶 胶;将 乙 酸 锌 溶 入 无水乙醇,水浴加热 搅 拌 并 滴 入 二 乙 醇 胺 和 无 水 乙 醇 的 混 合 液 ,再 滴 加 适 量 水 和 无 水 乙 醇 混 合 溶 液 ,得 到透明 ZnO 溶胶;将 TiO2 溶胶 和 ZnO 溶 胶 按 体 积 比1∶1 混 合 并 搅 拌,获 得 TiO2/ZnO 复 合 溶 胶;将 Ni-P 涂层试样 浸 入 复 合 溶 胶 并 进 行 2 次 浸 渍 提 拉 以获得 TiO2/ZnO 复 合 薄 膜;对 浸 渍 样 品 进 行 热 处 理并 3 次重复上述涂覆操作以获得一定厚度的 TiO2/ZnO 复 合 薄 膜。 考 虑 到 热 处 理 温 度 高 低 及 Ni-P 涂层是否 预 先 热 处 理 可 能 会 对 复 合 涂 层 特 征 及性能产生影响,设计了两种方案:(1)在 Ni-P 表面 直接 制 备 TiO2/ZnO 复 合 薄 膜 并 进 行 350 ℃ 或 者 500 ℃ 的1h热 处 理,标 记 为 “Ni-P+TiO2/ZnO+ 350 ℃”,“Ni-P+TiO2/ZnO+500 ℃”;(2)对 Ni-P 镀层进行350 ℃或者 500 ℃ 预 先 热 处 理,然 后 再 涂 覆 TiO2/ZnO 并 进 行 相 应 热 处 理,标 记 为 “Ni-P+ 350 ℃ + TiO2/ZnO+350 ℃”,“Ni-P+500 ℃ + TiO2/ZnO+500 ℃”。对不同试样 进 行 编 号,详 见 表 1。对制备的复合涂 层 进 行 光 学 显 微 镜 和 扫 面 电 镜 的表面形 貌 观 察、能 谱 分 析、X 射 线 衍 射 仪 (XRD) 的相组成分析。采用 极 化 曲 线 和 阻 抗 谱 (EIS)测 试 (2mV·s-1,10mHz~100kHz)评 价 该 涂 层 在 天 然灭菌海水中的耐蚀性能。
SSPC-Paint 20
Editorial Revisions November 1, 2004
SSPC: The Society for Protective Coatings
PAINT SPECIFICATION NO. 20
Zinc-Rich Coating Type I – Inorganic and Type II – Organic
Paint 30
Weld-Through Inorganic Zinc
Primer
SP 1
Solvent Cleaning
SP 5/NACE No. 1 White Metal Blast Cleaning
PS Guide 12.00 Guide to Zinc-Rich Coating
Systems
* PS 12.01
One-Coat Zinc-Rich Painting
System
3.4 ASTM INTERNATIONAL STANDARDS:1
A 572 Standard Specification for High-Strength Low-Alloy Columbium-Vanadium Structural Steel
Level 1 — equal to or greater than 85% Level 2 — equal to or greater than 77% and less
than 85% Level 3 — equal to or greater than 65% and less
than 77%
1.5 This coating is intended for application by spray for use by itself or as a primer in a multi-coat system.
TPER
of the polymers were soluble in most common organic solvents even at room temperature, and some were soluble on heating. The degradation temperatures of the resultant polymers fell in the range of 260–500C in nitrogen (with only 10% weight loss). The specific heat capacity at 200C ranged from 1.0 to 2.21 J gÀ1 KÀ1. The temperatures at which the maximum degradation of the polymer occurred ranged from 510 to 610C. The glass-transition temperatures of the polyimides ranged from 182 to 191C. The activation energy and enthalpy of the polyimides ranged from 44.44 to 73.91 kJ/mol and from 42.58 to 72.08 kJ/mol K, respectively. The moisture absorption was found in the range of 0.23–0.71%. VC 2009 Wiley Periodicals, Inc. J Appl
1Department of Chemistry, Quaid-i-Azam University, Islamabad, Pakistan 45320 2Institut fu¨ r Anorganische Chemie, J. W. Goethe-Universita¨t Frankfurt, Max-Von-Laue-Strasse 7, Frankfurt/Main, Germany 60438 3Nescom, P.O. Box 2801, Islamabad, Pakistan
激光熔融技术
Journal of Materials Processing Technology 211(2011)750–758Contents lists available at ScienceDirectJournal of Materials ProcessingTechnologyj o u r n a l h o m e p a g e :w w w.e l s e v i e r.c o m /l o c a t e /j m a t p r o t ecPerformance of a cutting tool made of steel matrix surface nano-composite produced by in situ laser melt injection technologyO.Verezub a ,Z.Kálazi b ,A.Sytcheva c ,L.Kuzsella d ,G.Buza b ,N.V.Verezub e ,A.Fedorov f ,G.Kaptay g ,h ,∗aUni.Miskolc,Dep.Production Eng.,Egyetemvaros,3515Miskolc,HungarybBAY-ATI (RI for Materials Science and Engineering),Fehervari ut 130,Budapest,Hungary cBAY-NANO (RI for Nanotechnology),Dep.Nano-metrology,3515Miskolc,Egyetemvaros,E/7,Hungary dUni.Miskolc,Dep.Polimer Eng.,Egyetemvaros,3515Miskolc,Hungary eNational Technical University (“Kharkov Polytechnical Institute”),Frunze st.21,Dep.Integrated Technologies in Machine Building,Kharkov,Ukraine fARC -The Australian Reinforcing Company,518Ballarat Road,Sunshine,3020VIC,Melbourne,Australia gBAY-NANO (RI for Nanotechnology),Dep.Nano-composites and Uni.Miskolc,Egyetemvaros,E/7,3515Miskolc,Hungary hUniversity of Miskolc,Dep.Nanotechnology,Egyetemvaros,E/7,3515Miskolc,Hungarya r t i c l e i n f o Article history:Received 15May 2010Received in revised form 4December 2010Accepted 7December 2010Available online 15December 2010Keywords:Cutting toolMetal matrix nano-composite Laser processing Tool-lifea b s t r a c tSteel-matrix (105WCr6steel)surface nano-composites with (Ti,W)C micron-sized and (Fe,W)6C nano-sized carbide precipitates were produced by in situ laser melt injection technology with subsequent heat treatment.The microhardness of a 1mm thick nano-composite layer was found to be higher than that of the initial matrix.The machinability of the surface nano-composite by a cubic boron nitride (CBN)wheel was found lower,but still reasonable compared to the initial matrix.Cutting tools produced from our new nano-composite by the CBN wheel were found to have higher wear resistance,longer tool life and provided lower cutting forces against a C45steel workpiece compared to the initial matrix of the nano-composite.©2010Elsevier B.V.All rights reserved.1.IntroductionMaterial removal and machining processes play a key role in generating value-added activities to materials and machine parts since their introduction about 3centuries ago (Shaw,2005).Nev-ertheless,there is a constant interest in this field due to the high variety of newly developed materials (Biswas,2006)and superhard coatings (Veprek and Veprek-Heijman,2008)that can be used as cutting tools.The optimum combination of hard particles and duc-tile metallic matrices can lead to higher wear resistance.As this principle is widely recognized,particles reinforced metal matrix composites (MMCs)have been developed for cutting tools in a Al-matrix composites (Uday et al.,2009)and in steel matrix com-posites (Li et al.,2010).Among many requirements to cutting tools,cost is always at the top of the list.That is why this research was concentrated on the∗Corresponding author at:BAY-NANO (RI for Nanotechnology),Dep.Nano-composites and Uni.Miskolc,Egyetemvaros,E/7,3515Miskolc,Hungary.Tel.:+36304150002;fax:+3646362916.E-mail addresses:olga ver79@mail.ru (O.Verezub),kalazi@bzaka.hu (Z.Kálazi),kubaisy@mail.ru (A.Sytcheva),femkuzsy@uni-miskolc.hu(L.Kuzsella),buza@bzaka.hu (G.Buza),nikverezub@mail.ru (N.V.Verezub),FedorovA@.au (A.Fedorov),kaptay@ (G.Kaptay).cheapest possible steel matrix.To keep the cost of the cutting tool low,only the surface layer of the cutting tool will be improved,i.e.steel -matrix surface composites will be considered in this paper.It has been established by Iglesias et al.(2007)that the wear resistance of the composite increases with decreasing the size of the hard,reinforcing particles.That is why a special technology has been developed by Verezub et al.(2009)to ensure that the reinforc-ing particles are as small as ing smaller hard particles in the steel matrix of the cutting tool is expected to improve the performance of the cutting tool.There is a wide variety of reinforcing particles for the steel matrix.The most ‘popular’particles are TiC particles (Ala-Kleme et al.,2007)and WC particles embedded in the matrix of M2high-speed tool steels (Riabkina-Fishman et al.,2001)or in Ni–Cr matrix (St-Georges,2007).These particles are hard and thermodynami-cally stable.While TiC has superiority in both hardness (Kalpakjian,1995)and thermodynamic stability (Barin,1993)over WC,both of these particles are metallic in nature,and thus are well wettable by the steel matrix ensuring strong adhesion between the matrix and the reinforcing particles.This is essential to prevent reinforc-ing particles to turn out of the matrix without being worn,what is known to be one of the wear mechanisms of MMCs (Kaptay et al.,1997).In this respect WC is superior to TiC,as WC is perfectly wet-ted,while TiC is only moderately wetted by liquid steel as reviewed0924-0136/$–see front matter ©2010Elsevier B.V.All rights reserved.doi:10.1016/j.jmatprotec.2010.12.009O.Verezub et al./Journal of Materials Processing Technology211(2011)750–758751Table1Composition(in wt%)of the HVG steel(similar to105WCr6steel)(balance:Fe).C Mn Si S P Cu Cr Ni Al Ti Mo Nb W V O0.99 1.000.380.0140.0210.14 1.030.190.0280.0050.10.01 1.340.030.0056by Eustathopoulos et al.(1999)and shown theoretically by Kaptay (2005).Among the many possible technologies to produce steel matrix surface nano-composites,the laser melt injection(LMI)technology has been selected by the authors.This technology was developed 3decades ago by Ayers and Tucker(1980)to produce a surface composite layer.In this technique large(around100m)carbide particles are blown by a gas stream into a moving laser melted pool of a substrate metal.The method is superior to all coating technologies in providing perfect adhesion between the compos-ite and the substrate and also in providing large thickness(around 1mm)allowing to re-ground the cutting ter the LMI tech-nology has been proven to be efficient to produce WC particles reinforced steel matrix composites by Liu et al.(2008),using par-ticularly X40CrMoV5–1steel surface layer by Dobrzanski et al. (2005)and duplex stainless steels matrix by Do Nascimento et al. (2008).The combination of WC+Co particles was used by Bitay and Roósz(2006).TiC particles were added into liquid steel by Fábián et al.(2003).The drawback of LMI technology is that only large carbide par-ticles with a sufficiently large kinetic energy can break the high surface tension liquid metal/gas interface,as was proven for liq-uid steel by Farias and Irons(1985)and for liquid aluminum by Vreeling et al.(2000).This is especially true for low-density TiC particles(compared to the density of liquid steel)that are not‘per-fectly’wetted by liquid steel as shown by Verezub et al.(2005). In fact,incorporation problems for the TiC/liquid steel couple was mentioned in the veryfirst paper by Ayers and Tucker(1980)and was later confirmed by Králik et al.(2003).Thus,the steel rein-forcing matrix,the TiC particles,the LMI technique and the desire to produce surface nano-composite seem to be contradictory.To solve this problem,an in situ LMI technology was developed by Verezub et al.(2009)to produce steel matrix carbide reinforced surface nano-composites.The in situ production route of steel-matrix TiC reinforced composites has been known since the work by Terry and Chinyamakobvu(1991).This method has been developed further by using reaction casting by Feng et al.(2005)and high-energy electron beam irradiation by Lee et al.(2006).The method was extended to produce Fe/(TiW)C composite powder by Correa et al. (2007).Good tribological behaviour of TiC–ferrous matrix com-posites was shown by Kattamis and Suganuma(1990).The Fe/TiC composites were found to have excellent wear properties by Galgali et al.(1999),confirmed also for elevated temperatures by Degnan et al.(2001).The samefinding was extended by Dogan et al.(2001) for cast chromium steels reinforced by TiC particles.Nevertheless, the in situ production of Fe/TiC composites and the LMI technology was combined for thefirst time by Verezub et al.(2009).The goal of the present paper is to evaluate the machinability(upon producing a cutting tool from it)and also the performance as a cutting tool of a steel matrix(TiW)C reinforced surface nano-composite produced on a cheap steel matrix by the in situ LMI process.2.Materials and methods2.1.MaterialsLow-alloyed tool steel plates of grade HVG(Russian GOST5950-73,1973being the analogue of steel105WCr6)have been selected as a base material for the current research.Detailed chemical com-position of the HVG substrate is given in Table1.The initial size of the substrates was8mm×8mm×4mm.Additionally,tungsten carbide and metallic titanium powders of chemical purity,both with a particle size of45–70m were used.These two powders were mixed at a1:1molar ratio.This molar ratio was chosen as the most stable carbides in the Ti–W–C system are the TiC and WC car-bides,and in this way the exchange reaction Ti+WC=W+TiC can be ensured between them.Of-course,the C-content of the original steel will also play some role(see below).2.2.Production of the nano-compositesSchematic diagram of LMI-equipment used in the current study is shown in Fig.1.The upper8mm×8mm plane of the HVG sub-strate was coated by a thin layer of graphite to increase laser beam absorption efficiency during the LMI process.The other side of the steel substrate was brazed onto a large,water-cooled Cu-plate to ensure fast cooling of the substrate.The top surface of the substrate was melted by a2.5kW CO2continuous wave laser(type Trumph TLC105),with a laser spot of2mm in diameter.The laser spot was moving along the sample with a scanning speed of400mm/min. The(WC+Ti)powder mixture was blown into the melted pool at an angle of45◦using argon as carrier gas.The following three pow-der feeding rates were used during our experiments:1.3g/min, 2.3g/min and3.8g/min.Several laser tracks were drawn parallel to each other with a50%overlapping.After the LMI process,the rapidly cooled samples were heat treated under the following conditions:austenitizing at a tempera-ture of1000–1050◦C during10–15s in a high frequency induction furnace,followed by rapid cooling and tempering at a temperature of350◦C for1h.The second round of tempering was performed during1h at560◦C.For reasons of more correct comparison,the initial HVG samples were heat treated under usual conditions (hardening at840◦C and tempering at170◦C).The samples were grinded,polished,etched and analyzed uti-lizing special techniques.The microstructure of the substrates was observed using an AMRAY1810i SEM(Scanning Electron Microscopy with micro resolution),equipped with EDS(Energy Dispersive X-ray Spectroscopy).The identification of nano-sized particles was performed by a high resolution SEM(HitachiS-4800,Fig.1.The schematic diagram of the laser melt injection(LMI)equipment(1–laser, 2–powder nozzle,3–steel substrate to be treated,4–copper cooling plate,5–working table,6–cooling water input and output).752O.Verezub et al./Journal of Materials Processing Technology211(2011)750–758Japan).Quantitative analysis of the samples was performed by ImageJ software.In different parts of the paper the following short sample names are used:i.“LMI”is the sample produced here by the LMI procedure includ-ing heat treatment.ii.“HVG”is the original HVG sample(see Table1)heat treated as described above.iii.“HSS”is a commercially available high speed steel sample with 6%W+5%Mo.2.3.Microhardness measurement of the nano-compositeThe microhardness profiles were measured using TUKON2100B equipment(Wilson Instr.)using load of500g and time of pressing of10s.The samples were polished and etched before the micro-hardness measurements.Microhardness was scanned along two lines:(i)perpendicular to the surface,as function of depth,and(ii) parallel along the surface,at the depth of0.40mm.2.4.Machinability of the nano-composite by cubic BN wheelA cubic boron nitride(CBN)grindingflaring cup wheel of type L010(125/100)–100%–B1–58(Russian standard)which cor-responds to grinding wheel B120C100vitrified bond(Stephenson and Agapiou,2006)was used to remove small quantities of the sur-face composite material to produce the required shape and surface quality for the cutting tool insert.Additionally,the grinding ratio of the CBN wheel was studied by removing the same thickness of 1mm from each substrate(HVG,LMI,HSS).The grinding ratio G,is defined as the ratio of worn mass of the grinding wheel(mg)to the mass of the removed material(g).The CBN wheel was studied by SEM+EDS after the grinding experiments.2.5.Performance of a cutting tool made of LMI nano-composite materialSteel C45(0.45%C+0.6%Mn+0.25%Si)was used as a workpiece for the cutting experiments.Machining of the steel C45workpiece was performed by the HVG,LMI and HSS cutting tools.All the exper-iments were run with the following cutting conditions:cutting speed V=20–60m/min,feed f=0.05–0.3mm/rev and depth of cut d=0.25–1.75mm.The cutting force components were measured by a piezoelectric dynamometer(Kistler).SEM and EDS analysis of the cutting tool and the removed chips were applied after the cutting experiments.3.Results and discussion3.1.Structure and composition of the nano-compositeFig.2shows SEM pictures of cross section of the characteristic LMI sample.Fig.2a shows that the depth of the surface composite layer is approximately1mm.Due to multiple scanning by the laser beam,the depth of the melted layer shows a certain pattern in Fig.2a,with minima in the depth separated by a distance of about 1mm(what is half of the2mm laser spot diameter due to50% of overlapping).As one can see from Fig.2,the microstructure of the melted layer seems to be macroscopically homogeneous.This is due to the high velocity of Marangoni convection of the laser melted pool during the LMI process.Fig.3shows enlarged SEM pictures of the LMI sample with two types of precipitates.The several micron sized(Ti,W)C carbide pre-cipitates(Fig.3a)formed during fast cooling at the latest stage ofthe Fig.2.SEM pictures of the cross sections of the steel substrate after the LMI treat-ment(a)and the general view of the microstructure within the laser treated zone (b)(powder feeding rate is2.3g/min).LMI process by in situ precipitation from the molten steel matrix. The core of these precipitates is rich in Ti,while the outer region of the precipitates is rich in W.This is so due to higher thermodynamic stability of TiC compared to WC.The second type of precipitates is below100nm in diameter and is formed only during the subse-quent heat treatment.These nano-particles are(Fe,W)6C carbides (Fig.3a and b),precipitating from the supersaturated solid steel matrix(for more details see Verezub et al.,2009).The volume%of micron sized(Ti,W)C particles are shown in Fig.4as function of the powder feeding rate.The theoretical maximum,shown in Fig.4was calculated from the technologi-cal parameters and from the cross section of the melted zone(see Fig.2a).One can see that in the as-received LMI samples the amount of incorporated(Ti,W)C particles is somewhat lower compared to the theoretical maximum.The incorporation ratio decreases from 89%(for1.3g/min)to76%(for3.8g/m)with increasing the pow-der feeding rate.It is probably due to the gradual increase in the effective viscosity of the suspension with increasing its solid con-tent,what makes further incorporation and dissolution of(Ti+WC) particles more difficult.During heat treatment of the LMI samples, the volume%of micron-sized(Ti,W)C particles is decreased further by about20%.This is due to the partial dissolution of the W-rich outer region of the micron-sized(Ti,W)C precipitates.The amount of nano-sized(Fe,W)6C particles is found around25±5vol%,being independent of the powder feeding rate.These nano-sized particles form during the heat treatment,from the over-saturated matrix and partially from the dissolved outer regions of the micron-sized precipitates.As follows from materials balance,the majority of the content of these(Fe,W)6C nano-particles originate from the mate-rial of the matrix.Further investigation is needed to clarify howO.Verezub et al./Journal of Materials Processing Technology 211(2011)750–758753Fig.3.SEM micrographs of the cross section of the LMI sample in two different magnifications (powder feeding rate is 2.3g/min).the conditions of heat treatment influence the micro-and nano-structure of the composite and the amount and size distribution of (Fe,W)6C particles.It should be mentioned that at the highest powder feeding rate of 3.8g/min the LMI samples appeared to be cracked.This is probably due to the too high volume %of the carbide phase in the matrix.The two other samples (produced at the powder feeding rates of 1.3and 2.3g/min)are free of cracks.The latter is more promising as the higher amount of carbide phase leads to improved mechanical properties of the composite,if the formation of cracks is avoided.3.2.Microhardness of the LMI nano-composite sampleThe depth profile of microhardness of the LMI nano-composite sample with powder feeding rate of 2.3g/min is shown in Fig.5.All measurements are made after the heat treatment described in the experimental part.The depth profile can be divided into three regions:010*******12345powder feeding rate, g/min(T i ,W )C , v o l %Fig.4.The volume %of the micron-sized (Ti,W)C particles as function of powder feeding rate after the LMI process (before and after the heat treatment procedure).020040060080010001200140000.51 1.52M i c r o h a r d n e s s , HVDistance from surface, mmFig.5.Depth profile of microhardness of the LMI nano-composites (powder feeding rate is 2.3g/min).i.The upper surface layer of about 500m thickness has a highest microhardness of about 1200HV.ii.The initial substrate (below 1mm from the top surface)has a lowest microhardness of about 1000HV.iii.There is a transition zone between 500and 1000m measuredfrom the top surface,within which the microhardness gradually changes between the above mentioned limits.In evaluation of these results let us remind that carbon can diffuse from the non-melted part of the substrate into the melted LMI part of the substrate during the heat treatment.The increased microhardness of the upper surface layer of LMI nano-composite sample is obviously due to the precipitated micron-sized (Ti,W)C and nano-sized (Fe,W)6C hard carbide par-ticles.The existence of the intermediate zone could be due to the interplay between solidification rate (solidification goes from the bottom of the melted zone upwards)and the feeding and mixing rates of the added powder mixture (powder mixture is added to the top and the incorporated particles together with the dissolved atoms move downwards mainly by the Marangoni convection).In Fig.6a the measured microhardness is shown parallel along the sample surface,at the depth of about 0.4mm for both the as received LMI sample and the heat treated LMI sample.One can see that the microhardness of the LMI samples increase due to the heat treatment,what is probably due to the formation of (Fe,W)6C02004006008001000120014000.511.522.53M i c r o h a r d n e s s , H VDistance, mm00.20.40.60.8100.511.52 2.53d e p t h , m mdistance, mmFig.6.Microhardness scanned parallel along the surface,at the depth of about 0.4mm for both as received LMI sample and the heat treated LMI sample (a)and the depth of the melted pool as function of the same path (b)(see the pattern in Fig.2a).754O.Verezub et al./Journal of Materials Processing Technology 211(2011)750–7580.0340f , m m /p a s sv f ,/m i nFig.7.The grinding ratio of the LMI nano-composite sample (powder feeding rate is 2.3g/min,V =25m/s).nanoparticles.It is also obvious that the heat treatment flatters out the large fluctuations in the microhardness of the as received LMI sample.The minima in the microhardness fluctuations (Fig.6a)approximately coincide with the minima in the depth of the melted zone (see Fig.6b and the pattern in Fig.2a).This can be explained by Fig.5,measured at the largest depth of the melted zone.The smaller is the depth of the melted zone,the higher becomes the relative depth of the same absolute depth of 0.4mm,and thus,in accordance with Fig.5,the smaller is the microhardness.As follows from Figs.5–6,the microhardness of the produced nano-composite layer is around 12GPa.For this value the optimum grinding wheel and the optimum workpiece to be machined should be selected such that the ratio of microhardnesses of the machining and that of the to be machined materials should be at least 3.As a machining tool,CBN (cubic boron-nitride)has been selected with its microhardness of about 50GPa (Kalpakjian,1995)being about 4.2times stronger compared to the hardness of our LMI sample.On the other hand,the C45workpiece has been selected with its microhardness of about 2.7GPa,being about 4.4times less strong compared to our LMI sample.Thus,the microhardness of our LMI nano-composite sample is positioned almost in the middle (in a logarithmic scale)of the interval between the microhardness val-ues of the machining CBN tool and that of the to be machined C45workpiece.3.3.Machinability of the LMI nano-composite by cubic BN wheel During the LMI treatment the surface of the substrate melts,and thus it becomes quite uneven after solidification (the subsequent heat treatment does not provide any significant improvement).As a result,the as-received LMI nano-composite sample cannot be used as a cutting tool.Therefore,the as-received LMI nano-composite sample was grinded by a CBN wheel to obtain the shape and surface quality required for cutting tools.Fig.7shows the grinding ratio of the LMI nano-composite sam-ple as function of the feed rate of the workpiece (v f ,m/min)and a feed (f ,mm/pass).The combination of a feed of f =0.04m/pass and a feed rate of v f =3m/min leads to a maximum grinding ratio of about G =45–50mg/g.Based on the results shown in Fig.7,the optimal grinding conditions are selected as:f =0.01–0.02mm/pass,v f =1–2m/min and V =25m/s.Under these conditions the grinding ratio can be kept at a reasonable level of G =8–15mg/g.In compari-son,under the same conditions the grinding ratio for the HVG steel was found to be 6.8mg/g,while the grinding ratio for HSS is known to be about 5–6mg/g (Lisanov,1978).The increased grinding ratio of our LMI sample is obviously due to the hard (Ti,W)C and (Fe,W)6C particles in the surface of newly developed material.Fig.8.The EDS spectra of CBN wheels after grinding HVG (a)and LMI (b)samples (powder feeding rate is 2.3g/min).In Fig.8the energy dispersive X-ray spectra of two CBN wheels are compared after identical grinding runs of the HVG and LMI samples.In addition to the C-and Fe-peaks after grinding the HVG sample,large W and Ti peaks are observed after grinding the LMI nano-composite sample.This can be explained by stabilisation of the C-content of the initial steel substrate by added Ti and by the attraction between (Ti,W)and (B,N)atoms,respectively,being due to the existence of stable titanium boride,titanium nitride and tungsten boride compounds as reported by Barin (1993).Thus,dur-ing the grinding process part of the Ti-and W-content of the LMI nano-composite substrate adheres to the CBN surface.The pres-ence of solid titanium and tungsten carbides causes loosening of the CBN grains and their fallout,leading to intensive wear of the wheel,also shown by Klimenko et al.(1996).Forming the rake and flank surfaces during grinding of the LMI nano-composite samples resembles the grinding of high-speed steel cutting tools as shown by Mamalis et al.(2002).When the high quality alloyed layer is achieved,cutting edge without visible chip-ping is obtained.At the same time the edge roughness,as well as the radius of the cutting edge are higher for the HVG substrate com-pared to the LMI nano-composite substrate (Table 2).Increase of the feed rate and that of the feed lead to further increase in roughness of the tool’s cutting edge.Table 2Roughness of tool’s cutting edge and surfaces after grinding by CBN wheels (param-eters:V =25m/s,v f =2m/min,f =0.01mm/pass).Tool material Cutting edgeroughness R a ,m Roughness of rake and flank surfaces R a ,m HSS 1.2–1.30.15–0.18LMI 1.3–1.50.17–0.20HVG1.4–1.60.21–0.24O.Verezub et al./Journal of Materials Processing Technology 211(2011)750–75875500,10,20,30,40,5050100150200machining time, minV B , m mFig.9.The influence of machining time on flank wear for different cutting tool materials (V =25m/min,f =0.1mm/rev,d =0.5mm).Curves correspond to the HVG steel,LMI nano-composite produced with different powder feeding rates (figures on curves correspond to the unit of g/min),and HSS.Overall it can be concluded that CBN wheels can be used with optimum grinding parameters of f =0.01–0.02mm/pass,v f =1–2m/min and V =25m/s to convert the as-received LMI nano-composite into the cutting tool.The required shape and roughness of the cutting tool can be obtained with a reasonable grinding ratio of about G =8–15mg/g.3.4.Tool life of the cutting tool made of our nano-composite During testing of a new LMI nano-composite cutting tool on C45workpiece,crater wear was found to be negligible compared to flank wear.These two types of wear are the most common measured forms of tool wear.Thus,the tool life of this newLMI2040608010012014016018001234powder feeding rate, g/mint o o l l i f e , m i nFig.10.Tool life as function of the powder feeding rate during the LMI process (V =25m/min,f =0.1mm/rev,d =0.5mm)(the point at zero feeding rate refers to a different heat history of a sample,that is why this point is connected to other points by a thin line).nano-composite cutting tool is determined from the measured flank wear.Fig.9shows flank wear measurements for HVG steel used as a base material,LMI nano-composite produced with different pow-der feeding rates and HSS.The critical flank wear of 0.45mm was chosen based on values recommended for replacing or re-grounding alloyed tool materials (Kalpakjian,1995).The machining time during which the actual flank wear achieves the critical value is called tool life (T ,min).Tool life as function of the powder feeding rate is shown in Fig.10.It shows that an optimum value of the powder feeding rate exists for the maximum tool life.When Fig.10is rationalized in combination with Fig.4,it can be seenthat the volume %of carbide particles in the compositeFig.11.SEM images of the cutting tool made of the LMI sample after its service (a–c)and EDS spectrum (d)of the worn surface.756O.Verezub et al./Journal of Materials Processing Technology211(2011)750–758Fig.12.Removed chip from steel C45by the LMI cutting tool(a)and its EDS spec-trum(b).gradually increases with the increase of powder feeding rate and,as a consequence,tool life also increases.However,as was mentioned above,cracks were formed in the substrate,made by the powder feeding rate of3.8g/min.As a result,a cutting tool made of this substrate has a lower tool life.One can suppose that there is an optimum feeding rate in the interval between2.3and3.8g/min, when the volume%of carbide particles is somewhat larger than for the2.3g/min feeding rate,but still without crack formation.The SEM images of the LMI nano-composite cutting tool faces after machining of C45steel are shown in Fig.11.Fig.11a shows the overlapping of the LMI tracks and the traces of theflank wear(mea-sured as0.45mm).In Fig.11b–c carbide particles being similar to those shown in Figs.2–3are shown.The difference is that the steel matrix is worn away in between the hard carbide particles after machining compared to the initial state of the LMI nano-composite substrate(compare Fig.11b–c to Figs.2–3).Therefore,it is evident that theflank wear is the result of abrasive wear of the LMI cutting tool.The EDS spectrum(Fig.11d)of the worn surface shows Fe,Ti, W as basic components.In Fig.12the SEM picture and EDS spectrum of the removed chip from the C45workpiece is shown,after its machining by the LMI nano-composite cutting tool.It can be seen that the removed chip is continuous,and the main elements of the nano-composite (Ti and W)are missing from its X-ray spectrum.Thus,there was no adhesion of Ti and/or W to the C45steel workpiece during its machining by the LMI nano-composite cutting tool.In order to position our cutting tool made of the LMI substrate on a tool-life scale,tool-life tests have been conducted.The effect of cutting speed V on tool-life T has been assessed using Taylor’s tool life equation(Eq.(1))(Taylor,1907)and the results are shown Table3Experimental tool life(T,min)of different cutting tool materials against C45work-piece(f=0.1mm/rev and d=0.5mm).V,m/min T,min(experimental)HVG LMI HSS20385500535 2550160190 30157088 3542550 40–1726 45–715 50–47 60–24in Table3.C1=V·T n(1) Eq.(1)is widely used and recognized in the industry.It relates tool life to the cutting speed through empirical tool life constants n and C1.Table4shows the range of values n and C1for different cutting tool materials obtained from the data in Table3.The data(Table4)indicate that the LMI process of inserting (TiW)C particles into HVG substrate improved tool life of the base material by300–400%when cutting speed V was25–35m/min. However,this new material was felt short to surpass tool life of HSS cutting material by just20%in the same cutting speed range.No sig-nificant difference between tool life of HSS and LMI was observed during machining at20m/min.Performance of cutting tools made of LMI nano-composite is similar to the performance of HSS and is limited by wear resistance at cutting speeds above40–45m/min (Stephenson and Agapiou,2006).Cutting tools made of HVG steel can be used at speeds up to30m/min.3.5.Cutting force componentsDuring machining of the C45workpieces by the cutting tool made of HVG and LMI substrates,the two main force components F z (N)and F x(N)have been measured as function of the depth of cut d (mm)and feed f(mm/rev).The effects of depth of cut and feed on the measured F z and F x force components for the two different cutting materials(HVG and LMI nano-composite)are shown in Figs.13–14. The cutting speed increase within limits of V c=20–60m/min does not sufficiently influence the value of the cutting force(Fedorov, 2005)and therefore has not been tested in this paper.The effect of depth of cut d on the measured force components for two different cutting tool materials is shown in Fig.13a and b. Forces F z and F x increase with the increase in depth of cut because the increase in depth of cut leads to increase in the area of cut and length of the cutting edge in contact.The influence of feed f on the forces F z and F x is shown in Fig.14a and b.The increases in feed lead to increase in cut thickness,which,in turn,increases the area of cut and as a consequence,the force components.Figs.13–14show that machining with LMI nano-composite cut-ting tool material decreases cutting forces F z and F x in comparison with HVG cutting tool material.However,significant force reduc-tions can only be observed when depth of cut is greater than1mm and feed is greater than0.2mm/rev.The force components can be described as function of parameters d and f by the followingTable4Values of n and C1for different tool materials(f=0.1mm/rev,d=0.5mm).Cutting tool material n C1HSS0.2280.89 LMI0.1967.18 HVG0.1241.58。
Journal of Environmental Chemical Engineering

Characterization of nano zero-valent iron (nZVI) and its application in sono-Fenton process to remove COD in palm oil mill effluent
M.R. Taha a, A.H. Ibrahim b,*
This present study highlights the characterization of the nZVI particle and examines the effects of pH, ultrasound intensity (%), and ultrasound duration on the nZVI particle to produce Fe2+. Tests have also been conducted to analyze the application of the nZVI particle as a replacement for FeSO4 in the sono-Fenton process to remove chemical oxygen demand (COD) particularly in palm oil mill effluent (POME).
Journal of Environmental Chemical Engineering 2 (2014) 1–8
Contents lists available at ScienceDirect
Journal of Environmental Chemical Engineering
journal homepage: /locate/jece
The combination of ultrasound with the Fenton process (sono-
2014-ACS Appl. Mater. Interfaces-酚变醌
■
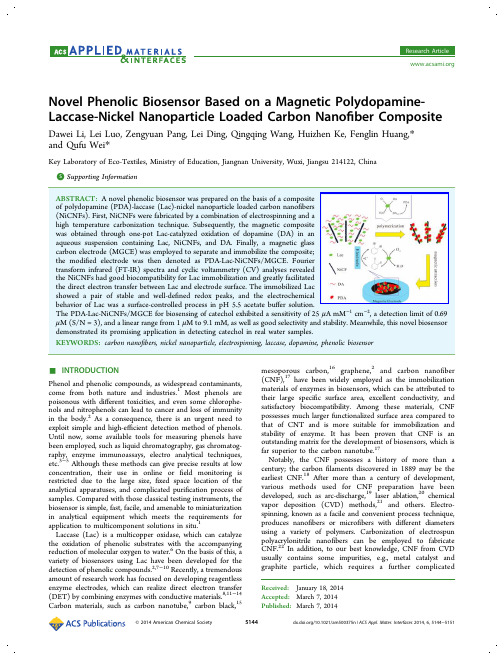
mesoporous carbon,16 graphene,2 and carbon nanofiber (CNF),17 have been widely employed as the immobilization materials of enzymes in biosensors, which can be attributed to their large specific surface area, excellent conductivity, and satisfactory biocompatibility. Among these materials, CNF possesses much larger functionalized surface area compared to that of CNT and is more suitable for immobilization and stability of enzyme. It has been proven that CNF is an outstanding matrix for the development of biosensors, which is far superior to the carbon nanotube.17 Notably, the CNF possesses a history of more than a century; the carbon filaments discovered in 1889 may be the earliest CNF.18 After more than a century of development, various methods used for CNF preparation have been developed, such as arc-discharge,19 laser ablation,20 chemical vapor deposition (CVD) methods,21 and others. Electrospinning, known as a facile and convenient process technique, produces nanofibers or microfibers with different diameters using a variety of polymers. Carbonization of electrospun polyacrylonitrile nanofibers can be employed to fabricate CNF.22 In addition, to our best knowledge, CNF from CVD usually contains some impurities, e.g., metal catalyst and graphite particle, which requires a further complicated
材料类 SCI(EI)收录的科技期刊及其网址
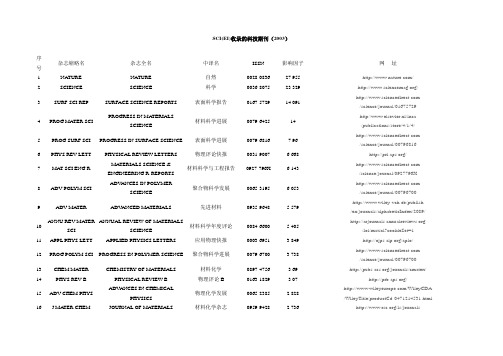
SCI(EI)收录的科技期刊(2003)序号杂志缩略名杂志全名中译名ISSN影响因子网址1NATURE NATURE自然0028-083627.955/ 2SCIENCE SCIENCE科学0036-807523.329/3SURF SCI REP SURFACE SCIENCE REPORTS表面科学报告0167-572914.091 /science/journal/016757294PROG MA TER SCI PROGRESS IN MA TERIALSSCIENCE材料科学进展0079-642514http//www.elsevier.nl/inca/publications/store/4/1/4/5PROG SURF SCI PROGRESS IN SURFACE SCIENCE表面科学进展0079-68167.96 /science/journal/007968166PHYS REV LETT PHYSICAL REVIEW LETTERS物理评论快报0031-9007 6.668/7MA T SCI ENG RMA TERIALS SCIENCE &ENGINEERING R-REPORTS材料科学与工程报告0927-796X 6.143/science/journal/0927796X8ADV POL YM SCI ADVANCES IN POLYMERSCIENCE聚合物科学发展0065-3195 6.053/science/journal/007967009ADV MA TER ADVANCED MATERIALS先进材料0935-9648 5.579http://www.wiley-vch.de/publish /en/journals/alphabeticIndex/2089/10ANNU REV MA TERSCIANNUAL REVIEW OF MA TERIALSSCIENCE材料科学年度评论0084-6600 5.405/loi/matsci?cookieSet=111APPL PHYS LETT APPLIED PHYSICS LETTERS应用物理快报0003-6951 3.849/aplo/12PROG POL YM SCI PROGRESS IN POL YMER SCIENCE聚合物科学进展0079-6700 3.738 /science/journal/0079670013CHEM MA TER CHEMISTRY OF MA TERIALS材料化学0897-4756 3.69/journals/cmatex/ 14PHYS REV B PHYSICAL REVIEW B物理评论B0163-1829 3.07/15ADV CHEM PHYS ADVANCES IN CHEMICALPHYSICS物理化学发展0065-2385 2.828/WileyCDA/WileyTitle/productCd-0471214531.html16J MA TER CHEM JOURNAL OF MATERIALS 材料化学杂志0959-9428 2.736/is/journalsCHEMISTRY/current/jmc/mappub.htm17ACTA MATER ACTA MATERIALIA材料学报1359-6454 2.658http://www.elsevier.nl/locate/actamat/18MRS BULL MRS BULLETIN 材料研究学会(美国)公告0883-7694 2.606/publications/bulletin/19BIOMATERIALS BIOMATERIALS生物材料0142-9612 2.489/20CARBON CARBON碳0008-6223 2.34/inca /publications/store/2/5/8/21SURF SCI SURFACE SCIENCE表面科学0039-6028 2.189 /science/journal/0169433222J APPL PHYS JOURNAL OF APPLIED PHYSICS应用物理杂志0021-8979 2.128/japo/23CHEM V APOR DEPOS CHEMICAL V APOR DEPOSITION化学气相沉积0948-1907 2.123http://www.wiley-vch.de/publish/dt/24J BIOMED MA TERRESJOURNAL OF BIOMEDICALMA TERIALS RESEARCH生物医学材料研究0021-9304 2.105/cgi-bin/jhome/3072825IEEE J QUANTUMELECTIEEE JOURNAL OF QUANTUMELECTRONICSIEEE量子电子学杂志0018-9197 2.086/xpl/RecentIssue.jsp?puNumber=326CURR OPIN SOLID STMCURRENT OPINION IN SOLIDSTATE & MATERIALS SCIENCE固态和材料科学的动态1359-0286 1.92/science/journal/1359028627DIAM RELAT MATER DIAMOND AND RELATEDMA TERIALS金刚石及相关材料0925-9635 1.902/science/journal/0925963528ULTRAMICROSCOPY ULTRAMICROSCOPY超显微术0304-3991 1.89 /science/journal/0304399129EUR PHYS J B EUROPEAN PHYSICAL JOURNALB欧洲物理杂志B1434-6028 1.811/app/home/main.asp30J AM CERAM SOC JOURNAL OF THE AMERICANCERAMIC SOCIETY美国陶瓷学会杂志0002-7820 1.748/31APPL PHYS A-MA TER APPLIED PHYSICS A-MATERIALSSCIENCE & PROCESSING应用物理A-材料科学和进展0947-8396 1.722/app/home/journal.asp32NANOTECHNOLOGY NANOTECHNOLOGY纳米技术0957-4484 1.621/jnn/33J V AC SCI TECHNOLBJOURNAL OF V ACUUM SCIENCE& TECHNOLOGY B真空科学与技术杂志B1071-1023 1.549/jvstb/34J MA TER RES JOURNAL OF MATERIALSRESEARCH材料研究杂志0884-2914 1.539/publications/jmr/35PHILOS MAG APHILOSOPHICAL MAGAZINEA-PHYSICS OF CONDENSEDMA TTER STRUCTURE DEFECTSAND MECHANICAL PROPERTIES哲学杂志A凝聚态物质结构缺陷和机械性能物理0141-8610 1.532http///journals/36INT J NON-EQUILIBPRINTERNATIONAL JOURNAL OFNON-EQUILIBRIUM PROCESSING非平衡加工技术国际杂志1368-9290 1.5http://www.ifw-dresden.de/biblio/zsbestand/izs.htm37J NEW MA T ELECTRSYSJOURNAL OF NEW MATERIALSFOR ELECTROCHEMICALSYSTEMS电化学系统新材料杂志1480-2422 1.478http://www.newmaterials.polymtl.ca/38J V AC SCI TECHNOLAJOURNAL OF V ACUUM SCIENCE& TECHNOLOGY A-VACUUMSURFACES AND FILMS真空科学与技术A真空表面和薄膜0734-2101 1.448/refs/jvsta/Default.html39DENT MATER DENTAL MATERIALS牙齿材料0109-5641 1.441 /science/journal/0109564140J ELECTRON MATER JOURNAL OF ELECTRONICMA TERIALS电子材料杂志0361-5235 1.382/pubs/journals/JEM/jem.html41J NUCL MA TER JOURNAL OF NUCLEARMA TERIALS核材料杂志0022-3115 1.366/science/journal/0022311542INT MATER REV INTERNATIONAL MATERIALSREVIEWS国际材料评论0950-6608 1.364/journals/browse/maney/imr43J NON-CRYSTSOLIDSJOURNAL OF NON-CRYSTALLINESOLIDS非晶固体杂志0022-3093 1.363/science/journal/0022309344J MAGN MAGNMA TERJOURNAL OF MAGNETISM ANDMAGNETIC MATERIALS磁学与磁性材料杂志0304-8853 1.329/science/journal/0304885345OPT MA TER OPTICAL MATERIALS光学材料0925-3467 1.299 /science/journal/0925346746IEEE T APPLSUPERCONIEEE TRANSACTIONS ONAPPLIED SUPERCONDUCTIVITYIEEE应用超导性会刊1051-8223 1.278/xpl/RecentIssue.jsp?puNumber=7747METALL MA TERTRANS AMETALLURGICAL ANDMA TERIALS TRANSACTIONSA-PHYSICAL METALLURGY ANDMA TERIAL冶金与材料会刊A——物理冶金和材料1073-5623 1.273http///journals/MT//48THIN SOLID FILMS THIN SOLID FILMS固体薄膜0040-6090 1.266 /science/journal/0040609049J PHYS D APPL PHYS JOURNAL OF PHYSICS D-APPLIEDPHYSICS物理杂志D——应用物理0022-3727 1.26/EJ/journal/0022-372750INTERMETALLICS INTERMETALLICS金属间化合物0966-9795 1.239 /science/journal/0966979551PHILOS MAG B PHILOSOPHICAL MAGAZINEB-PHYSICS OF CONDENSEDMA TTER STATISTICALMECHANICS哲学杂志B-凝聚态物质统计力学0141-8637 1.238http///journals/default.html52SURF COA T TECH SURFACE & COATINGSTECHNOLOGY表面与涂层技术0257-8972 1.236/science/journal/0257897253J BIOMA TSCI-POL YM EJOURNAL OF BIOMATERIALSSCIENCE-POL YMER EDITION生物材料科学—聚合物版0920-5063 1.234/journals/jn-JouBioSciPolEdi.html54MA TER RES INNOV MA TERIALS RESEARCHINNOV ATIONS材料研究创新1432-8917 1.23/app/home/journal.asp55BIOMETALS BIOMETALS生物金属0966-0844 1.229 /issn/0966-0844/contents56INT J PLASTICITY INTERNATIONAL JOURNAL OFPLASTICITY塑性国际杂志0749-6419 1.212/science/journal/0749641957SMART MATERSTRUCTSMART MATERIALS &STRUCTURES智能材料与结构0964-1726 1.199/EJ/journal/0964-172658ADV IMAG ELECTPHYSADVANCES IN IMAGING ANDELECTRON PHYSICS成像和电子物理发展1076-5670 1.188/serials/imaging/59SYNTHETIC MET SYNTHETIC METALS合成金属0379-6779 1.158 /science/journal/0379677960J MA TER SCI-MATERMJOURNAL OF MATERIALSSCIENCE-MA TERIALS INMEDICINE材料科学杂志—医用材料0957-4530 1.144/issn/0957-4530/contents61SCRIPTA MA TER SCRIPTA MA TERIALIA材料快报1359-6462 1.13 /science/journal/1359646262COMPOS PARTA-APPL SCOMPOSITES PART A-APPLIEDSCIENCE AND MANUFACTURING复合材料A应用科学与制备1359-835X 1.128/science/journal/1359835X63MOD PHYS LETT A MODERN PHYSICS LETTERS A现代物理快报A0217-7323 1.119 /mpla/mpla.shtml64SEMICOND SCI TECH SEMICONDUCTOR SCIENCE ANDTECHNOLOGY半导体科学与技术0268-1242 1.079/EJ/journal/0268-124265J EUR CERAM SOC JOURNAL OF THE EUROPEANCERAMIC SOCIETY欧洲陶瓷学会杂志0955-2219 1.071/science/journal/0955221966APPL SURF SCI APPLIED SURFACE SCIENCE应用表面科学0169-4332 1.068 /science/journal/0169433267MA TER T JIM MA TERIALS TRANSACTIONS JIM 日本金属学会材料会刊0916-1821 1.056http//www.sendai.kopas.co.jp/METAL/PUBS/68PHYS STATUS SOLIDIAPHYSICA STATUS SOLIDIA-APPLIED RESEARCH固态物理A——应用研究0031-8965 1.025/cgi-bin/jhome/4000076169MA T SCI ENGB-SOLIDMA TERIALS SCIENCE ANDENGINEERING B-SOLID STATEMA TERIALS FOR ADVANCEDTECH材料科学与工程B—先进技术用固体材料0921-5107 1.022/refs/mseb/Default.html70CORROS SCI CORROSION SCIENCE腐蚀科学0010-938X 1.021 /science/journal/0010938X71J PHYS CHEMSOLIDSJOURNAL OF PHYSICS ANDCHEMISTRY OF SOLIDS固体物理与化学杂志0022-3697 1.02/science/journal/0022369772J ADHES SCITECHNOLJOURNAL OF ADHESION SCIENCEAND TECHNOLOGY粘着科学与技术杂志0169-4243 1.01/journals/jn-JouAdhSciTec.html73INT J REFRACT MET INTERNATIONAL JOURNAL OF 耐火金属和硬质材料0263-43680.989H REFRACTORY METALS & HARDMA TERIALS国际杂志/science/journal/0263436874SURF INTERFACEANALSURFACE AND INTERFACEANALYSIS表面与界面分析0142-24210.987/cgi-bin/jhome/200975INT J INORG MATER INTERNATIONAL JOURNAL OFINORGANIC MATERIALS无机材料国际杂志1466-60490.986/science/journal/1466604976SURF REV LETT SURFACE REVIEW AND LETTERS表面评论与快报0218-625X0.986/srl/srl.shtml77MA T SCI ENGA-STRUCTMA TERIALS SCIENCE ANDENGINEERING A-STRUCTURALMA TERIALS PROPERTIESMICROST材料科学和工程A—结构材料的性能、组织与加工0921-50930.978/peoplepages/oreilly.html78NANOSTRUCTMA TERNANOSTRUCTURED MATERIALS纳米结构材料0965-97730.969/science/journal/0965977379IEEE T ADVPACKAGINGIEEE TRANSACTIONS ONADVANCED PACKAGINGIEEE高级封装会刊1521-33230.96/xpl/RecentIssue.jsp?puNumber=604080INT J FATIGUE INTERNATIONAL JOURNAL OFFATIGUE疲劳国际杂志0142-11230.957/science/journal/0142112381J ALLOY COMPD JOURNAL OF ALLOYS ANDCOMPOUNDS合金和化合物杂志0925-83880.953/science/journal/0925838882J NONDESTRUCTEVALJOURNAL OF NONDESTRUCTIVEEV ALUATION无损检测杂志0195-92980.909/issn/0195-9298/current83MA T SCI ENG C-BIOSMA TERIALS SCIENCE &ENGINEERING C-BIOMIMETICAND SUPRAMOLECULARSYSTEMS材料科学与工程C—仿生与超分子系统0928-49310.905/inca/publications/store/5/2/4/1/7/5/524175.pub.htt84J ELECTROCERAMJOURNAL OFELECTROCERAMICS电子陶瓷杂志1385-34490.904/issn/1385-3449/contents85ADV ENG MATER ADVANCED ENGINEERINGMA TERIALS先进工程材料1438-16560.901http://www.wiley-vch.de/publish/en/journals/alphabeticIndex/2266/86IEEE T MAGN IEEE TRANSACTIONS ONMAGNETICSIEEE磁学会刊0018-94640.891/xpl/RecentIssue.jsp?puNumber=2087PHYS STATUS SOLIDIBPHYSICA STATUS SOLIDI B-BASICRESEARCH固态物理B—基础研究0370-19720.873/cgi-bin/jhome/4000118588J THERM SPRAYTECHNJOURNAL OF THERMAL SPRAYTECHNOLOGY热喷涂技术杂志1059-96300.862/content/Journals/JournalofThermalSprayTechnology/thermalspray.htm89MECH COHES-FRICTMA TMECHANICS OFCOHESIVE-FRICTIONALMA TERIALS粘着磨损材料力学1082-50100.849/cgi-bin/jhome/615290A TOMIZATIONSPRAYA TOMIZATION AND SPRAYS雾化和喷涂1044-51100.82/journals/6a7c7e10642258cc.html91COMPOS SCITECHNOLCOMPOSITES SCIENCE ANDTECHNOLOGY复合材料科学与技术0266-35380.812/science/journal/0266353892NEW DIAM FRONT CTECNEW DIAMOND AND FRONTIERCARBON TECHNOLOGY新型金刚石和前沿碳技术1344-99310.8http://www.kt.rim.or.jp/~myukk/NDFCT/93MODEL SIMULMA TER SCMODELLING AND SIMULATIONIN MA TERIALS SCIENCE ANDENGINEERING材料科学与工程中的建模与模拟0965-03930.789/EJ/journal/MSMSE94INT J THERMOPHYS INTERNATIONAL JOURNAL OFTHERMOPHYSICS热物理学国际杂志0195-928X0.773/issn/0195-928X/contents95J SOL-GEL SCITECHNJOURNAL OF SOL-GEL SCIENCEAND TECHNOLOGY溶胶凝胶科学与技术杂志0928-07070.765/issn/0928-0707/current96HIGH PERFORMPOL YMHIGH PERFORMANCE POLYMERS高性能聚合物0954-00830.758/journals/browse/sage/hip97MA TER CHEM PHYS MA TERIALS CHEMISTRY ANDPHYSICS材料化学与物理0254-05840.757/science/journal/0254058498METALL MA TERTRANS BMETALLURGICAL ANDMA TERIALS TRANSACTIONSB-PROCESS METALLURGY AND冶金和材料会刊B—制备冶金和材料制备科学1073-56150.754/laughlin/mmt.htmlMA TERIALS99COMPOS PARTB-ENGCOMPOSITES PARTB-ENGINEERING复合材料B工程1359-83680.741/science/journal/13598368100CEMENT CONCRETERESCEMENT AND CONCRETERESEARCH水泥与混凝土研究0008-88460.738/science/journal/00088846101J COMPOS MA TER JOURNAL OF COMPOSITEMA TERIALS复合材料杂志0021-99830.73/journals/browse/sage/jcm102J MA TER SCI JOURNAL OF MATERIALSSCIENCE材料科学杂志0022-24610.728/issn/0022-2461/current103J ENG MATER-TASMEJOURNAL OF ENGINEERINGMA TERIALS ANDTECHNOLOGY-TRANSACTIONSOF THE ASME工程材料与技术杂志—美国机械工程师学会会刊0094-42890.726http://www.csb-ing.unige.it/ITA/ElePerio/Periopages/PEJ.html104MA TER RES BULL MA TERIALS RESEARCHBULLETIN材料研究公告0025-54080.715/science/journal/00255408105JOM-J MIN MET MA TSJOM-JOURNAL OF THEMINERALS METALS &MA TERIALS SOCIETY矿物、金属和材料学会杂志1047-48380.702http///pubs/journals/JOM/106J BIOMA TER APPL JOURNAL OF BIOMATERIALSAPPLICA TIONS生物材料应用杂志0885-32820.697/journal.aspx?pid=309107FATIGUE FRACT ENGMFATIGUE & FRACTURE OFENGINEERING MA TERIALS &STRUCTURES工程材料与结构的疲劳与断裂8756-758X0.693/journals/browse/bsc/ffems108J ADHESION JOURNAL OF ADHESION粘着杂志0021-84640.68 /science/journal/01437496109COMP MA TER SCI COMPUTA TIONAL MATERIALSSCIENCE计算材料科学0927-02560.677/science/journal/09270256110IEEE TSEMICONDUCT MIEEE TRANSACTIONS ONSEMICONDUCTORMANUFACTURINGIEEE半导体制造会刊0894-65070.676/xpl/RecentIssue.jsp?puNumber=66111MECH COMPOSMA TER STMECHANICS OF COMPOSITEMA TERIALS AND STRUCTURES复合材料和结构力学1075-94170.675http://www.wkap.nl/prod/b/0-7923-5870-8112PHASE TRANSIT PHASE TRANSITIONS相变0141-15940.671 /~subir/qptweb/toc.html113MA TER LETT MA TERIALS LETTERS材料快报0167-577X0.67 /science/journal/0167577X114EUR PHYS J-APPLPHYSEUROPEAN PHYSICALJOURNAL-APPLIED PHYSICS欧洲物理杂志—应用物理1286-00420.664/journal/index.cfm?edpsname=epjap115PHYSICA B PHYSICA B物理B0921-45260.663 /science/journal/09214526116ADV COMPOS LETT ADVANCED COMPOSITESLETTERS先进复合材料快报0963-69350.662/117POL YM COMPOSITE POL YMER COMPOSITES聚合物复合材料0272-83970.661 /macrog/composit.htm118CORROSION CORROSION腐蚀0010-93120.66/journals /browse/maney/bcj119PHYS CHEMGLASSESPHYSICS AND CHEMISTRY OFGLASSES玻璃物理与化学0031-90900.66/vl=21681904/cl=15/nw=1/rpsv/cw/sgt/00319090/contp1.htm120J MA TER SCI-MATERELJOURNAL OF MATERIALSSCIENCE-MA TERIALS INELECTRONICS材料科学杂志—电子材料0957-45220.641/issn/0957-4522/current121COMPOS INTERFACE COMPOSITE INTERFACES复合材料界面0927-64400.631 /journals/jn-ComInt.html122AM CERAM SOCBULLAMERICAN CERAMIC SOCIETYBULLETIN美国陶瓷学会公告0002-78120.628/123APPL COMPOSMA TERAPPLIED COMPOSITEMA TERIALS应用复合材料0929-189X0.627/issn/0929-189X/contents124RES NONDESTRUCTEVALRESEARCH IN NONDESTRUCTIVEEV ALUATION无损检测研究0934-98470.621/125PROG CRYSTGROWTH CHPROGRESS IN CRYSTAL GROWTHAND CHARACTERIZATION OFMA TERIALS晶体生长和材料表征进展0960-89740.618/science/journal/09608974126J COMPUT-AIDEDMA TERJOURNAL OF COMPUTER-AIDEDMA TERIALS DESIGN计算机辅助材料设计杂志0928-10450.605/issn/0928-1045/current127CERAM INT CERAMICS INTERNATIONAL国际陶瓷0272-88420.593 /science/journal/02728842128POL YM TEST POL YMER TESTING聚合物测试0142-94180.59 /science/journal/01429418129ADV PERFORMMA TERADVANCED PERFORMANCEMA TERIALS先进性能材料0929-18810.583/issn/0929-1881/contents130SEMICONDUCTORS+SEMICONDUCTORS半导体1063-78260.575/131J BIOACT COMPA TPOLURNAL OF BIOACTIVE ANDCOMPA TIBLE POL YMERSJO生物活性与兼容性聚合物杂志0883-91150.571http//132HIGH TEMP MA TPR-ISRHIGH TEMPERA TURE MATERIALSAND PROCESSES高温材料和加工0334-64550.57133ADV POL YM TECH ADVANCES IN POLYMERTECHNOLOGY聚合物技术发展0730-66790.569/cgi-bin/jhome/35650134COMPOS STRUCT COMPOSITE STRUCTURES复合材料结构0263-82230.556 /science/journal/02638223135J CERAM SOC JPN JOURNAL OF THE CERAMICSOCIETY OF JAPAN日本陶瓷学会杂志0914-54000.541http://www.ceramic.or.jp/~ihensyuj/journal_j.html136BIO-MED MA TERENGBIO-MEDICAL MATERIALS ANDENGINEERING生物医用材料与工程0959-29890.537http://www.iospress.nl/site/html/09592989.html137INT J MOD PHYS B INTERNATIONAL JOURNAL OFMODERN PHYSICS B现代物理国际杂志B0217-97920.523/ijmpb/ijmpb.shtml138INT J THEOR PHYS INTERNATIONAL JOURNAL OFTHEORETICAL PHYSICS理论物理国际杂志0020-77480.52/issn/0020-7748/contents139INTEGRFERROELECTRINTEGRATED FERROELECTRICS集成铁电材料1058-45870.512/journals/titles/10584587.html140MAG CONCRETE RES MAGAZINE OF CONCRETERESEARCH混凝土研究杂志0024-98310.512/jol/141ACI MATER J ACI MATERIALS JOURNAL 美国混凝土学会材料杂志0889-325X0.503/general/home.asp142J MA TER SCI LETT JOURNAL OF MATERIALSSCIENCE LETTERS材料科学杂志快报0261-80280.489/issn/0261-8028/current143FERROELECTRICS FERROELECTRICS铁电材料0015-01930.471/xpl /RecentIssue.jsp?puNumber=58144 B MA TER SCI BULLETIN OF MA TERIALSSCIENCE材料科学公告0250-47070.465http://www.ias.ac.in/matersci/145MA TER SCI FORUM MA TERIALS SCIENCE FORUM材料科学论坛0255-54760.461/default.cfm?issn=0255-5476&pg=1146JSME INT J A-SOLIDMJSME INTERNATIONAL JOURNALSERIES A-SOLID MECHANICSAND MATERIAL ENGINEERIN日本机械工程学会国际杂志系列A-固体力学与材料工程1344-79120.449http://webcat.nii.ac.jp/cgi-bin/shsproc?id=AA10888746147MA TER CHARACT MA TERIALS CHARACTERIZATION材料表征1044-58030.447 /science/journal/10445803148SYN REACT INORGMETSYNTHESIS AND REACTIVITY ININORGANIC ANDMETAL-ORGANIC CHEMISTRY无机物及金属—有机物化学的合成和反应0094-57140.446/servlet/product/productid/SIM149MA TER HIGH TEMP MA TERIALS AT HIGHTEMPERA TURES高温材料0960-34090.444/materials/scimat.htm150HIGH TEMP-HIGHPRESSHIGH TEMPERA TURES-HIGHPRESSURES高温—高压0018-15440.438/151J COMPOS TECH RESJOURNAL OF COMPOSITESTECHNOLOGY & RESEARCH复合材料技术与研究杂志0884-68040.438/JOURNALS/COMPTECH/comptech.html152ACI STRUCT J ACI STRUCTURAL JOURNAL 美国混凝土学会结构杂志0889-32410.435/PUBS/JOURNALS/SJHOME.ASP153MA TER DESIGN MA TERIALS & DESIGN材料与设计0261-30690.434 /science/journal/02613069154MA TER STRUCT MA TERIALS AND STRUCTURES材料与结构1359-59970.432/EJ/journal/0964-1726155MA T SCI SEMICONPROCMA TERIALS SCIENCE INSEMICONDUCTOR PROCESSING半导体加工的材料科学1369-80010.419/science/journal/13698001156BRIT CERAM T BRITISH CERAMICTRANSACTIONS英国陶瓷会刊0967-97820.413/journals/browse/maney/bct157MECH COMPOSMA TERMECHANICS OF COMPOSITEMA TERIALS复合材料力学0191-56650.405/issn/0191-5665/contents158J COATING TECHNOL JOURNAL OF COATINGSTECHNOLOGY涂层技术杂志0361-87730.393/Publications/JCT.html159J REINF PLAST COMPJOURNAL OF REINFORCEDPLASTICS AND COMPOSITES增强塑料和复合材料杂志0731-68440.383/journal.aspx?pid=318160MA TER CORROSMA TERIALS ANDCORROSION-WERKSTOFFE UNDKORROSION材料与腐蚀0947-51170.376http://www.wiley-vch.de/vch/journals/2010/161SCI CHINA SER ESCIENCE IN CHINA SERIESE-TECHNOLOGICAL SCIENCES中国科学E技术科学1006-93210.376http://www.scienceinchina.com/scienceinchina_e_en.htm162CEMENT CONCRETECOMPCEMENT & CONCRETECOMPOSITES水泥与混凝土复合材料0958-94650.371/science/journal/09589465163MA TER EV AL MA TERIALS EV ALUATION材料评价0025-53270.371/publications /materialseval/materialseval.htm164POL YM POL YMCOMPOSPOL YMERS & POLYMERCOMPOSITES聚合物与聚合物复合材料0967-39110.368/Themes/polymers.htm165J MA TER SYNTHPROCESJOURNAL OF MATERIALSSYNTHESIS AND PROCESSING料合成与加工杂志1064-75620.358/issn/1064-7562/current166ADV COMPOSMA TERADVANCED COMPOSITEMA TERIALS先进复合材料0924-30460.357/167INT J MATER PRODTECINTERNATIONAL JOURNAL OFMA TERIALS & PRODUCTTECHNOLOGY材料与生产技术国际杂志0268-19000.349/catalogue/m/ijmpt/indexijmpt.html168J MA TER CIVIL ENG JOURNAL OF MATERIALS IN 土木工程材料杂志0899-15610.348/mto/CIVIL ENGINEERING169HIGH TEMP MA TERP-USHIGH TEMPERA TURE MATERIALPROCESSES高温材料加工1093-36110.342/journals/57d172397126f956.html170CONSTR BUILDMA TERCONSTRUCTION AND BUILDINGMA TERIALS结构与建筑材料0950-06180.341/science/journal/09500618171HIGH TEMP+HIGH TEMPERA TURE高温0018-151X0.327 /issn/0018-151X/contents172RARE METAL MA TENGRARE METAL MA TERIALS ANDENGINEERING稀有金属材料与工程1002-185X0.319http://www.benran.ru/Magazin/El_vin/X/082472.HTM173INORG MATER+INORGANIC MATERIALS无机材料0020-16850.312 /science/journal/14666049174SCI TECHNOL WELDJOISCIENCE AND TECHNOLOGY OFWELDING AND JOINING焊接科学与技术1362-17180.295/phase-trans/abstracts/stwj.html175MA TER MANUFPROCESSMA TERIALS ANDMANUFACTURING PROCESSES材料与制造工艺1042-69140.288/servlet/product/productid/AMP176FERROELECTRICSLETTFERROELECTRICS LETTERSSECTION铁电材料快报0731-51710.274/journals/titles/07315171.html177J MA TER SCITECHNOLJOURNAL OF MATERIALSSCIENCE & TECHNOLOGY材料科学与技术杂志1005-03020.269http://coral.dir.bg/jmst-h.htm178J MA TER ENGPERFORMJOURNAL OF MATERIALSENGINEERING ANDPERFORMANCE材料工程与性能杂志1059-94950.268/science/journal/10599495179MET MA TER-INT METALS AND MATERIALSINTERNATIONAL国际金属及材料1225-94380.256http://www.icm.re.kr/doc/paper/index.jsp?flag=kor&jcode=499180GLASS TECHNOL GLASS TECHNOLOGY玻璃技术0017-10500.255http://www.societyof /181J MA TER PROCESSTECHJOURNAL OF MATERIALSPROCESSING TECHNOLOGY材料加工技术杂志0924-01360.255/science/journal/09240136182J POL YM MA TER JOURNAL OF POLYMERMA TERIALS聚合物材料杂志0970-08380.229http://balkema.ima.nl/Scripts/cgiBalkema.exe/serie?SerNo=40183ADV POWDERTECHNOLADVANCED POWDERTECHNOLOGY先进粉末技术0921-88310.224/journals/jn-AdvPowTec.html184J ADV MA TER JOURNAL OF ADVANCEDMA TERIALS先进材料杂志1070-97890.22/JAM.html185SYNTHESE SYNTHESE合成0039-78570.208 /issn/0039-7857186GLASS SCI TECHNOLGLASS SCIENCE ANDTECHNOLOGY-GLASTECHNISCHEBERICHTE玻璃科学与技术0946-74750.189/isi/187J TEST EV AL JOURNAL OF TESTING ANDEV ALUATION测试及评价杂志0090-39730.171/cgi-bin/SoftCart.exe/index.shtml?E+mystore188MA TER SCITECH-LONDMA TERIALS SCIENCE ANDTECHNOLOGY材料科学与技术0267-08360.171/~tw/home.html189POWDER METALLMET C+POWDER METALLURGY ANDMETAL CERAMICS粉末冶金及金属陶瓷1068-13020.161/issn/1068-1302/contents190MA TER SCI+MA TERIALS SCIENCE材料科学1068-820X0.15/ 191MA TER TECHNOL MA TERIALS TECHNOLOGY材料技术1066-78570.147/192ADV MA TERPROCESSADVANCED MATERIALS &PROCESSES先进材料及工艺0882-79580.144/193RARE METALS RARE METALS稀有金属1001-05210.142/194J WUHAN UNIVTECHNOLJOURNAL OF WUHANUNIVERSITY OFTECHNOLOGY-MATERIALSSCIENCE EDITION武汉理工大学学报-材料科学版1000-24130.14/journal/english/order.htm195PLA T SURF FINISH PLA TING AND SURFACEFINISHING电镀和表面修整0360-31640.14/196J INORG MATER JOURNAL OF INORGANICMA TERIALS无机材料杂志1000-324X0.131/science/journal/14666049197MA TER WORLD MA TERIALS WORLD材料世界0967-86380.104/ 198MET SCI HEA T METAL SCIENCE AND HEA T 金属科学及热处理0026-06730.096TREA T+TREA TMENT/issn/0026-0673/current 199METALL METALL金属0026-07460.096http://www.vsb.cz/200MA TERPERFORMANCEMA TERIALS PERFORMANCE材料性能0094-14920.087/nace/content/publications/mediakit.asp#MP201J MA TER PROCESSMANUJOURNAL OF MATERIALSPROCESSING &MANUFACTURING SCIENCE材料加工与制造科学杂志1062-06560.078/journal.aspx?pid=316202SCI ENG COMPOSMA TERSCIENCE AND ENGINEERING OFCOMPOSITE MA TERIALS复合材料科学与工程0334-181X0.075/exec/obidos/ASIN/B00006KWDC/shoppingsavvy-20/002-4085689-4536025203IEEE T COMPONPACK TIEEE TRANSACTIONS ONCOMPONENTS AND PACKAGINGTECHNOLOGIESIEEE元件及封装技术会刊1521-33310.071/xpl/RecentIssue.jsp?puNumber=6144204JOCCA-SURF COA TINTJOCCA-SURFACE COATINGSINTERNATIONALJOCCA—国际表面涂层1356-0751/publications/sci/sci_sso205ADV FUNCT MATER ADVANCED FUNCTIONALMA TERIALS先进功能材料1616-301X /cgi-bin/jhome/77003362?CRETRY=1206ANN REV MA TERRESANNUAL REVIEW OF MA TERIALSRESEARCH材料研究年度评论1531-7331/loi/matsci207MA TER TRANS MA TERIALS TRANSACTIONS材料会刊1345-9678/pubs/journals/MT/MT.html。
Journal-of-Analytical-and-Applied-Pyrolysis_2009
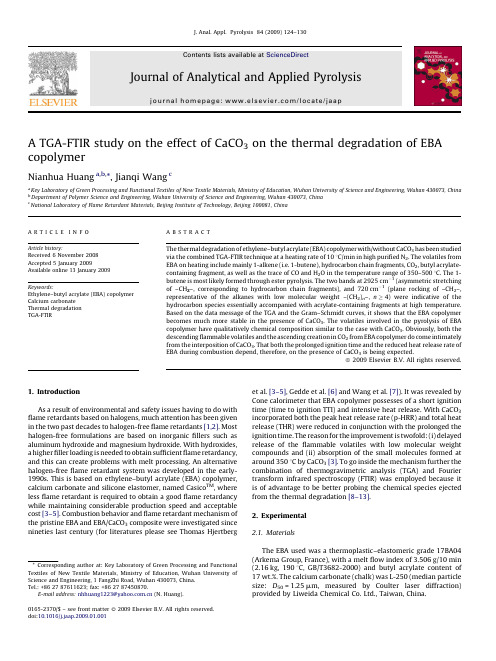
A TGA-FTIR study on the effect of CaCO 3on the thermal degradation of EBA copolymerNianhua Huang a ,b ,*,Jianqi Wang caKey Laboratory of Green Processing and Functional Textiles of New Textile Materials,Ministry of Education,Wuhan University of Science and Engineering,Wuhan 430073,China bDepartment of Polymer Science and Engineering,Wuhan University of Science and Engineering,Wuhan 430073,China cNational Laboratory of Flame Retardant Materials,Beijing Institute of Technology,Beijing 100081,China1.IntroductionAs a result of environmental and safety issues having to do with flame retardants based on halogens,much attention has been given in the two past decades to halogen-free flame retardants [1,2].Most halogen-free formulations are based on inorganic fillers such as aluminum hydroxide and magnesium hydroxide.With hydroxides,a higher filler loading is needed to obtain sufficient flame retardancy,and this can create problems with melt processing.An alternative halogen-free flame retardant system was developed in the early-1990s.This is based on ethylene–butyl acrylate (EBA)copolymer,calcium carbonate and silicone elastomer,named Casico TM ,where less flame retardant is required to obtain a good flame retardancy while maintaining considerable production speed and acceptable cost [3–5].Combustion behavior and flame retardant mechanism of the pristine EBA and EBA/CaCO 3composite were investigated since nineties last century (for literatures please see Thomas Hjertberget al.[3–5],Gedde et al.[6]and Wang et al.[7]).It was revealed by Cone calorimeter that EBA copolymer possesses of a short ignition time (time to ignition TTI)and intensive heat release.With CaCO 3incorporated both the peak heat release rate (p-HRR)and total heat release (THR)were reduced in conjunction with the prolonged the ignition time.The reason for the improvement is twofold:(i)delayed release of the flammable volatiles with low molecular weight compounds and (ii)absorption of the small molecules formed at around 3508C by CaCO 3[3].To go inside the mechanism further the combination of thermogravimetric analysis (TGA)and Fourier transform infrared spectroscopy (FTIR)was employed because it is of advantage to be better probing the chemical species ejected from the thermal degradation [8–13].2.Experimental 2.1.MaterialsThe EBA used was a thermoplastic–elastomeric grade 17BA04(Arkema Group,France),with a melt flow index of 3.506g/10min (2.16kg,1908C,GB/T3682-2000)and butyl acrylate content of 17wt.%.The calcium carbonate (chalk)was L-250(median particle size:D 50=1.25m m,measured by Coulter laser diffraction)provided by Liweida Chemical Co.Ltd.,Taiwan,China.J.Anal.Appl.Pyrolysis 84(2009)124–130A R T I C L E I N F O Article history:Received 6November 2008Accepted 5January 2009Available online 13January 2009Keywords:Ethylene–butyl acrylate (EBA)copolymer Calcium carbonate Thermal degradation TGA-FTIRA B S T R A C TThe thermal degradation of ethylene–butyl acrylate (EBA)copolymer with/without CaCO 3has been studied via the combined TGA-FTIR technique at a heating rate of 108C/min in high purified N 2.The volatiles from EBA on heating include mainly 1-alkene (i.e.1-butene),hydrocarbon chain fragments,CO 2,butyl acrylate-containing fragment,as well as the trace of CO and H 2O in the temperature range of 350–5008C.The 1-butene is most likely formed through ester pyrolysis.The two bands at 2925cm À1(asymmetric stretching of –CH 2–,corresponding to hydrocarbon chain fragments),and 720cm À1(plane rocking of –CH 2–,representative of the alkanes with low molecular weight –(CH 2)n –,n !4)were indicative of the hydrocarbon species essentially accompanied with acrylate-containing fragments at high temperature.Based on the data message of the TGA and the Gram–Schmidt curves,it shows that the EBA copolymer becomes much more stable in the presence of CaCO 3.The volatiles involved in the pyrolysis of EBA copolymer have qualitatively chemical composition similar to the case with CaCO 3.Obviously,both the descending flammable volatiles and the ascending creation in CO 2from EBA copolymer do come intimately from the interposition of CaCO 3.That both the prolonged ignition time and the reduced heat release rate of EBA during combustion depend,therefore,on the presence of CaCO 3is being expected.ß2009Elsevier B.V.All rights reserved.*Corresponding author at:Key Laboratory of Green Processing and Functional Textiles of New Textile Materials,Ministry of Education,Wuhan University of Science and Engineering,1FangZhi Road,Wuhan 430073,China.Tel.:+862787611623;fax:+862787450870.E-mail address:nhhuang1223@ (N.Huang).Contents lists available at ScienceDirectJournal of Analytical and Applied Pyrolysisj o u r n a l h o m e p a g e :w w w.e l s e v i e r.c o m /l o c a t e /j a a p0165-2370/$–see front matter ß2009Elsevier B.V.All rights reserved.doi:10.1016/j.jaap.2009.01.0012.2.Sample preparationThe composite was produced on a laboratory two-roll mill at 1808C for 15min.The foils were pelletized using a granulator providing coarse granules.The content of CaCO 3is about 40wt.%by weight in the formulation.2.3.TGA-FTIR analysisThe TGA-FTIR analyses were performed using a Netzsch TG 209F1Iris 1TGA,coupled with a Bruker Spectrum Tensor 27Infrared Spectrometer equipped with an IR gas cell.The transfer line consists in a Teflon tube of 800mm in length (4mm in inner diameter)on heating at a constant temperature of 2308C.FTIR measurements were carried out with a DTGS detector in a specifically developed low-volume gas cell (8.7ml)with a 123mm path length,heated at a constant temperature of 2308C.The interferometer and the gas cell compartments were purged with high purified N 2.The spectra were collected at resolution of 4cm À1,co-adding 16scans per spectrum.The samples were heated from room temperature to 6508C at a heating rate of 108C/min under a nitrogen flow of 20ml/min.The nitrogen flow was switched on 30min before the beginning of the analysis,keeping the furnace closed,to get a stable IR background.Masses of EBA and EBA/CaCO 3are 10.595mg and 12.351mg,respectively.Data massage (baseline calibration and integral)proceeded by the Software ‘‘OPUS 6.0.72’’,Bruker Company,Germany.3.Results and discussion 3.1.TG analysisThe TG and DTG curves of EBA,CaCO 3and EBA/CaCO 3composite were shown in Fig.1a and b.It shows that theweightFig.1.TG (a)and DTG (b)curves of EBA and EBA/CaCO 3composite in nitrogen,and the calculated curve of EBA/CaCO 3composite.Heating rate,108C/min.Fig.2.The 3D diagrams corresponding to the gases evolved of EBA (a)and EBA/CaCO 3composite (b)at a heating rate of 108C/min.Fig.3.The Gram–Schmidt curves obtained during thermal degradation of EBA (*)and EBA/CaCO 3composite (D )at a heating rate of 108C/min.N.Huang,J.Wang /J.Anal.Appl.Pyrolysis 84(2009)124–130125loss of EBA takes place in the range of 350–5008C ending nothing at 5008C.In contrast to Fig.1b (DTG curve,Fig.1(b))the main step with a maximum rate of weight loss happened at 4448C.A weak peak appears at T max =4308C in the EBA/CaCO 3composite followed by the second main step at 4858C (DTG curve).Assuming no interaction exists between the two components (EBA and CaCO 3)a linear combination of both components can be constructed as represented by the dash line in Fig.1a.It can be in witness of the definitive proof of the interaction (see the violet curve),resulting in a dramatic shift towards the higher tempera-ture by about 458C (see Fig.1(b)).This is in agreement with those reported by Hjertberg [3].Fig.4.FTIR spectra obtained from the gaseous products of EBA at 3908C (a),4448C (b),4668C (c)and 4798C (d).N.Huang,J.Wang /J.Anal.Appl.Pyrolysis 84(2009)124–1301263.2.The 3D diagrams and Gram–Schmidt curves of EBA with and/or without CaCO 3Once the TG-FTIR experiments of thermal degradation for the EBA and EBA/CaCO 3composite have been carried out,information should acquire knowledge of the absorbance corresponding to the vibrational modes on the evolution of the evolved gases from 3D diagrams.It provides a clear qualitative picture of the overall evolution of the FTIR spectra [12,13].The 3D diagrams obtained from the pyrolysis of EBA and EBA/CaCO 3composite at a heating rate of 108C/min.As can be seen in Fig.2a,the 3D diagram of EBA shows two peaks,which probably lies in the 4408C and 4778C,respectively.And that of EBA/CaCO 3composite shows a strong peak.The relative height of peaks in EBA displays much higher than that of EBA/CaCO 3composite.Additional information can be obtained as well from the Gram–Schmidt (GS)curve.On the basis of vector analysis,the plots can be constructed in Fig.3.The existence of two peaks with the maximum intensity at 4448C and 4798C for EBA.However,there are also two peaks with the maximum intensity at 4508C and 4858C for EBA/CaCO 3composite.Evidently,few visible peaks appear in the 3D diagram for EBA/CaCO 3composite,implying that the amount of the volatiles generated in the EBA/CaCO 3composite is less than that in the pristine EBA.This may be the right basis to get informed about the interpretation of the prolonged ignition time and the lower peak HRR of EBA/CaCO 3composite.3.3.Volatile degradation products of EBA during the thermal degradation processFig.4shows the FTIR bands corresponding to the GS curve of EBA at temperature of 3908C,4448C,4668C and 4798C.Assignment was listed in Table 1.In Fig.4a the bands at 1642cm À1(stretching of i C ChC–CHFig.5.The formation of 1-butene,carboxylic acid group and carboxylicanhydride.Fig.6.FTIR spectra obtained for EBA/CaCO 3composite at 3908C (a),4108C (b),4508C (c)and 4858C (d).N.Huang,J.Wang /J.Anal.Appl.Pyrolysis 84(2009)124–130127(Fig.4).The absorbance at 2357cm À1and 2321cm À1may be attributed to the assigned to the asymmetrical stretching of CO 2.The bands at 1852,1804indicate the formation of carboxylic anhydride,which might arise from the dehydration of neighboring carboxylic acid groups formed by the ester pyrolysis in the EBA (Fig.5).After Sulton [14]the band at 1740cm À1is likely the absorbance of stretching vibration of carbonyl (i CO)O)of carboxyl group in Fig.4c and d.Taken altogether,FTIR exploration could lend its aid to the study of the mechanistic aspects in the thermal degradation of EBA and EBA/CaCO parison among the gases evolved of EBA and EBA/CaCO 3compositeIn Fig.6the FTIR spectra stemmed from the volatile products at the key temperatures (at 3908C,4108C,4508C and 4858C)of GS curve of EBA/CaCO 3composite.The FTIR spectra of the volatile degradation products of EBA/CaCO 3composite are similar to those of EBA.This implies that the composition of the gases products is quite similar to the thermal degradation processes of EBA with and without CaCO 3.Although the resemblance between the chemical composi-tion of volatile degradation products in the thermal degrada-tion processes of EBA and the one with/without CaCO 3,some differences can still be envisaged.The bands at 1740cm À1and 1710cm À1(stretching ofC O in –COOH group)for EBA is seen in Table 1,but the one at 1710cm À1for EBA/CaCO 3composite is invisible within the experimental error.The ionomericstructureFig.7.Evolution with the temperature of pyrolysis of the absorbance bands characteristics of alkenes 1642cm À1(a),910cm À1(b)and 3080cm À1(c),for EBA (*)and EBA/CaCO 3composite (D ).Table 1Assignments of the IR bands.Functional group Vibrational modeAssigned (cm À1)–CH 3C–H asymmetrical and symmetrical stretching 2965,2863–CH 2–C–H asymmetrical stretching2937–CH 3C–H asymmetrical and symmetrical bending 1448,1378–CH 2–C–H scissoring1460iC C hC sCH 2C–H olefinic stretching3080iCCH OOO stretching 1710COC–O stretching2164,2108N.Huang,J.Wang /J.Anal.Appl.Pyrolysis 84(2009)124–130128seems to be confirmed by the conversion of carboxylic acid groups (–COOH),originating from ester pyrolysis of EBA (see Fig.5)to carboxylate (i.e.ionomer)yielded from CaCO 3[3]as consequence of the disappearance of the band at 1710cm À1in the case of EBA/CaCO 3composite.The absorbance intensity of IR bands for EBA and EBA/CaCO 3composite is also dissimilar (Figs.7–11).In order to make thecomparison among the different curves realized,the absorbance values had been divided by the mass of EBA and EBA/CaCO 3for each in experiments as did in literature [12].The bands at 1642cm À1(i C Ch CHCHparison between the evolution with the temperature of the absorbance of FTIR bands corresponding to CO 2in the thermal degradation processes of EBA (*)and EBA/CaCO 3composite (D).parison between the evolution with temperature of the absorbance of FTIR bands 2926cm À1(a),1462cm À1(b)and 2853cm À1(c),corresponding to methylene group of compounds in the thermal degradation of EBA (*)and EBA/CaCO 3composite (D).Fig.9.Evolution with the temperature of the absorbance bands characteristics of hydrocarbon chainfragment.Fig.10.Evolution with the temperature of pyrolysis of the absorbance bands characteristics of carbonyl groups for EBA (*)and EBA/CaCO 3composite (D ).N.Huang,J.Wang /J.Anal.Appl.Pyrolysis 84(2009)124–130129seen in Fig.7a–c,of which the yields of the unsaturated alkenes in the volatile degradation products of EBA were lower than that in the volatile degradation products of EBA/CaCO3composite.The evolution with the temperature of the absorbance at 2926cmÀ1(asymmetrical stretching of–CH2–),2853cmÀ1(sym-metrical stretching of–CH2–)and1462cmÀ1(scissoring of–CH2–) for EBA and EBA/CaCO3composite corresponding to hydrocarbon chain fragments was shown in Fig.8.The temperatures for the peak bands at2926cmÀ1,2853cmÀ1and1462cmÀ1for EBA are lower than that for EBA/CaCO3composite,although the relative amount of the saturated hydrocarbon is basically equal in both cases.In short,the thermal stability of EBA is evidently improved in the presence of CaCO3anyway.Fig.9shows the intensity of band evolved at720cmÀ1 corresponding to hydrocarbon chain fragment(–(CH2)n–,n!4) for EBA and EBA/CaCO3composite.The yield of hydrocarbon chain fragments(–(CH2)n–,n!4)occurs between4108C and4908C with a maximum around4708C,corresponding to the maximum intensity of GS curve of EBA.However,The formation of hydrocarbon chain fragments(–(CH2)n–,n!4)occurs between 4508C and5258C with a maximum around4858C,corresponding to the maximum intensity of GS curve of EBA/CaCO3composite. The maximum absorbance intensity of band at720cmÀ1in the gaseous products of EBA is slightly higher than in the gaseous products of EBA/CaCO3composite.The yield offlammable hydrocarbon chain fragments in thermal degradation of EBA seems possibly greater than the EBA/CaCO3composite.This might be one of the reasons for the prolonged ignition time and the reduction in peak rate and total heat release by incorporated CaCO3 into EBA.The band evolved at1740cmÀ1has been assigned to the carbonyl groups(i C O)。
- 1、下载文档前请自行甄别文档内容的完整性,平台不提供额外的编辑、内容补充、找答案等附加服务。
- 2、"仅部分预览"的文档,不可在线预览部分如存在完整性等问题,可反馈申请退款(可完整预览的文档不适用该条件!)。
- 3、如文档侵犯您的权益,请联系客服反馈,我们会尽快为您处理(人工客服工作时间:9:00-18:30)。
NASA/CR-1998-208708Properties of PZT-Based Piezoelectric Ceramics Between –150 and 250o C Matthew W. HookerLockheed Martin Engineering & Sciences Co., Hampton, Virginia September 1998The NASA STI Program Office ... in ProfileSince its founding, NASA has been dedicated to the advancement of aeronautics and space science. The NASA Scientific and Technical Information (STI) Program Office plays a key part in helping NASA maintain this important role.The NASA STI Program Office is operated by Langley Research Center, the lead center for NASA’s scientific and technical information. The NASA STI Program Office provides access to the NASA STI Database, the largest collection of aeronautical and space science STI in the world. The Program Office is also NASA’s institutional mechanism for disseminating the results of its research and development activities. These results are published by NASA in the NASA STI Report Series, which includes the following report types:•TECHNICAL PUBLICATION. Reports of completed research or a majorsignificant phase of research thatpresent the results of NASA programsand include extensive data or theoreticalanalysis. Includes compilations ofsignificant scientific and technical dataand information deemed to be ofcontinuing reference value. NASAcounter-part of peer reviewed formalprofessional papers, but having lessstringent limitations on manuscriptlength and extent of graphicpresentations.•TECHNICAL MEMORANDUM.Scientific and technical findings that arepreliminary or of specialized interest,e.g., quick release reports, workingpapers, and bibliographies that containminimal annotation. Does not containextensive analysis.•CONTRACTOR REPORT. Scientific and technical findings by NASA-sponsoredcontractors and grantees.•CONFERENCE PUBLICATION.Collected papers from scientific andtechnical conferences, symposia,seminars, or other meetings sponsoredor co-sponsored by NASA.•SPECIAL PUBLICATION. Scientific, technical, or historical information fromNASA programs, projects, and missions,often concerned with subjects havingsubstantial public interest.•TECHNICAL TRANSLATION. English-language translations of foreignscientific and technical materialpertinent to NASA’s mission.Specialized services that help round out the STI Program Office’s diverse offerings include creating custom thesauri, building customized databases, organizing and publishing research results ... even providing videos.For more information about the NASA STI Program Office, see the following:•Access the NASA STI Program Home Page at •E-mail your question via the Internet to help@•Fax your question to the NASA Access Help Desk at (301) 621-0134•Phone the NASA Access Help Desk at (301) 621-0390•Write to:NASA Access Help DeskNASA Center for AeroSpace Information 7121 Standard DriveHanover, MD 21076-1320NASA/CR-1998-208708Properties of PZT-Based Piezoelectric Ceramics Between –150 and 250o CMatthew W. HookerLockheed Martin Engineering & Sciences Co., Hampton, VirginiaNational Aeronautics andSpace AdministrationLangley Research Center Prepared for Langley Research Center Hampton, Virginia 23681-2199under Contract NAS1-96014 September 1998Available from the following:NASA Center for AeroSpace Information (CASI)National Technical Information Service (NTIS) 7121 Standard Drive5285 Port Royal RoadHanover, MD 21076-1320Springfield, VA 22161-2171(301) 621-0390(703) 487-4650AbstractThe properties of three PZT-based piezoelectric ceramics and one PLZT electrostrictive ceramic were measured as a function of temperature. In this work, the dielectric, ferroelectric polarization versus electric field, and piezoelectric properties of PZT-4, PZT-5A, PZT-5H, and PLZT-9/65/35 were measured over a temperature range of -150 to 250o C. In addition to these measurements, the relative thermal expansion of each composition was measured from 25 to 600o C, and the modulus of rupture of each material was measured at room temperature. This report describes the experimental results and compares and contrasts the properties of these materials with respect to their applicability to intelligent aerospace systems.Keywords: piezoelectric, PZT, PLZT, temperatureIntroductionThe term piezoelectricity refers to the relationship between pressure and electricity that exists within a unique family of materials. Piezoelectrics are materials that either output a voltage when subjected to a mechanical stress or exhibit a dimensional change when an electric field is applied. These two behaviors are referred to as the direct and indirect modes of operation respectively [1-2]. Both modes of piezoelectric operation are currently being utilized in modern aerospace systems in such diverse applications as vibration cancellation and optical positioning [3-5]. Because these materials have the ability to sense and respond to changes in their environment, they are often referred to as “smart” or “intelligent” materials [6].The primary applications of piezoelectric technologies in fixed-wing aircraft include the active control of boundary layers along leading edges [7], the suppression of internal cabin noise [8], and the elimination of panel flutter [9] and tail buffeting [10]. This technology is also being applied in helicopters to eliminate the vibrations present in rotor blades [11-13].In addition to the aeronautical applications of intelligent structures, piezoelectric technologies are also being developed for use in spacecraft systems. In recent years, satellite systems have become smaller and lighter to reduce the cost of launching the payloads into orbit. As spacecraft masses have been reduced, however, the elimination of vibrational disturbances has become a critical design issue. Since many of the scientific instruments aboard these spacecraft require precision pointing to perform their intended functions, the spacecraft must be mechanically stable for the payloads to function as designed. As such, methods of incorporating intelligent structures to minimize jitter in spacecraft structures has become a critical area of research and development in the aerospace community [14-15].Piezoelectric materials are typically incorporated into aerospace structures by either applying a patch-style device to the surface of the structure [16-17] or by embedding the device into a graphite-epoxy composite structure [18-20]. In each instance, distributed networks of sensors and actuators are used to sense and nullify vibrational disturbances. Similarly-controlled systems are also being developed for use in space-based instruments to actively position optical components [21]. These control systems typically include a position sensor that locates the optical component and a piezoelectric drive mechanism which positions the optic based on real-time feedback from the position sensor.Because of the wide range of operating conditions for the systems under development, careful consideration must be given to the selection of piezoelectric materials. This is particularly importantwhen selecting materials for use in systems that will be exposed to a wide range of operating temperatures. To address these concerns, the dielectric, ferroelectric, and electro-mechanical propertiesof four PZT-based materials were evaluated over a temperature range of -150 to 250oC. Additionally, thethermal expansion properties were measured from 25 to 600oC, and the moduli of rupture were measured at room temperature. This report describes the experimental results and compares and contrasts the properties of the materials evaluated with respect to their applicability to intelligent aerospace systems.Experimental ProcedureMaterials EvaluatedThe properties of three piezoelectric materials and one electrostrictive composition were measured between -150 and 250°C. The piezoelectric materials evaluated in this work were commercially-produced PZT-4, PZT-5A, and PZT-5H ceramics. The electrostrictive materials, PLZT-9/65/35, were produced by tape casting powders synthesized by the solid state reaction of PbO, La 2O 3, ZrO 2, and TiO 2.All of the ceramics used in this study were obtained in an unelectroded and unpoled condition and possessed density values that were at least 95% of theoretical density. Prior to testing, gold electrodes were sputtered onto the major surfaces of each specimen.Initially, the room temperature (25oC) dielectric, ferroelectric, and piezoelectric properties of each composition were determined. Once the initial room temperature evaluations were complete, the properties of each composition were then measured between -150 and 250°C. The specific details of each measurement are described below.During the thermal tests, each specimen was placed in an environmental chamber with a temperature sensor located in close proximity to the test article. Throughout this investigation, multiple specimens of each composition were tested at each condition, and the average value of each property was determined.Dielectric and Ferroelectric MeasurementsThe dielectric constant (K), dissipation factor (tan δ), and electrical resistivity of each composition were measured at frequencies of 100 Hz, 1 kHz, 10 kHz, and 100 kHz using an HP 4284A LCR meter.From this data, the Curie point (T C ) of each specimen exhibiting a maximum dielectric constant between -150 and 250oC was determined.Next, the ferroelectric polarization versus electric field (P-E) properties of each composition were measured at 1 Hz using a Sawyer-Tower circuit. The P-E properties of the soft piezoelectric materials (i.e., PZT-5A and PZT-5H), as well as the electrostrictive specimens, were measured in an unpoled condition. However, because the hard piezoelectric ceramics (i.e., PZT-4) are not initially polarizable at room temperature, these specimens were poled at 100°C prior to testing. The properties of these materials were tested in the polarized state in order to accurately simulate the polarization state of the materials as they would be used in practice.Piezoelectric MeasurementsThe piezoelectric coefficients of each composition were measured in accordance with published standards [22-23]. The various specimen geometries and electrode patterns necessary for determining the piezoelectric coefficients for radial, transverse, and longitudinal modes of operation are shown in Figure 1. The circular ceramics used in this work were 25.4 mm in diameter and 250 to 380 µm thick. The rectangular specimens had dimensions 2 mm x 2 mm x 7.5 mm.Dimensional requirementsUsed fordetermination of{{k 33, K 3, D S 33, S 33d 33, g 33TD E k 31, K 3, D S 11, S 11d 31, g 31T D E (a)(b)(c)l 2.5 w, t ≥d 10 t ≥l 3.5 w, t≥k p , K 3, D Q T mlttldtFigure 1. Specimen geometries and polarization directions associated with the measurement of radial, transverse,and longitudinal piezoelectric properties.The resonance properties of the poled piezoelectric specimens were measured using an HP 4194A Impedance Analyzer. The effective electromechanical coupling coefficient, k eff , of the radial test specimens was then calculated using the resonance/antiresonance method described by the relation [23]:k eff =−f f f n 2m 2n 2(1)where f m and f n refer to the frequencies of minimum and maximum impedance, respectively. In addition to the k eff values, the planar coupling coefficient, k p , for each composition was determined using the procedures described in references 22 and 23.The piezoelectric coefficients for the transverse (k 31, d 31, and g 31) and longitudinal (k 33, d 33, and g 33)modes of operation were determined by measuring the resonance properties of the thickness-poled and length-poled ceramics, respectively. The coefficients describing the transverse mode of operation were calculated using the following relations:k A1+A31=(2)where ()A =−ππ22f f f f f m n n m mtan (3)S 11E =1422ρf l m (4)d k K S 31313=ε011E(5)g d K 31313=ε0 (6)The coefficients for the longitudinal mode of operation were calculated using the relations:()k 33=−ππ22f f f f f m n n m ntan (7)S 33D =1422ρf l n (8)S S 1-k 33E 33D332= (9)d k K S 33333E=ε033 (10)g d K 33333=ε0 (11)All of the symbols used in equations 1-11 are defined in Table 1.Table 1. Definition of symbols used in the determination of piezoelectric coefficients.Symbol Definition Units d31Transverse strain constant m/Vd33Extensional strain constant m/VD (superscript)At constant electric displacementE (superscript)At constant electric fieldfmFrequency of minimum impedance HzfnFrequency of maximum impedance Hzg31Transverse voltage constant V m/Ng33Extensional voltage constant V m/Nk31Transverse coupling coefficientk33Extensional coupling coefficientkeffEffective electro-mechanical coupling coefficientkpPlanar coupling coefficientK3Dielectric constantl Specimen length mS 11, S33Elastic compliance constants m2/NεPermittivity of free space, 8.85 x 10⁻¹²F/m ρDensity kg/m3Thermal Expansion MeasurementsThe thermal expansion properties of unelectroded, unpoled specimens with dimensions 25 mm x 4mm x 3 mm were measured from 25 to 600°C using a Linseis model L75 dilatometer. All of these tests were performed in an argon atmosphere using a heating rate of 2°C/min. Once the measurements were complete, the relative change in length, ∆l/l 0, for each material was calculated.Mechanical TestingThe flexural strength of each composition was measured at room temperature using a four-point bend test. In this work, unelectroded and unpoled ceramics with dimensions of 38 mm x 6 mm x 4 mm were tested to failure. All of the mechanical testing was performed using a load rate of 0.25 mm/min and inner and outer span lengths of 17 and 34 mm, respectively. Once all of the tests were complete, the Modulus of Rupture (MOR) of each specimen was calculated using the relation [24]:MOR =3P(L −a )2bd 2(12)where P is the mechanical load required to break the specimen, L is the outer span distance, a is the inner span distance, b is the width of the bar, and d is the depth of the bar. Between five and ten specimens of each composition were tested, and an average MOR value was calculated for each composition.Experimental ResultsRoom Temperature PropertiesAs shown in Table 2, all of the materials evaluated in this work possessed room-temperature dielectric constants ranging from 1100 to 5000. Additionally, each of the piezoelectric compositions exhibited E Cand P R values in excess of 5.5 kV/cm and 12.9 µC/cm 2, whereas the electrostrictive possessed E C and P Rvalues of 2.5 kV/cm and 1.1 µC/cm 2, respectively.After the initial dielectric and ferroelectric measurements were performed, additional materials of each composition were poled and tested. The piezoelectric specimens exhibited k eff values ranging from 0.49to 0.53, with the highest values exhibited by the PZT-5H ceramics. The PZT-5H ceramics also exhibited the highest d 31 and d 33 values followed by the PZT-5A and PZT-4 compositions, respectively. Because of the cubic nature of the PLZT-9/65/35 crystal structure, these materials do not exhibit strong resonance properties, and therefore, the calculation of piezoelectric coefficients for these materials yields negligible values.Table 2. Room temperature (25o C) dielectric, ferroelectric, and piezoelectric properties of PZT-based ceramics.Property Units PZT-4PZT-5A PZT-5H PLZT-9/65/35K (1 kHz)---1400160034005000tan δ (1kHz)---0.050.020.020.06E C kV/cm14.411.8 5.5 2.5P R µC/cm231.023.012.9 1.1P SAT µC/cm 240.127.719.520.8k eff ---0.490.500.53---k p---0.540.560.59---d 33 (x10-12)m/V 225350585---g 33 (x10-3)Vm/N 8.516.612.5---k 33---0.350.530.59---d 31 (x10-12)m/V -85-190-265---g 31 (x10-3)Vm/N -7.5-13.7-8.5---k 31---0.220.400.36---Densityg/cm 37.67.77.47.3Dielectric and Resistive PropertiesAs shown in Figure 2, all of the materials evaluated in this work exhibited their lowest dielectric constant values at -150°C, and as the temperature was increased the dielectric constant of each composition also increased. The dielectric constants of the PZT-4 and PZT-5A ceramics increased steadily as a function of temperature with neither possessing a Curie point in the temperature range evaluated in this study. The other two materials evaluated, PZT-5H and PLZT-9/65/35, exhibited Curie points within the -150 to 250°C range. The PZT-5H ceramics possessed a T c value of 180°C at each frequency, whereas the PLZT-9/65/35 materials exhibited T c properties typical of a relaxor ferroelectric (i.e., varying with frequency). In this instance, the temperature at which the maximum dielectric constant was observed increased from 72 to 91°C as the measurement frequency increased from 100 Hz to 100kHz.The dissipation factors for each material were also found to be dependent upon both the temperature and measurement frequency. As shown in Figure 3, the tan δ values for PZT-4 were approximately 0.05over the entire temperature range when measured at 10 and 100 kHz. At 100 Hz and 1 kHz, however, thedissipation factor began to increase at 125 and 150oC, respectively. The tan δ values for PZT-5A were also found to be relatively constant when measured at frequencies of 100 Hz, 1 kHz, and 10 kHz.However, at 100 kHz the dielectric loss was significantly higher over the entire temperature range.Unlike the previous two materials discussed, the PZT-5H and PLZT-9/65/35 ceramics exhibited maximum tan δ values at each measurement frequency which correspond to their respective Curie points.In both instances, the dissipation factors were found to increase with increasing measurement frequency as seen in Figures 3 (c) and 3 (d).(a) PZT-401000200030004000-200-100010*******Temperature (C)D i e l e c t r i c C o n s t a n t100 Hz 1 kHz 10 kHz 100 kHz(b) PZT-5A1000200030004000-200-1000100200300Temperature (C)D i e l e c t r i c C o n s t a n t100 Hz 1 kHz 10 kHz 100 kHz(c) PZT-5H0200040006000800010000120001400016000-200-100010*******Temperature (C)D i e l e c t r i c C o n s t a n t100 Hz 1 kHz 10 kHz 100 kHz(d) PLZT-9/65/3520004000600080001000012000-200-1000100200300Temperature (C)D i e l e c t r i c C o n s t a n t100 Hz 1 kHz 10 kHz 100 kHzFigure 2. Dielectric constant versus temperature data for (a) PZT-4, (b) PZT-5A, PZT-5H, and (d) PLZT-9/65/35.(a) PZT-400.511.5-200-100100200300Temperature (C)t a n δ100 Hz1 kHz10 kHz 100 kHz(b) PZT-5A0.010.020.030.040.05-200-1000100200300Temperature (C)t a n δ100 Hz1 kHz10 kHz100 kHz(c) PZT-5H00.050.10.150.2-200-1000100200300Temperature (C)t a n δ100 Hz1 kHz10 kHz 100 kHz(d) PLZT-9/65/350.050.10.150.2-200-1000100200300Temperature (C)t a n δ100 Hz1 kHz 10 kHz 100 kHzFigure 3. Dissipation factor (tan δ) versus temperature data for (a) PZT-4, (b) PZT-5A, PZT-5H, and (d) PLZT-9/65/35.As shown in Figure 4, the resistivity of the PZT-4 ceramics remained relatively constant between -150and 50oC. However, as the temperature was further increased the resistivity was found to decreasesignificantly. For example, the resistivity measured at 100 Hz decreased from 109 Ω-cm at 50oC to lessthan 107 Ω-cm at 250oC. The PZT-5A ceramics were also found to possess a resistivity on the order of 109 Ω-cm at -150oC when measured at 100 Hz. Although the resistivity of the PZT-5A specimens was found to decrease with increasing temperature, these materials did not exhibit the sharp decrease inresistivity exhibited by the PZT-4 ceramics as the measurement temperature exceeded 50oC.The resistivity of the PZT-5H materials was also found to decrease with increasing temperature. In this instance, however, the resistance reached a minimum value at the Curie point and increased as thetest specimen was heated to 250oC. A resistance minimum corresponding to the Curie temperature was also observed for the PLZT-9/65/35 ceramics. As previously noted, this material is a relaxor ferroelectricand therefore the temperature of minimum resistance was found to increase from 72 to 91oC as the measurement frequency increased from 100 Hz to 100 kHz.(a) PZT-41.E+041.E+061.E+081.E+10-200-100100200300Temperature (C)R e s i s t i v i t y (Ω-c m )100 Hz1 kHz 10 kHz 100 kHz(b) PZT-5A1.E+041.E+061.E+081.E+10-200-100100200300Temperature (C)R e s i s t i v i t y (Ω-c m )100 Hz 1 kHz 10 kHz 100 kHz(c) PZT-5H1.E+021.E+041.E+061.E+081.E+10-200-1000100200300Temperature (C)R e s i s t i v i t y (Ω-c m )100 Hz1 kHz 10 kHz 100 kHz(d) PLZT-9/65/351.E+021.E+041.E+061.E+081.E+10-200-100100200300Temperature (C)R e s i s t i v i t y (Ω-c m )100 Hz 1 kHz 10 kHz 100 kHzFigure 4. Resistivity versus temperature data for (a) PZT-4, (b) PZT-5A, (c) PZT-5H, and (d) PLZT-9/65/35.Ferroelectric Polarization versus Electric Field PropertiesAs shown in Figures 5 (a) to 5 (c), all of the piezoelectric ceramics evaluated in this work possessedmaximum remanent polarization values between 0 and 50oC, indicating that the highest induced polarization states occur near room temperature. For each composition tested, the P R values were lowestat -150oC and increased until a maximum value was reached. As the temperature was further increased beyond the temperature at which the maximum value was observed, the P R values of each composition decreased steadily over the balance of the temperature range.As previously mentioned, the resistivity of the PZT-4 materials decreased as the materials were heatedbeyond 50oC. Because of this decrease in resistance, calculation of the P R values at temperatures above120oC indicates an increase that is due to the conductive nature of these materials at high temperatures.The increase in the P R and P SAT values above 120oC is illustrated in Figure 5 (a). As the temperature was further increased, the application of high electric fields ultimately led to the breakdown of thesespecimens. Therefore, P-E data for this material was not collected above 160oC.Unlike the PZT-4 specimens, the PZT-5A ceramics were polarizable over the entire temperaturerange. As shown in Figure 5 (b), the P R values for this composition increased from 2 µC/cm 2 at -150oC toa maximum value of 25 µC/cm 2 at 25o C. As the temperature was further increased to 250oC, the P R valuesdecreased to 20 µC/cm 2.As shown in Figures 5 (c) and 5 (d), the P R values for both PZT-5H and PLZT-9/65/35 reachedmaximum values near 25oC and then decreased steadily with increasing temperature until the material no longer exhibited a ferroelectric hysteresis. Each of these latter compositions exhibited paraelectric P-E behaviors at each measurement temperature above their respective T c values.The coercive field values for each composition were also found to exhibit a maximum value and then decrease with increasing temperature. As seen in Figures 5 (a) to 5 (d), the maximum coercive fieldvalues were found to occur between -100 and -50oC. As was noted in the P R behaviors, the E C values for the PZT-5H and PLZT-9/65/35 materials decreased to zero at their respective Curie points, indicating that the ferroelectric domains are not spontaneously reversible and that a remanent polarization state can not be induced above that temperature.(a) PZT-40510152025-200-150-100-50050100150200250300Temperature (oC)E C (k V /c m )102030405060P (µC/cm 2)P SAT P RE CP R and P SAT increases above 120oC due to decrease in resistivityFigure 5. Coercive field (E C ), remanent polarization (P R ), and saturation polarization (P SAT ) versus temperatureproperties of (a) PZT-4, (b) PZT-5A, (c ) PZT-5H, and (d) PLZT-9/65/35.(b) PZT-5A5101520-200-150-100-50050100150200250300Temperature (oC)E C (k V /c m )05101520253035P (µC/cm 2)P SAT P RE C(c) PZT-5H 05101520-200-150-100-50050100150200250300Temperature (oC)E C (k V /c m )510152025P (µC/cm 2)P SATP RE C(d) PLZT-9/65/355101520-200-150-100-50050100150200250300Temperature (oC)E C (k V /c m )510152025P (µC/cm 2)P SATP RE CFigure 5 (continued). Coercive field (E C ), remanent polarization (P R ), and saturation polarization (P SAT ) versustemperature properties of (a) PZT-4, (b) PZT-5A, (c ) PZT-5H, and (d) PLZT-9/65/35.In addition to the graphs summarizing the ferroelectric hysteresis properties of each composition from-150 to 250oC, typical examples of the P-E behaviors of each composition at -150, -75, 0, 25, 100, and250oC are shown in Figures 6 to 9. As previously discussed, each composition exhibits a very lowpolarization of -150oC, and as the temperature increases, the hysteresis loops of the three piezoelectric compositions exhibit typical square (PZT-4 and PZT-5A) or rounded (PZT-5H) ferroelectric hysteresis behavior near room temperature.As shown in Figures 6 (a) and 6 (b), the PZT-4 ceramics exhibited somewhat asymmetric hysteresisbehavior below -50oC. However, all of the P-E loops collected above this temperature were symmetric about each axis. Symmetric hysteresis loops were obtained at every temperature for the soft piezoelectric ceramics evaluated herein.The PLZT-9/65/35 ceramics also exhibited low polarization properties at -150oC. However, as previously observed in Figure 5 (d), the maximum E C and P SAT values for this composition were obtainednear -50oC. At this temperature, these materials exhibit a P-E behavior that is very similar to those of thepiezoelectric ceramics near room temperature. As these specimens were further heated to 25oC, the remanent polarization and coercive field values decreased significantly, and a slim-loop ferroelectric behavior was observed at room temperature (see Figure 9 (d)).-40-30-20-10010203040-30-20-10102030E (kV/cm)P (µC/cm 2)(a) -150oC-40-30-20-10010203040-30-20-10102030E (kV/cm)P (µC/cm 2)(b) -75oC-40-30-20-10010203040-30-20-10102030E (kV/cm)P (µC/cm 2)(c) 0oC-40-30-20-10010203040-30-20-10102030E (kV/cm)P (µC/cm 2)(d) 25oC-40-30-20-10010203040-30-20-10102030E (kV/cm)P (µC/cm 2)(e) 100oCFigure 6. Typical ferroelectric polarization versus electric field (P-E) properties of PZT-4 ceramics at (a) -150o C,(b) -75o C, (c) 0o C, (d) 25o C, (e) 100o C, and (f) 150o C.-35-25-15-55152535-20-1001020E (kV/cm)P (µC/cm 2)(a) -150oC-35-25-15-55152535-20-1001020E (kV/cm)P (µC/cm 2)(b) -75oC-35-25-15-55152535-20-1001020E (kV/cm)P (µC/cm 2)(c) 0oC-35-25-15-55152535-20-1001020E (kV/cm)P (µC/cm 2)(d) 25oC-35-25-15-55152535-20-1001020E (kV/cm)P (µC/cm 2)(e) 100oC-35-25-15-55152535-20-1001020E (kV/cm)P (µC/cm 2)(f) 250oCFigure 7. Typical ferroelectric polarization versus electric field (P-E) properties of PZT-5A ceramics at (a) -150o C,(b) -75o C, (c) 0o C, (d) 25o C, (e) 100o C, and (f) 250o C.。