高考英语图表作文模板和范例
高考英语:满分作文经典模板之图表描述段
高考英语:满分作文经典模板之图表描述段
高考英语:满分作文经典模板之图表描述段
导读:本文高考英语:满分作文经典模板之图表描述段,仅供参照,
假如能帮助到您,欢迎谈论和分享。
【示例一】① From the picture (graph, chart, table, pie, bar),
we know that ________ (图表内容总概括). ② On the one hand, the left/first picture tells us that ________(状况一,图一 / 表一的
内容). ③ On the other hand, (the right/second)picture informs
us that ________(状况二,图二 / 表二的内容). ④ It can easily be seen that ________(揭示图画 / 表寓意) .【示例二】① As is
vividly shown/described/depicted in the cartoon/picture,(图表内容总概括). ② In the first picture, ________
图/ 表一内容,假如是一个表,则可左或上半部分) . ③ As is shown in the second drawing/picture, ________(描述图/表二内容,假如是
一个表,则右或下半部分) . ④ It is safe to draw the conclusion that (提示寓意,或主题句,回应主题但不是主题句的重复).。
高考英语满分作文模板——图画图表描述段(精)

高考英语满分作文模板——图画/图表描述段
【示例一】
①From the picture (graph, chart, table, pie, bar), we know that ________(图表内容总概括). ②On the one hand, the left/first picture tells us that ________(情况一,图一/表一的内容). ③On the other hand, (the right/second)picture informs us that ________(情况二,图二/表二的内容).④It ca n easily be seen that ________(揭示图画/表寓意).
【示例二】
①As is vividly shown/described/depicted in the cartoon/picture, ________(图表内容总概括).②In the first picture, ________(描述图/表一内容,如果是一个表,则可左或上半部分).③As is shown in the second drawing/picture, ________(描述图/表二内容,如果是一个表,则右或下半部分).④It is safe to draw the conclusion that ________(提示寓意,或主题句,回应主题但不是主题句的重复).
我要投稿。
高考英语作文(图表+对比例文)

【例析1】请你根据下表提供的信息写一篇题为Changes in Chinese People’s Diet的短文。
短文可分为三小节:1)state the changes in people's diet in the past five years;2)explain the changes and give possible reasons ;3)draw your own conclusions.注意: 1. 不要过多引用数据; 2. 词数100左右。
分析:本统计表描述中国人民从2001年至2005年饮食结构的变化。
Grain, the main food of the most people in China, is now playing a less important role. The amount of fruit and vegetables in the average people’s diet has also dropped by 1.5 percent from 2001 to 2005. The amount of milk and meat has increased.The changes in diet can be explained by several reasons. For one thing, with the development of the economy, people can afford to buy better foods. For another, people have realized the importance of a balanced diet.In a word, the changes are the signs of the improvement in people’s lives. There is no doubt that there will be great changes in people’s diet in the future.最近,关于“高中是否取消文理分科”的网上调查吸引了26万余名网民的积极参与。
高考英语模板

高考英语模板一、图表作文模板。
Recently, there has been a growing concern/interest in the issue of (图表主题). According to the (图表来源), it is clear that (图表内容概述). The reasons for this phenomenon can be various.To begin with, (图表细节一). This can be attributed to the fact that (进一步解释). In addition, (图表细节二). This is because (进一步解释). Last but not least, (图表细节三). This is mainly because (进一步解释).In conclusion, (总结观点). Therefore, it is high time that we (建议措施). Only in this way can we (展望未来).二、观点对比模板。
Nowadays, there is a heated debate over the issue of (观点对比主题). Some people believe that (观点一). On the other hand, others argue that (观点二). Both sides have their own reasons.Those who support (观点一) have their reasons. Firstly, (观点一支持理由一). In addition, (观点一支持理由二). Therefore, they believe that (观点一总结观点).On the contrary, those who advocate (观点二) also have their reasons. To begin with, (观点二支持理由一). Furthermore, (观点二支持理由二). Hence, they hold that (观点二总结观点).In my opinion, (个人观点). Therefore, it is important that we (建议措施). Only in this way can we (展望未来).三、议论文模板。
英语高考作文图表类

英语高考作文图表类In the chart, we can see that the number of people using smartphones has been increasing steadily over the past decade. This trend is not surprising, considering the convenience and versatility that smartphones offer in our daily lives.Looking at the data, it is clear that the younger generation is the most avid users of smartphones. This is understandable, as they have grown up in a digital age where smartphones are an integral part of communication and social interaction.Interestingly, the chart also shows that the use of smartphones varies among different regions. While urban areas tend to have higher smartphone usage rates, rural areas are catching up as technology becomes more accessible and affordable.One striking point to note is the impact of smartphoneusage on traditional forms of communication. With the riseof messaging apps and social media platforms, people are increasingly relying on their smartphones to stay connected, leading to a decline in face-to-face interactions and phone calls.Despite the concerns about smartphone addiction and its negative effects on mental health, it is undeniable that smartphones have revolutionized the way we communicate and access information. As technology continues to advance, it will be fascinating to see how our relationship with smartphones evolves in the future.。
上海高考英语作文分类训练:图表作文
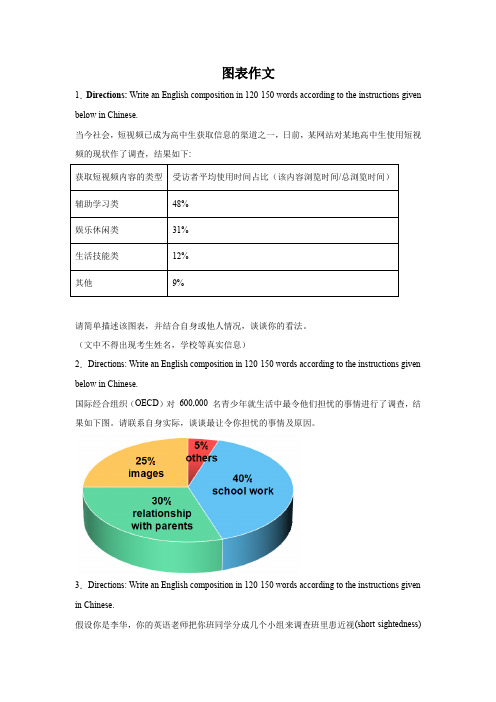
图表作文1.Directions: Write an English composition in 120-150 words according to the instructions given below in Chinese.当今社会,短视频已成为高中生获取信息的渠道之一,日前,某网站对某地高中生使用短视频的现状作了调查,结果如下:请简单描述该图表,并结合自身或他人情况,谈谈你的看法。
(文中不得出现考生姓名,学校等真实信息)2.Directions: Write an English composition in 120-150 words according to the instructions given below in Chinese.国际经合组织(OECD)对600,000 名青少年就生活中最令他们担忧的事情进行了调查,结果如下图。
请联系自身实际,谈谈最让令你担忧的事情及原因。
3.Directions: Write an English composition in 120-150 words according to the instructions given in Chinese.假设你是李华,你的英语老师把你班同学分成几个小组来调查班里患近视(short-sightedness)的同学的人数和原因。
你们小组调查后做了如下图所示的统计,请分析下面的饼状图,并谈谈你的看法及建议。
注意:1. 词数100左右;2. 可以适当增加细节,以使行文连贯。
_______________________________________________________________________________ _______________________________________________________________________________ _______________________________________________________________________________ _______________________4.Directions: Write an English composition in 120-150 words according to the instructions given in Chinese.下列图表反映的是某高中2010年与2013年学生健康状况调查的部分数据,请你用英语为某报写一份报告,反映你校三年间学生健康状况的变化情况,分析其中原因,并提出一些改进措施。
新高考英语写作精讲+写作模板: 图表类写作 (原卷)
专题08图表类写作-新高考英语写作精讲+写作模板距离高考还有一段时间,不少有经验的老师都会提醒考生,愈是临近高考,能否咬紧牙关、学会自我调节,态度是否主动积极,安排是否科学合理,能不能保持良好的心态、以饱满的情绪迎接挑战,其效果往往大不一样。
以下是本人从事10多年教学经验总结出的以下学习资料,希望可以帮助大家提高答题的正确率,希望对你有所帮助,有志者事竟成!养成良好的答题习惯,是决定高考英语成败的决定性因素之一。
做题前,要认真阅读题目要求、题干和选项,并对答案内容作出合理预测;答题时,切忌跟着感觉走,最好按照题目序号来做,不会的或存在疑问的,要做好标记,要善于发现,找到题目的题眼所在,规范答题,书写工整;答题完毕时,要认真检查,查漏补缺,纠正错误。
总之,在最后的复习阶段,学生们不要加大练习量。
在这个时候,学生要尽快找到适合自己的答题方式,最重要的是以平常心去面对考试。
英语最后的复习要树立信心,考试的时候遇到难题要想“别人也难”,遇到容易的则要想“细心审题”。
越到最后,考生越要回归基础,单词最好再梳理一遍,这样有利于提高阅读理解的效率。
另附高考复习方法和考前30天冲刺复习方法。
2.(改编自2022春·河南安阳宝丰县第一高级中学校高三联考)假期社区活动你调查了某科技企业人员构成,请参照下列图表将调查结果发表在学校英文报上。
内容包括:1.调查结果概述;2.对人员构成做出评价;3.对此现象提出看法。
注意:1.词数100左右;2.短文的题目和首句已为你写好。
参考词汇:大学本科生Undergraduate 大学专科生Junior college students硕士生Master studentPersonnel Composition of an EnterpriseNowadays, with the high demand of skills in the enterprise, there is an increase in the advanced workers with a higher diploma.________________________________________________________________________________________ ____________________________________________________________________________________________ ____________________________________________________________________________________________ ____________________________________________________________________________________________ ____________________________________________________________________________________________ ____________________________________________________________________________________________ ____________________________________________________________________________________________ ______________________________________________________2.(改编自2022春·河南郑州郑州外国语学校高二期中)目前,网络语言(Internet Slang)在青少年中极为盛行,你校学生会在同学中就对网络语言的看法进行了调查,调查结果见下面饼状图(pie chart)。
高考英语图表作文
高考英语图表作文In the first chart, we can see the comparison of the average temperatures in different seasons. It's quite interesting to note that the temperature in summer is significantly higher than in the other seasons. This is probably due to the strong sunlight and longer days during the summer months.Moving on to the second chart, it shows thedistribution of rainfall throughout the year. What's striking is that there is a clear peak in rainfall during the spring season, which gradually decreases as we moveinto summer. This could be attributed to the change in weather patterns and the transition from spring to summer.Looking at the third chart, it illustrates the fluctuation of air quality index over the course of a year. It's evident that the air quality is at its worst during the winter months, possibly due to increased pollution from heating and reduced air circulation. On the other hand, theair quality improves during the summer, which could be attributed to better weather conditions and reduced pollution.Lastly, the fourth chart presents the variation in daylight hours throughout the year. It's apparent that the longest days occur in the summer, while the shortest days happen in the winter. This is a natural phenomenon caused by the tilt of the Earth's axis and its orbit around the sun.In conclusion, these charts provide valuable insights into the seasonal changes in temperature, rainfall, air quality, and daylight hours. It's fascinating to observe the different patterns and fluctuations that occur throughout the year.。
英语高考作文图表题范文
英语高考作文图表题范文【篇一:英语图表作文范文】提纲图表式作文属于控制性写作的范畴。
它控制性强,便于评分。
考生应仔细分析图表,引证典型数据并按提纲要求进行取材与构思。
1. 例:title: changes in peoples dietoutline:1. state the changes in peoples diet in the past five years.2. give possible reasons for the changes.3. draw your own conclusions.study the following table carefully and your composition must be based on the information given in the table. you shouldquote as few figures as possible.yearfood 1997 1998 1999 2000 2001grain 53% 47% 42.5% 40% 34%milk 10% 11% 11% 12% 13%meat 17% 20% 22.5% 23% 26%(fruit20%22%24%25% 27%and vegetables)total 100% 100% 100% 100% 100%in the past five years, there have been remarkable changes in people’s diet. according to the figures given in the table, grain, which used to be the main food for most of the chinese people, has now become less important. by contrast, the consumption of milk and meat has considerably increased, accounting for 13% and 26% of the total respectively in 2001. in the same way, the demand for fruit and vegetables has been on the rise.what caused these changes? i think there are at least two reasons. in the first place, with the implementation of thereform and opening-up policy, great changes have taken place in all the branches of our national economy. the rapid growthin industrial and agricultural production has inevitably brought about a sharp rise in living standard. people now can afford a diet higher in protein and lower in carbon-hydrates. that is why the consumption of milk and meat has remarkably increased in the city and in the country. secondly, more attention is nowpaid to the balanced diet, which is necessary for good health.as a consequence, vegetables and fruit that are rich invitamins have been in ever-rising demand.i n conclusion, with the change in people’s diet the consumption of fruit, vegetables, milk and meat will gradually increase, while that of grain will continue to decline.〔例2〕directions: for this part,you are allowed 30 minutes to write a composition of no less than 100 words on income sources between chinese and american students.study the following table carefully and your composition must be basedon the in formation given in the table. write three paragraphs to: 1. describe the differences of the income sources between chinese and american students.2. analyze possible reasons for these differences.3. predicate future tendency.source of income percentageof total incomeparentspart?time jobfellowship orscholarshipamerican students50%35%15%chinese students90%5%5%〔范文〕income sources between chinese students and american studentsincome sources of chinese students are quite different from those of american students. in china, students get 90% of their money from their parents while in america, only 50% ofstudents` money is provided by parents. in addition, chinese students earn only 5% of their money from part time jobs and 5% from fellowship or scholarship while income from these two resources for american students takes up 35% and 15% respectively of their total income.i think there are probably three reasons for their differences. first, because of the influence of different social and family values,chinese students have formed the habit of asking for money from their parents while american students have developed more sense of being financially independent. second, most chinese parents devote too much care to their children and they would rather save up to afford theirchildren?s education rather than encourage them to take part?time jobs.but in america, many parents pay more attention to developing the students? ability of self?reliance,so they encourage their children to find part?time job to earn some money by themselves. third, since america is more developed than china,it is relatively easy for students to find part?time jobs.in china,such opportunities are rather rare.i believe with the development of china, more and more chinese students will realize and pay more attention to the necessity of self?dependence. in addition, more and more opportunities will be provided for them to take part?time jobs. so more students will go out of the ivory tower to broaden their knowledge and to become the master of their own lives.作者在这篇图表作文中很好地利用了图表以及题目中所给的提示,文章结构完整,意思表达清楚,较好地完成了一篇图表作文所应该表达的内容。
高考图表类英语作文
高考图表类英语作文In the chart, we can see that the number of people using smartphones has been increasing steadily over the years. This trend is not surprising considering the rapid advancements in technology and the increasing accessibility of smartphones to people of all ages.Looking at the data, it is clear that younger people are more likely to use smartphones compared to older generations. This could be due to the fact that younger individuals are more tech-savvy and are more likely to embrace new technologies compared to their older counterparts.One interesting point to note is the difference in smartphone usage between urban and rural areas. It seems that people living in urban areas are more likely to use smartphones compared to those living in rural areas. This could be attributed to the fact that urban areas generally have better access to technology and more resourcescompared to rural areas.Another interesting observation from the chart is the difference in smartphone usage between different income groups. It appears that individuals with higher incomes are more likely to own and use smartphones compared to those with lower incomes. This could be due to the fact that smartphones are considered a luxury item and individuals with higher incomes are more likely to afford them.Overall, the data from the chart paints a clear picture of the increasing prevalence of smartphones in our society. It is evident that smartphones have become an integral part of our daily lives, with more and more people relying on them for communication, entertainment, and information. As technology continues to advance, it will be interesting to see how smartphone usage continues to evolve in the future.。
- 1、下载文档前请自行甄别文档内容的完整性,平台不提供额外的编辑、内容补充、找答案等附加服务。
- 2、"仅部分预览"的文档,不可在线预览部分如存在完整性等问题,可反馈申请退款(可完整预览的文档不适用该条件!)。
- 3、如文档侵犯您的权益,请联系客服反馈,我们会尽快为您处理(人工客服工作时间:9:00-18:30)。
图表式作文It is obvious in the graphic/table that the rate/number/amount of Y has undergone dramatic changes. It has gone up/grown/fallen/dropped considerably in recent years (as X varies). At the point of X1, Y reaches its peak value of ...(多少).What is the reason for this change? Mainly there are ... (多少) reasons behind the situation reflected in the graphic/table. First of all, ...(第一个原因). More importantly, ...(第二个原因). Most important of all, ...(第三个原因).第一段:The table/graph/chart shows, as far as ______(is/are)concerned, _______________________.第二段:(第二段分为三种情况:1、一直上升;2、一直下降;3、一部分上升,一部分下降。
下面针对这三种情况进行结构模仿)。
1、(以1978年到1998年城镇乡村收入的稳步较长图为例)。
a.一直上升According to the figures show in the graph, we can see that________, had been increasing at a steady rate from the year of 1978 to 1998. In addition, during the period, ____________had raise from 349.9 Yuan to 5425 Yuan, morethan 5 times .Meanwhile, _______had also grown from 133.6 Yuan to 2100 Yuan.b. 一直下降According to the figures show in the graph, we can see that___________, had been decreasing at e steady rate from the year of 1978 to 1998. In addition, during the periond,____________had reduced from 349.9 Yuan to 5425 Yuan, more than 5 times .Meanwhile ,_______had also gone down 133.6 Yuan to 2100 Yuan.2、[以从1995年到1999年西安人的日常生活支出(食物、服装和娱乐)的变化为例]c. 一部分上升,一部分下降:According to the figures in the graph, we can see that__________had been increasing by 9% and 7%, respectively from the year of 1995 to1999. However,___________(the expenses on food)had been decline by30% ,during the same period. The statistics of rise and fall seem to exist in isolation but closely to one another. 第三段:There are several reasons for that phenomenon. On the hand, _____;On the other hand,_________,___________.注:横线部分为自己需填充的内容,这只是整篇文章的格式,红色横线部分视考题而定,可填充的内容经济类/发展类/旅游类/文化交流类:1. The policy of reformation and opening spreader widely in China should be taken into account firstly, when considering the reason for the steady increase of the citizen's income.2. The people of China has the spirit of working hard in order to improve their living.3. China's rapid economic development lays the base.4. In the past twenty five years, remarkable changes have taken place in China's tourism rank in the world.5. The economy of China has developed so fast in twenty years that China now becomes more and more important in the world.6. I'm confident that with the development of China the numbers of visitors and the foreign exchange earrings will certainly continues to increase in the future.7. With the rapid development of technology and the global economy ,the world is becoming international, cultural exchanges are becoming more and more frequent ,which is inevitably improving our mutual understanding and friendship with other countries.食品类:1、In order to live a healthy long life, we have to restrict our calorie intake eating the food with less fat.2、We should make our diet more nutritional and balance the calorie intake to enjoy a healthy life.3、To improve the bad situation, people should eat calcium-enriched food, such as fish,milk,beancurd and so on . 娱乐类/体育类:如看书/看电视1、We should make a balance between them to benefit themselves.2、The age in which we live now is an information one.3、People should go to the gym and take part in some sports, such as basketball, volleyball, swimming and so .All the exercise help people keep healthy.友谊类/文化交流类:1、People all over the world love and respect each other. The best way to show our love is to help others when they are in difficulties.2、Everyone should be encouraged required to try to be self-reliant.3、When one in trouble, others should help him.PS:经典句子:1、Scientists have warned that unless effective measures are taken, the problem of pollution will eventually get out of hand.2、For citizens ,they are supposed to conform to rules and regulations of the traffic.3、And the government should educate people in this respect ,which will draw people's attention of the serious problem.4、For drivers their speed should be restricted . Otherwise, they should be punished severely.5、It is time the anchorites concerned took proper steps the traffic problem.6、As long as each of us takes actions. I deeply believe the problem will be well resolved to an extend作文中可用的谚语或句子:As a saying goes:俗话说1、A good beginning is half done. 良好的开端是成功的一半。
2、An hour in the morning is worth two in the evening. 一日之计在于晨。
3、A good idler ,an old beggar. 少壮不努力,老大徙伤悲。