股票市场与经济增长文献综述及外文文献资料

本份文档包含:关于该选题的外文文献、文献综述
一、外文文献
标题: Impact of Stock Market Structure on Intertrade Time and Price Dynamics
作者: Ivanov, Plamen; Yuen, Ainslie; Perakakis, Pandelis
期刊: International Review of Financial Analysis (V olume 9 2014): 207-219
年份: 2015
Impact of Stock Market Structure on Intertrade Time and Price Dynamics
Introduction
The impact of market structure and associated rules of operation on market efficiency and stock price formation have attracted considerable public attention [1]. Developments on the New York Stock Exchange (NYSE) [1], [2], have raised the profile of the market operating mechanism, the "market structure", employed by a stock market. This has also been of concern to those involved in stock market regulation, on behalf of investors [1], [3], since optimizing market structure results in more effectively functioning markets [4] and increases competitiveness for market share in listed stocks [5]. The two major stock markets in the U.S., the NYSE and the National Association of Securities Dealers Automated Quotation System (NASDAQ) National Market have very different structures [6], [7], and there is continuing controversy over whether reported differences in stock price behavior are due to differences in market structure or company characteristics [8]. Comparative studies of the NYSE and NASDAQ have primarily focused on stock prices to provide evidence that market organizational structure affects the price formation process [4], [9], [10]. It has been shown that stocks registered on the NASDAQ may be characterized by a larger bid-ask spread [11] and higher price volatility [4], [9], [10]. However, this is often attributed to the market capitalization, growth rate or the nature of the companies listed on the NASDAQ [8]. Empirical studies have also emphasized the dominant role and impact of trading volume on prices [12], [13]; since traded volume is determined by investors it is difficult to isolate the effects of market structure on
price formation. As the influence of market structure on stock prices may be obscured by exogenous factors such as demand and supply [12], [13], we hypothesize that modulation of the flow of transactions due to market operations may carry a stronger imprint of the internal market mechanism.
Here we analyse times between consecutive transactions for a diverse group of stocks registered on the NYSE and NASDAQ markets, and we relate the dynamical properties of the intertrade times with those of the corresponding price fluctuations. To understand how market structure may affect stock prices, we study the information contained in the times between consecutive stock transactions. As market-specific operations may modulate the flow of transactions, we hypothesize that dynamical features of transaction timing reflect the underlying market mechanism. Specifically, we ask if stocks of companies with diverse characteristics registered on a given market exhibit common features in their transaction timing, which may be associated with the particular market structure. Further, we investigate how the dynamical properties of transaction timing over a range of time scales relate to stock price dynamics and whether market structure affects the temporal organisation of price fluctuations.
To probe how market structure influences the trading of stocks, we consider the two major U.S. stock markets, the NYSE and the NASDAQ. All transactions on the NYSE of a given stock are centralised and are controlled by a single human operator called a "specialist", whose primary role is to match together public buy and sell orders on the basis of price, in an auction-like setting [6]. The NYSE specialist is under obligation to maintain both price continuity and a "fair and orderly market" [6], as well as to intervene, using his own firm's inventory of available stock, to provide liquidity in the event of an order imbalance, thus preventing sharp changes in the stock price [6]. The NYSE regulations allow for considerable flexibility within the specialist's operations [2].
In contrast, trading on the NASDAQ is decentralised, with trading in a given stock managed by a number of dealers called "market makers". These market makers maintain a stock inventory, posting their best prices at which they are prepared to
immediately buy and sell stock [7]. Market makers compete with each other for orders, so in theory competition ensures that investors get the best prices. Alternatively, an order can be placed into an Alternative Trading System (ATS), operated by NASD members or NASD-member affiliates and designed to allow two subscribers to meet directly on the system under the regulation of a third party. The most commonly used form of ATS is the Electronic Communication Network (ECN), a facility that matches customer buy and sell orders directly through a computer network.
A third alternative, in case the order placed is very small, is to enter the order into the Small Order Execution System (SOES), which is an electronic network designed to allow fast automatic routing, execution and reporting of orders of 500 shares or less. Orders are automatically routed to market makers whose quotes are currently identical to the highest bid (buy) and the lowest offer (sell) prices. Participation in the SOES system was made mandatory [7] after the market crash of October 1987, as one of the reported problems on the NASDAQ during the crash was the inability to reach market makers by the phone during periods of rapid price movement.
To summarize the differences between the two market structures, each market maker on the NASDAQ maintains his own inventory of stock in order to buy and sell [7]. In comparison, the NYSE specialist rarely uses his own firm's inventory: such transactions involve less than 15% of trading volume [14]. Although several regional exchanges may trade NYSE listed stocks, price formation has primarily been attributed to NYSE trading [15]. In contrast, the NASDAQ market relies on competition between multiple dealers for public orders to facilitate the price formation process [11]. Moreover, a substantial fraction of share volume on the NASDAQ is not handled by dealers, but is traded electronically via networks for small public orders and for institutional investors [7]. Such fragmentation of the NASDAQ stock market has been associated with higher price volatility [4].
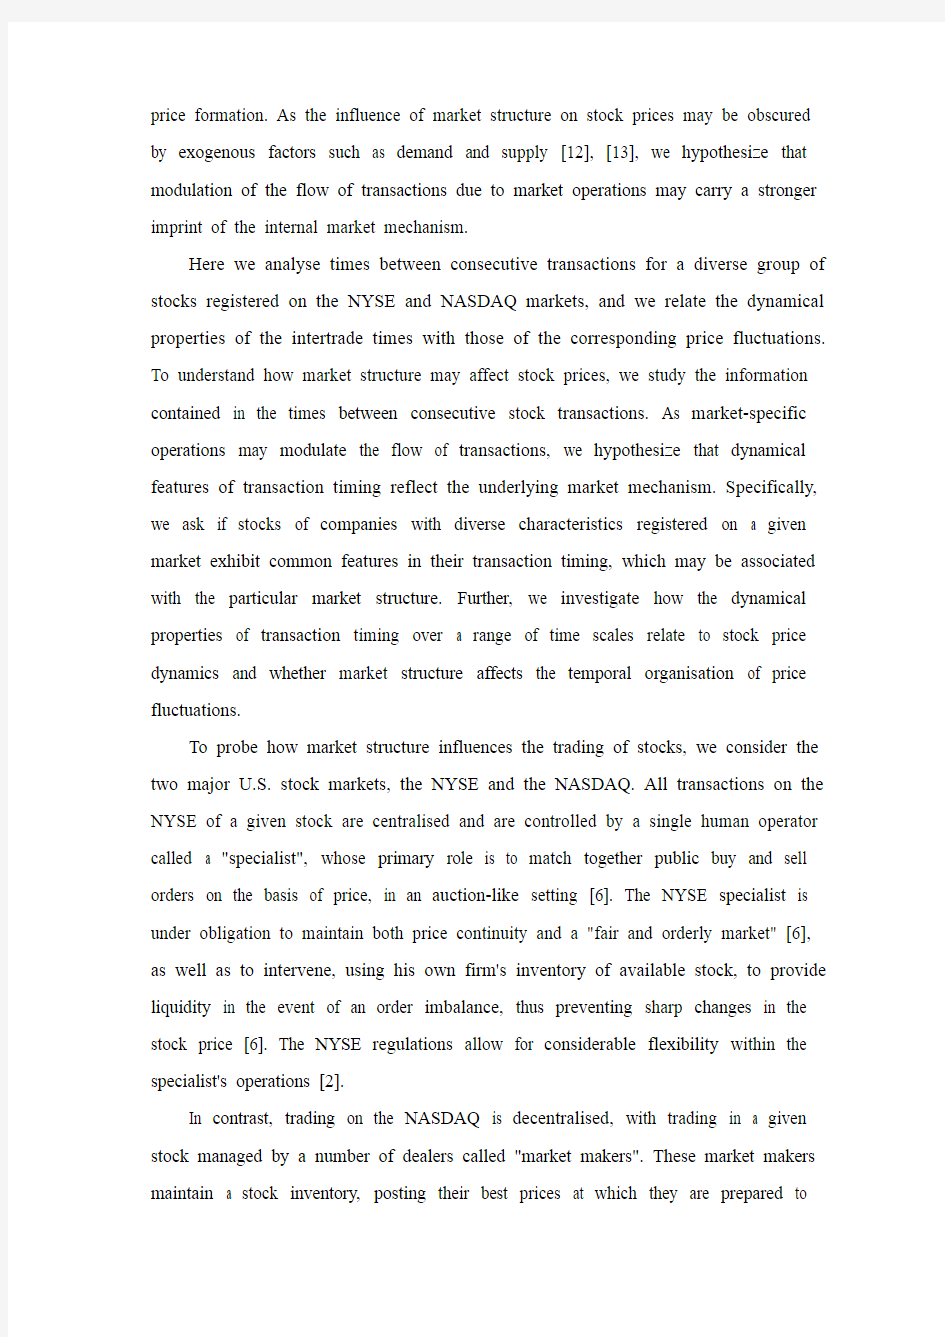
Here we ask to what extent such structural and operational differences between the NYSE and NASDAQ markets affect the flow of transactions. It is difficult to answer whether differences in intertrade times are due to individual company
characteristics or external market influences (Fig. 1). Two empirical studies have considered only a single company stock over a short period of a few months [16], [17]. Studies which considered a larger group of stocks either did not find common features in the intertrade times [18], [19] or did not compare between markets [20]-[22]. The only comparative study considered a single NYSE and a single Paris stock, finding some differences in their intertrade times, but those may well be due to a different culture of trading [23]. To probe for evidence of the impact of market structure on the trading of stocks, we employ concepts and methods from statistical physics to investigate the correlation properties of transaction timing for diverse companies, over time scales ranging from seconds up to a year.
Figure 1. Relationship between stock price and trading activity.
Representative example of time series derived from the Trades and Quotes (TAQ) database for transactions of stock in Compaq Computer Corp. (CPQ) registered on the NYSE. (a) Price of CPQ stock over a three week period from 20 Feb.- 8 Mar. 1996 (42606 trades). On 1 Mar. 1996 Compaq reported that it would cut product prices in order to meet sales targets, leading to a drop in the stock price. (b) Intertrade times (ITT) of CPQ stock over the same period. Data exhibit complex fluctuations, a daily pattern of trading activity (with short ITT at the open and close of a trading day and longer ITT in between), and highly heterogeneous structure, as seen in the flurry of trades following the price drop. The relaxation time of the ITT response following the price drop extends over several days, suggesting that information may be contained in the temporal structure of trading activity. Data include transactions occurring between 9.30am and 4pm EST, excluding weekends and holidays.
Data
We examine one hundred stocks listed on the NYSE, from eleven industry sectors: Technology-Hardware(5), Semiconductors(2), Pharmaceutical & Medical Equipment(10), Financial(8), Automotive(9), Defense/Aerospace(9), Mining, Metals & Steel Works(8), Chemicals & Plastics(7), Retail & Food(17), Petroleum, Gas & Heavy Machinery(10), Telephone Service Providers(7), Electric & Power Services(8). We study the time intervals between successive stock trades, over a period of four
years-4 Jan. 1993 to 31 Dec. 1996-as recorded in the Trades and Quotes (TAQ) database from the NYSE (Table 1).
Table 1. Characteristics of one hundred NYSE stocks studied over the period 4 Jan. 1993-31 Dec. 1996.
We also analyse one hundred NASDAQ stocks from fourteen industry sectors: Technology-Hardware(28), Technology-Software(16), Semiconductors(7), Pharmaceutical, Biotechnology & Medical Equipment(12), Financial(5), Automotive(1), Steel Works(1), Chemicals(1), Retail & Food(16), Petroleum, Gas & Heavy Machinery (2), Telephone & Cable Television Service Providers(5), Services(2), Transportation(3), Electrical Apparatus(1). We study the time intervals between successive stock trades as recorded in the TAQ database, for twenty-nine companies over the period 4 Jan. 1993-31 Dec. 1996, and seventy one companies over the period 3 Jan. 1994-30 Nov. 1995 (marked with (*) in Table 2). For both markets, we select companies with average market capitalisations ranging over three decades, and varying levels of trading activity with average values of intertrade time between 11 and 640 seconds for NYSE stocks, and between 5 and 680 seconds for NASDAQ stocks. In parallel with the intertrade times, we analyse the prices for both sets of stocks over the same periods.
Table 2. Characteristics of one hundred NASDAQ stocks studied; data covers twenty nine companies over the period 4 Jan. 1993-31 Dec. 1996, and seventy one companies (marked with *) over the period 3 Jan. 1994-30 Nov. 1995.
Method
Like many financial time series the intertrade times (ITT) are inhomogeneous and nonstationary, with statistical properties changing with time, e.g. ITT data exhibit trends superposed on a pattern of daily activity [24]. While ITT fluctuate in an irregular and complex manner on a trade-by-trade basis, empirical observations reveal that periods of inactive trading are often followed by periods of more active trading (Fig. 1). Such patterns can be seen at scales of observation ranging from minutes to months, suggesting that there may be a self-similar, fractal structure in the temporal organisation of intertrade times, independent of the average level of trading activity of
a given stock [24].
To probe for scale-invariant features in the fluctuations of intertrade times, we apply the detrended fluctuation analysis (DFA) method, which has been shown to detect and accurately quantify long-range power-law correlations embedded in noisy non-stationary time series with polynomial trends [25]. We choose this method because traditional techniques such as power spectral, autocorrelation and Hurst analyses are not suited to nonstationary data [26]. The DFA method (DFA-) quantifies the root-mean-square fluctuations of a signal at different time scales , after accounting for nonstationarity in the data by subtracting underlying polynomial trends of order ().
A power-law functional form indicates self-similarity and fractal scaling in the ITT time series. The scaling exponent quantifies the strength of correlations in the ITT fluctuations: if there are no correlations, and the signal is uncorrelated random noise; if the signal is anti-correlated, meaning that large values are more likely to be followed by small values; if there are positive correlations and the signal exhibits persistent behaviour, where large values are more likely to be followed by large values and small values by small values. The higher the value of , the stronger the correlations. The DFA method avoids the spurious detection of apparent long-range correlations that are an artifact of polynomial trends and other types of nonstationarities [27]-[30].
Results
We find that the ITT series for all stocks on both markets exhibit long-range power-law correlations over a broad range of time scales, from several trades to hundreds of thousands of trades, characterised by a scaling exponent (Fig. 2 and Fig.
3). For all stocks on both markets we observe a crossover in the scaling curve from a scaling regime with a lower exponent over time scales less than a trading day, to a scaling regime with an exponent (stronger positive correlations) over time scales from days to almost a year.
[Figure omitted, see PDF]
Figure 2. Root-mean-square fluctuation function obtained using DFA-2 analysis, for the intertrade times (ITT) of stock in NASDAQ company Sun Microsystems
(SUNW) and NYSE company Compaq Computer Corp. (CPQ).
Here indicates the time scale in number of trades. We normalize the time scale by the daily average number of trades for each stock, so that a unit normalized scale indicates one trading day (marked by a dashed line). The scaling curves are vertically offset for clarity. While both companies have similar market capitalisations, industry sectors and average levels of trading activity (average ITT) and exhibit long-range power-law correlations over a broad range of scales, the scaling behaviour of the intertrade times for the two stocks is quite different. For CPQ we find a pronounced crossover from weaker correlations over time scales smaller than a day, to stronger correlations over time scales larger than a trading day (). In contrast, the scaling function for SUNW does not exhibit such a crossover, and we find much stronger correlations over time scales smaller than a trading day compared with CPQ ().
[Figure omitted, see PDF]
Figure 3. Different correlation properties in intertrade times for stocks registered on the NYSE and NASDAQ markets.
Correlation exponents and characterising the temporal structure in ITT for (a) one hundred NYSE stocks and (b) one hundred NASDAQ stocks, of companies with a broad range of market capitalisations and industry sectors. Stocks are ranked in order of decreasing average value of ITT () (as in Tables 1 and 2), and are split into subsets (marked by vertical dashed lines) of companies with matching , and with approximately equal number of stocks in each subset. We estimate over scales from 8 trades to half of the daily average number of trades (for stocks with fewer than trades/year), and to a third of the daily average number of trades (for stocks with more than trades/year). We estimate over scales from 3 to 100 times the daily average number of trades. Group averages and standard deviations of and are shown to the right of the panel for each market. Systematically higher values of for the NASDAQ stocks as compared to the NYSE stocks (statistically significant difference with p-value by Student's t-test), suggest an underlying influence of market structure on the temporal organisation of intertrade times over scales within a trading day. In contrast, no systematic differences between the two markets are observed in the values of ,
characterising correlation properties of intertrade times over scales above a trading day ( by Student's t-test). We find similar results when we analyse trading activity at high resolution in terms of the number of trades per minute: a crossover at one trading day and stronger correlations for NASDAQ stocks compared to NYSE stocks over time scales less than a day (features which were not observed in previous studies [52], [50]). We further observe an increasing trend in the values of and with decreasing and increasing company capitalisation for the companies on both markets.
Further, we find that this crossover is systematically more pronounced for NYSE stocks compared to NASDAQ stocks (Fig. 2 and Fig. 3). Characterising ITT fluctuations over time scales less than a day, we find that NASDAQ stocks exhibit statistically stronger correlations than NYSE stocks as indicated by Student's t-test (, ), with significantly higher average value of the exponent (group mean std. dev.) as compared to (Fig. 3). In contrast, over time horizons above a trading day, we find that the correlation properties of ITT on both markets are statistically similar (, ), with average scaling exponent comparable with (Fig. 3). Values for the scaling exponents and for the companies on the NYSE and NASDAQ markets are shown in Table 1 and Table 2 respectively.
We next investigate how the correlation properties of ITT depend on the average level of trading activity, and if this dependence differs with market structure. Since both sets of a hundred stocks that we study on the NYSE and NASDAQ markets encompass a range of average trading activity spanning over two decades, we split both sets into six subsets with matching average ITT () and approximately equal numbers of stocks in each subset (Fig. 3a,b). Within each market we find that over time scales less than a day, the correlation exponent characterising the trading dynamics is larger for stocks with higher trading activity (lower ) and correspondingly higher market capitalisation (Fig. 3a,b and Fig. 4a). Surprisingly, this dependence persists also for , characterizing the dynamics over much longer time scales, ranging from days to months (Fig. 4b). For NYSE stocks we find a logarithmic dependence of and on (subsequent to posting this manuscript on the Los Alamos archive [31], this logarithmic dependence was later confirmed in [32] on a different set of NYSE
stocks). This dependence does not appear to hold for NASDAQ stocks (Fig. 4).
[Figure omitted, see PDF]
Figure 4. Comparing long-range correlations in ITT for groups of stocks with varying average levels of trading activity on the NYSE and the NASDAQ.
(a) Dependence of exponent , characterizing the strength of correlations in ITT over scales from seconds up to a trading day, on the average level of trading activity. Each datapoint represents the group average over a subset of stocks, with a matching range of average intertrade times for the two markets. Stocks are grouped into subsets as indicated by vertical dashed lines in Fig. 3a,b. The consistent difference in the scaling exponent between NYSE and NASDAQ stocks suggests that independent of company characteristics such as market capitalization and industry sector, the temporal organization of ITT within a trading day carries an imprint of market structure. (b) Dependence of exponent characterizing correlations in ITT over time scales from a trading day to several months, on the average level of trading activity. On both markets we observe similar behavior with no systematic difference in the values of between NYSE and NASDAQ subsets of stocks with matching ranges of . These results suggest that over time horizons longer than a trading day, the impact of market structure on trading dynamics is less pronounced as more information is available to investors over longer time scales, driving their trading activity. The resulting more coherent behavior of investors is reflected in stronger correlations over longer time scales.
We then compare the scaling behaviour of ITT for each subset of NASDAQ stocks with the corresponding subset of NYSE stocks with matching . We find that for each subset the average correlation exponent for the NASDAQ stocks is significantly higher compared to the NYSE stocks (all values ; Fig. 4a). We also find that there is no significant correlation between the differences in each subset and the , as indicated by Pearson's test (, ). These observations show that within a trading day the difference in the correlation properties of intertrade times of NYSE and NASDAQ stocks is independent of the average level of trading activity. In contrast to , there is no systematic difference in the values of the average for NASDAQ and NYSE stocks for
subsets with matching (all values ; Fig. 4b) except for the subset of companies with the highest frequency of trading (; Fig. 4b).
Since for both NYSE and NASDAQ stocks we have chosen companies representing eleven industry sectors with a broad range of market capitalisations and average levels of trading activity spanning over more than two decades, our findings of (i) a crossover in the scaling behaviour of ITT that is more pronounced for NYSE stocks, and (ii) stronger correlations over intraday time scales of NASDAQ stocks with higher values for compared to NYSE stocks, support our hypothesis that market structure affects the dynamics of transaction timing. However, more established companies listed on the NYSE may be subject to different trading patterns when compared with the younger and more rapidly growing companies on the NASDAQ. To verify that the stronger correlations in ITT over time scales less than a day for NASDAQ stocks are indeed due to market structure, we ask if the scaling properties of ITT systematically change for companies that transfer from the NASDAQ to the NYSE. In particular, we investigate the trading dynamics of ten companies that moved from the NASDAQ to the NYSE around the end of 1994 and the beginning of 1995 (Table 3). For each company, we analyse the ITT time series while the company was registered on the NASDAQ, and then repeat the analysis when the company was on the NYSE.
Table 3. Characteristics of ten stocks that moved from the NASDAQ to the NYSE during the period 3 Jan. 1994-30 Nov. 1995.
For all ten companies we find a significant change in the scaling properties of intertrade times: a marked decrease in the strength of the power-law correlations within a trading day (lower ) associated with the transfer from the NASDAQ to the NYSE (average difference ; Fig. 5b). There is however, no corresponding systematic change in the correlations over time scales above a trading day (average difference ; Fig. 5c), consistent with our findings of statistically similar values of scaling exponent for the two groups of one hundred stocks registered on the NYSE and NASDAQ (Fig.
2 and Fig. 3). Thus, our results indicate that market structure impacts not only trading dynamics on a trade-by-trade basis [19], but also the fractal temporal organisation of
trades over time scales from a few seconds up to a day. The presence of stronger intraday correlations in transaction timing for NASDAQ stocks may be attributed to the multiplicity of dealers (ranging from 2 to 50 per stock during 1994 [11]) and electronic methods of trading (Electronic Communication Networks and the Small Order Execution System [7]), allowing the NASDAQ to efficiently absorb fluctuations in trading activity in almost real time [5]. In contrast, for each stock on the NYSE, while there is the electronic SuperDOT routing system, each order has to be exposed to and compared with outstanding orders, as the single NYSE specialist finds the best bid to match an offer with [6]. This may lead to interruptions in the execution of a rapid succession of trades on the NYSE, resulting in weaker correlations in intertrade times within a trading day.
[Figure omitted, see PDF]
Figure 5. Correlation properties of intertrade times of companies that moved from the NASDAQ to the NYSE.
(a) Fluctuation function , obtained using DFA-2 analysis on ITT of stock in the company Mid-Atlantic Medical Services Inc. while it was on the NASDAQ (3 Jan. 1994-29 Sep. 1994) and then after it moved to the NYSE (30 Sep. 1994-30 Nov. 1995). Here indicates the scale in number of trades and the vertical dashed lines indicate the average daily number of trades while on the NYSE or the NASDAQ. The two scaling curves are vertically offset for clarity. After the move to the NYSE there is a decrease in the correlation exponent at time scales within a trading day and a pronounced crossover to stronger correlations with a higher exponent at larger time scales. (b) characterising fluctuations over time scales less than a trading day in ITT of stock in ten companies that moved from the NASDAQ to the NYSE. Companies are ranked in order of decreasing while on the NYSE (as in Table 3) and the scaling range for is the same as for the hundred NYSE and NASDAQ stocks (Fig. 3a,b). For all companies there is a decrease in after the move to the NYSE, indicating that the transition to weaker correlations in ITT over time scales less than a day is due to the NYSE market structure and not to company-specific characteristics. (c) over time scales extending from a trading day to almost a year. In this case we do not observe
any systematic change when companies move to the NYSE, which is consistent with the finding of statistically similar values of scaling exponent for the two groups of the one hundred stocks registered on the NYSE and on the NASDAQ (Fig. 3a,b).
On the other hand, our finding of stronger power-law correlations for both markets over time horizons from a trading day to several months () suggests that investors' behaviour is more coherent over longer time scales, as information driving trading activity takes time to disseminate. Moreover, this can account for the similar values of for subsets of NYSE and NASDAQ stocks with matched (Fig. 4b), since news and information driving trading activity are exogenous to market structure.
Finally, we investigate if the market-mediated differences in long-range power-law correlations in ITT translate into differences in the scaling behaviour of price fluctuations of stocks registered on the NASDAQ and NYSE markets. To this end, in parallel with ITT we analyse the absolute price returns for each company in our database for both markets. For all stocks we observe a crossover at a trading day in the scaling function of price fluctuations [33], [24], from weaker to stronger correlations, corresponding to the crossover we observe for intertrade times. In addition we find that over time scales less than a day, stocks with stronger correlations in ITT exhibit stronger correlations in absolute price returns (Fig. 6a), as indicated by Pearson's test (, ). In particular, we find that the stronger correlations in ITT associated with the NASDAQ market structure (), are accompanied by stronger correlations in price fluctuations () over time scales within a trading day (Fig. 6a).
[Figure omitted, see PDF]
Figure 6. Relation between correlations in intertrade times and stock price dynamics.
(a) Dependence of exponent characterising power-law correlations in absolute logarithmic price return fluctuations, on correlation exponent characterising intertrade times within a trading day. Data represent one hundred NYSE (Table 1) and one hundred NASDAQ (Table 2) stocks. We calculate price returns over 1-minute intervals and over time scales from 8 to 180 minutes ( half a trading day, which is 390 minutes). The positive relationship between and indicates that stronger correlations in
ITT are coupled with stronger correlations in price fluctuations. This finding suggests that price fluctuations are not merely a response to short-term bursts of trading activity [34], [16]: rather the fractal organisation of price fluctuations over a broad range of time scales is linked to the observed underlying scaling features in the series of intertrade times. (b) Strong relationship between correlations in ITT and correlations in price fluctuations over time scales larger than a trading day for NASDAQ stocks. In contrast, there is no corresponding positive relationship for NYSE stocks. This suggests a weaker coupling between trading dynamics and price formation under the NYSE market structure, over time horizons above a trading day. Dependence of stock price volatility on (c) the correlation exponent and (d) the average value of ITT for the same stocks as in (a). We calculate as the standard deviation of daily logarithmic price returns over six-month periods, averaging over all six-month periods throughout the entire record of each stock. Our results show no strong dependence between stock price volatility and average level of trading activity, rather the volatility appears sensitive to the strength of the temporal correlations in ITT. These findings suggest that scale-invariant features in transaction times may play an important role in price formation. Furthermore, both dynamic and static properties of stock prices appear to be influenced by market-specific features in transaction timing: stronger power-law correlations in ITT (higher values of ) for NASDAQ stocks are matched by stronger power-law correlations in price fluctuations (higher values of ) and higher volatility (), compared with NYSE stocks.
We also find evidence of a positive relationship between correlations in ITT and correlations in price fluctuations over time scales larger than a trading day for NASDAQ stocks (Pearson's test shows statistically significant correlation between with with , ; Fig. 6b). In contrast, there is no corresponding positive relationship between with for NYSE stocks (Pearson's test: , ), suggesting a weaker coupling between trading dynamics and price formation under the NYSE market structure, over time horizons above a trading day. While previous work has suggested that bursts of trading activity have an instantaneous impact on stock prices [19], [34], our results show that the interaction between trading times and price formation is more complex,
where scale invariant temporal patterns in ITT are linked with scaling features of price fluctuations over a broad range of time scales.
We then test whether long-range correlations in ITT are also linked with stock price volatility. Previous studies have reported higher price volatility for NASDAQ stocks compared to NYSE stocks [4], [9], [10]. We find a positive relationship, with stronger correlations in ITT over time scales less than a day related to higher daily volatility (Pearson's test: , ; Fig. 6c). Further, we find that the NASDAQ stocks have higher and correspondingly higher compared to NYSE stocks (Fig. 6c). This relationship may appear to follow from our observation that depends on (Fig. 4a), and previous studies which connect price volatility with periods of high transaction rates [16], [35]. However, for the stocks in our database (Tables 1 and 2), we find no correlation between and average level of trading activity as measured by (Pearson's test: , ; Fig. 6d). Thus the relationship between and suggests that information contained in the microscopic temporal structure of ITT is carried over a range of scales to impact daily price volatility.
Discussion
Understanding the statistical properties of intertrade times and the related underlying mechanism is crucial for the development of more realistic models not only of the flow of transactions [36]-[38], but more importantly to elucidate (i) the relation between intertrade time dynamics and stock price formation [16], [18], [39]-[41], and (ii) how the process of stock price formation is influenced by market structure. In that context, several prior studies have focused not only on the correlation properties, but also on nonlinear features of intertrade times, and on the functional form of their probability distribution. Early studies reported stretched exponential distributions for intertrade times based on data from a single actively-traded stock over a short period of a few months [16], [17], or power-law tailed distributions for rarely-traded 19th century stocks [42] and eurobonds traded in 1997 [43]. While some of these studies have also considered autocorrelations in intertrade times, they have not identified the functional form of these correlations and whether they are persistent or anti-persistent. A first systematic empirical study based
on 30 frequently-traded US stocks over a long period of several years [24] has (i) reported long-range power-law correlations of persistent type with a characteristic crossover to a superdiffusive behavior at time scales above a trading day, and (ii) identified a Weibull functional form for the distribution of intertrade times. In a follow up study based on a different group of US stocks [38], the Weibull functional form was also considered a good fit for the intertrade time distribution, with the Tsallis q-exponential form as an alternative. Further investigations considering the intertrade dynamics of a group of frequently-traded Chinese stocks have shown that the Weibull distribution outperforms the Tsallis q-exponential for more than 98.5% of the data [20]. The long-range power law correlations in intertrade times initially reported for US stocks [24] were also observed for liquid stocks on the Shanghai Stock Exchange [22]. Our results based on 100 NASDAQ and 100 NYSE stocks confirm the presence the long-range power law correlations. The results of these studies, which focus on different markets and different time periods, confirm that the Weibull distribution and long-range power law correlations are stable characteristics of intertrade time dynamics across markets and temporal time scales. Interestingly, similar characteristics were recently reported for commodity dynamics of ancient Babylon (463-72 B.C), and medieval and early modern England (1209-1914 A.D.) markets [44].
It has been recently hypothesized [36] that the dynamics of intertrade times maybe governed by a priority decision-based queuing mechanism [45], [46]. This hypothesis, however, does not appear plausible. First, the priority queuing process proposed in [45] leads to power law distributions for the timing between events, which has been rejected for intertrade times [20], [38]. Second, this queuing process does not generate long-term correlations, contrary to empirical findings for intertrade times of stocks reported in [20], [22], [24], and in the current study comparing stocks on different markets. Moreover, the activity pattern of a single stock broker is not adequately described by a power law, but rather by a power law with a stretched exponential tail [46], which is actually the functional form of the Weibull distribution [24]. Further, it is unlikely that the priority decision-based queuing process underlies
stock market operations, since market agents treat all orders for stock transactions with the same priority no matter how big or small the order, because the objective of market agents is to execute all orders as soon as possible. For this reason, each stock transaction is a minimal time event realization resulting from the competition of a number of market agents with different reaction times-the statistics of minimal events derived from multiple realizations are described by Weibull distributions. Thus, the process of stock market operations is markedly different from the processes governing the dynamics of other human activities, such as web browsing or email exchange that are based on priority queuing [45], [46]. Furthermore, in contrast to priority decision-based processes, intertrade dynamics exhibit nonlinear (multifractral) properties, as first empirically identified in [24] and later confirmed in the framework of multifractal random walks [36].
To summarize, this is the first large empirical study to investigate intertrade times comparing 200 stocks registered on the NYSE and NASDAQ markets representing diverse sectors of the economy, where all stock transactions over a period of four years are included (Table 1 and 2, Figure 2 and Figure 3). This is also the first study to examine changes in the trading dynamics of stocks of companies that moved from one market to the other (Table 2 and Figure 5).
We report that trading dynamics of company stocks are characterized by a scale-invariant temporal organisation of intertrade times which is significantly different for stocks registered on the NYSE and the NASDAQ, indicating that market structure influences the correlation properties of transaction timing. Specifically, we find that intertrade times are more strongly correlated for NASDAQ stocks, when data are analysed over time scales within a trading day, and that this difference is independent of the average level of trading activity of the companies (Figures 2, 3 and 4). In contrast, on time scales above a trading day there is no significant difference in the long-range correlations of companies on the two markets.
Investigating a group of companies that transferred from the NASDAQ to the NYSE, we find that intertrade times exhibit significantly stronger power-law correlations over scales from seconds to a trading day while the companies are on the
NASDAQ (Figure 5). These findings suggest that market structure impacts trading dynamics, not only on a trade-by-trade basis, but over a broad range of time scales. In addition, our results imply that within a trading day the NASDAQ market structure may be more efficient than the NYSE market structure in absorbing rapid variations in trading activity in response to investors' demand [47]. In contrast, on scales above a trading day our results suggest a more coherent behavior of market agents in response to events on larger time scales, thus leading to stronger correlations in intertrade times for the companies on both markets.
Importantly, we also uncover a strong dependence between the scale-invariant features of intertrade times and stock price fluctuations: stocks with stronger correlations in their intertrade times also exhibit stronger correlations in their absolute price returns (Figure 6), indicating an influence of trading activity patterns on the dynamics of price formation. Furthermore, we show that within a trading day absolute price returns, like intertrade times, are more strongly correlated for stocks registered on the NASDAQ market (Figure 6a), and that higher price volatility on the NASDAQ is coupled with stronger correlations in intertrade times (Figure 6c). These findings suggest that market-mediated differences in transaction timing translate into differences in the scaling behavior of stock prices over a broad range of time scales.
Finally, our results do not support the hypothesis of a universal behavior in stock dynamics that is independent of individual company characteristics. In contrast to earlier studies reporting identical scaling exponents for stock price returns, volume and number of trades per unit of time [48]-[52], our findings show a strong dependance of the scaling behavior of intertrade times on the market capitalization and the average frequency of trading of individual companies (Figure 2 and Figure 3), as well as on the market structure where the companies are traded. Recent studies [32], [53] have also demonstrated that stock price returns and volume do not exhibit universal behavior, but rather depend on market capitalization. Our results show that this universality does not hold also because trading dynamics are strongly influenced by market-specific trading operations and market structure. Our results may have implications for the use of transaction timing patterns in the prediction of prices and
risk management on different stock markets. These observations are of interest in the context of the continuing process of optimizing market structure to maintain the efficiency and competitiveness of U.S. stock markets.
二、文献综述
股票市场发展与经济增长文献综述
摘要:近年来出现了很多有关股票市场发展与经济增长关系的理论研究和实证研究。文章对这方面的文献进行了选择性的综述, 并概括了20世纪以来该研究的最新进展与研究动态。
关键词:股票市场;经济增长;文献研究
金融发展包括金融中介发展和股票市场的发展。早期, 即使是在最发达的工业化国家, 股票市场也仅仅是整个金融市场的小部分而已, 虽然有些研究已扩展到股票市场,但对于金融发展与经济增长关系的研究主要还是集中于金融中介(特别是银行体系), 对于股票市场与经济增长的相互作用仅局限于一些概念性的研究。20 世纪90 年代以后, 发展中国家股票市场迅速扩张, 股票市场发展与经济增长的关系受到广泛关注。
一、理论文献综述
金融发展和经济增长之间关系这一主题的理论基础可以追溯到Age hot (1873)和Schumpeter(1912), 他们强调银行部门为经济增长提供所需资金的重要性。Schumpeter认为, 企业家所需资金是生产过程中必不可少的要素,“要想成为企业家, 首先要成为举债者”(Schumpeter, 1912), Gurley 和Shaw(1955)、Patrick(1966)发展了这个理论观点。Goldsmith(1969)的重要贡献在于通过更精确地确定金融机构的作用, 总结出经济体中金融结构能够“加速经济增长和提高经济绩效,使资金流入到最好的使用者手中, 即经济体系中使资金得到最高收益的地方”(Goldsmith , 1969 )。Mick (1973 )和Shaw(1973)进行了进一步的研究, 他们强调金融市场在经济增长中的积极作用, 特别指出政府对银行体系的过多限制减少了投资规模和投资生产率, 阻碍了经济增长, 因此主张解放金融体系以提高投资规模和投资生产率。后来的内生增长理论也强调了金融政策在增长中的作用, 认为金融发展与国家稳定经济增长率相关。
Levine(1996)对股票市场与经济增长的关系做出了详尽的理论综述, 指出股票市场能够通过以下五个途径来影响经济增长;
1 .流动性创造
高收益项目通常需要长期资本投资, 而投资者大都不愿意长时间放弃对储蓄的控制。股票市场的流动性可以让储蓄拥有流动资产(比如股权), 同时公司通过发行股权获得长期资本, 因此股票市场可以改善资本配置, 促进长期经济增长(Levine,1991;Bencivenga, Smith和Star,1996)可另一方面, Smith(1991)指出股票市场的流动性减少了收益的不确定性, 因而会降低储蓄率以至于减缓增长率。
2 .风险分散
Saint Paul(1992), Devereux 和Smith(1994)以及fled(1994)的研究表明股票市场分散风险机制可以使资金由低风险、低收益的投资转向高收益的投资进而促进生产率进步, 影响经济增长。但Devereux 和Smith(1994), fled(1994)同时又指出, 较大的风险分担意味着储蓄水平将因此而下降, 经济增长减缓, 经济福利减少。
3 .公司信息获取
在发达的市场上, 股份转让按牌价进行交易, 那些已得到公司信息的投资者, 能够在信息广泛传播及价格发生变化之前, 按照现行牌价进行交易以获取利益。这激励了投资者去获取公司信息, 有助于资源优化配置和加速经济增长(Grossman 1980 ;Kyle, 1984 )。而Stilts(1985 , 1993)对此持相反观点。他认为发达的股票市场可以通过价格变化迅速披露信息, 这种迅速的披露会降低——而不是鼓励——投资者投入私人资源以获取公司信息。
4 .对公司控制产生影响
Diamond (1982), Jensen 和Murphy(1990)认为发达的股票市场将管理者的收益与股票业绩联系起来, 有助于消除委托——代理问题,提高资源有效配置和经济增长。而且股票市场使公司间的收购更为便捷, 接管的威胁将促使管理者实现公司股权价格最大化(Affront和Tyrol 1988;Scharfsten, 1988)。
5 .储蓄流动性
Greenwood 和Smith(1996)指出, 通过集中储蓄, 股票市场能够增加资源流动性, 促进经济效率和加速长期增长。相反的观点则认为, 在工业化国家, 由于
公司股权融资比重低, 所以股票市场在筹措资金上对于经济增长并不重要(Mayer, 1988)除了Levine (1996)提到的这五个方面, Pretty (1999)又指出, 股票市场使所有权分散, 有利于创造稳定的政治局面, 从而提高经济增长。
二、实证文献综述
为了验证股票市场发展和经济增长之间的确切关系, 在进行理论研究的同时, 学者们也进行大量的实证检验。Goldsmith(1969)对金融发展与经济增长的关系的研究具有开创性的贡献。他通过对35个发达和发展中国家1860——1963年统计数据的分析, 认为“在大多数国家, 如果对近数十年进行考察, 就会发现经济发展与金融发展之间存在着大致平行的关系”。
Ate和Jovanovich(1993)采用72个国家1980 —1988 年的样本数据进行回归分析, 检验股票市场对经济增长的作用。他们发现股票成交总额/GDP 和经济增长存在着很强的正相关, 而且统计上也很显著, 因此得出一国股票市场的相对规模有助于解释随后的人均国内生产总值增长的结论, 支持了股票市场发展对经济增长有积极影响的观点。然而,他们却遭到了Harris(1997)的批评。Harris(1997)指出,在截面模型中使用了滞后投资, 而滞后投资与当期投资不是高度相关的, 因此, 它不能较好地替代后一变量, 会导致剩余变量中省略变量的偏差增大。这样就造成了股票市场的活动水平就与随后的投资有关。系数高估(Harris, 1997)。Harris 用当前投资替代滞后投资, 重新估计了Ate和Jovanovich(的模型, 得出结论:股票市场的增长效应相当弱, 在统计上也不是很显著, 它对经济增长的作用是相当有限的, 特别是对欠发达国家更是如此。
Ross Levine(1996)利用41个国家1986—1993年的数据,采用反映股票市场发展状况的四个指标分别度量股票市场规模, 流动性、集中度、易变性以及国际一体化程度, 他们发现人均实际GDP和股票市场发展之间存在具有很强的正相关关系, 认为股票市场的发展对经济增长非常重要。Marinade(1996)也就金融市场和经济增长的关系进行了实证研究。他把Lucas(1988)、Roomer(1989)、Pagan(1993)的综合金融市场效应的内生增长经济模型作了扩展, 对七个太平洋地区的国家和地区进行估计和检验, 首先, 他把研究扩展到应用Doric(1992)模型推行经济增长计算法, 然后用金融市场的观点对该模型进行了放大, 在纳入股票市场变量进行分析后,(完整内容请到百度文库)也肯定了股票市场对经济增
牛人教你如何阅读外文文献
牛人教你如何阅读外文文献 2015-04-16 22:40 来源:科学网点击次数:5085关键词:英文文献 一、如何有针对地查找文献? 现在各大学图书馆里的数据库都比较全,即使不全也可以通过网络上多种手段获取文献了。所以说文献的获取不是问题,问题在于查什么样的文献? 1)本领域核心期刊的文献。不同的研究方向有不同的核心期刊,这里也不能一概唯IF论了。当然,首先你要了解所研究的核心期刊有哪些,这个就要靠学长、老板或者网上战友的互相帮助了。 2)本领域牛人或主要课题组的文献。每个领域内都有几个领军人物,他们所从事的方向往往代表目前的发展主流。因此,阅读这些组里的文献就可以把握目前的研究重点。怎么知道谁是“领军人物”呢?这里提供两个小方法:第一,在ISI里检索本领域的文献,利用refine 功能找出论文数量较多的作者或课题组;另一个方法,先要了解本领域有哪些比较规模大型的国际会议,登陆会议主办方的网站一般都能看到关于会议的invited speaker的名字,作为邀请报告的报告人一般就是了。 3)高引用次数的文章。一般来说高引用次数(如果不是靠自引堆上去的话)文章都是比较经典的文章。多读这样的文章,体会作者对文章结构的把握和图表分析的处理,相信可以从中领悟很多东西。 知道了查什么样的文献后,那么具体怎么去查文献? ?通过关键词、主题词检索:关键词、主题词一定要选好,这样,才能保证你所要的内容的全面。因为,换个主题词,可以有新的内容出现。 ?通过检索某个学者:查SCI,知道了某个在这个领域有建树的学者,找他近期发表的文章。 ?通过参考综述检索:如果有与自己课题相关或有切入点的综述,可以根据相应的参考文献找到那些原始的研究论文。
对外贸易与经济增长关系文献综述
对外贸易与经济增长关系文献综述 本文从网络收集而来,上传到平台为了帮到更多的人,如果您需要使用本文档,请点击下载按钮下载本文档(有偿下载),另外祝您生活愉快,工作顺利,万事如意! 伴随经济全球化的趋势,国际环境对经济增长的影响日趋显着。自16世纪亚当.斯密在〈〈国富论》一书中提出自由贸易产生分工,从而提高劳动生产率,增加社会财富这一观点后,掀起了国内外学术界对贸易与经济增长关系的研究热潮。本文对国际贸易理论、增长理论、贸易与经济增长关系理论进行梳理和分析,并简要介绍了近年来国内学者就中国对外贸易与经济增长之间的关系所做的大量理论和实证研究成果,以图在浩瀚的文献中找出主流的声音。 一、理论研究方面目前,国内外关于“国际贸易、经济增长的一般动力、贸易与经济增长关系”等方面的理论研究成果显着。西方经济学理论中关于贸易与经济增长关系的理论着重于对外贸易能否促进经济增长,以及如何促进经济增长的问题上。 (―)国际贸易视角的贸易与经济增长理论古典经济学家亚当.斯密的劳动价值论和绝对成本说开创了国际分工和国际贸易理论的先河。他的动态生产率理论和剩余产品出口理论代表了对外贸易拉动经济增长
的最初思想。剩余产品出口理论认为,对外贸易使得一国剩余产品的价值得以实现,增加了各国福利,同时由于各国市场的扩大,刺激了各国增加生产,改进技术,从而使劳动生产率得到提高,推动了经济增长。 近代国际贸易理论的奠基人大卫.李嘉图在其1817年出版的《政治经济学赋税原理》书中指出,即使一国各个行业的生产都缺乏效率,成本没有绝对低于他国的产品,但是通过国际贸易仍能得到经济利益:比较成本学说应运而生。李嘉图从进口可以平抑物价的角度论述了对外贸易可以保证英国工业化的资本积累并促进经济增长。赫克歇尔-俄林的要素禀赋说表明,通过国际贸易可以弥补国际间生产要素分布不均衡的缺陷,使各国都能更有效地利用各种生产要素,实现合理的国际分工,使贸易各国的生产率增长均得到提高。 与H-O理论推断相反的“里昂惕夫之谜”揭开了贸易自由化理论的新篇章。约翰.穆勒首先明确区分了贸易利益和发展利益,促使当代国际贸易理论研究的分析方法由静态分析向动态分析转变。此阶段主要理论有需求偏好理论、技术差距理论、产品生命周期理论等。美国经济学家巴格瓦蒂于1958年提出“贫困化增长”理论,认为出口较为单一且大量的开放型发展中国
文献综述,外文翻译,论文网站
文献综述怎么写 1) 什么是文献综述? 文献综述是研究者在其提前阅读过某一主题的文献后,经过理解、整理、融会贯通,综合分析和评价而组成的一种不同于研究论文的文体。 2) 文献综述的写作要求 1、文献综述的格式 文献综述的格式与一般研究性论文的格式有所不同。这是因为研究性的论文注重研究的方法和结果,而文献综述介绍与主题有关的详细资料、动态、进展、展望以及对以上方面的评述。因此文献综述的格式相对多样,但总的来说,一般都包含以下四部分:即前言、主题、总结和参考文献。撰写文献综述时可按这四部分拟写提纲,再根据提纲进行撰写工作。 前言,要用简明扼要的文字说明写作的目的、必要性、有关概念的定义,综述的范围,阐述有关问题的现状和动态,以及目前对主要问题争论的焦点等。前言一般200-300字为宜,不宜超过500字。 正文,是综述的重点,写法上没有固定的格式,只要能较好地表达综合的内容,作者可创造性采用诸多形式。正文主要包括论据和论证两个部分,通过提出问题、分析问题和解决问题,比较不同学者对同一问题的看法及其理论依据,进一步阐明问题的来龙去脉和作者自己的见解。当然,作者也可从问题发生的历史背景、目前现状、发展方向等提出文献的不同观点。正文部分可根据内容的多少可分为若干个小标题分别论述。 小结,是结综述正文部分作扼要的总结,作者应对各种观点进行综合评价,提出自己的看法,指出存在的问题及今后发展的方向和展望。内容单纯的综述也可不写小结。 参考文献,是综述的重要组成部分。一般参考文献的多少可体现作者阅读文献的广度和深度。对综述类论文参考文献的数量不同杂志有不同的要求,一般以30条以内为宜,以最近3-5年内的最新文献为主。 2、文献综述规定 1. 为了使选题报告有较充分的依据,要求硕士研究生在论文开题之前作文献综述。 2. 在文献综述时,研究生应系统地查阅与自己的研究方向有关的国内外文献。通常阅读文献不少于30篇,且文献搜集要客观全面 3. 在文献综述中,研究生应说明自己研究方向的发展历史,前人的主要研究成果,存在的问题及发展趋势等。 4. 文献综述要条理清晰,文字通顺简练。 5. 资料运用恰当、合理。文献引用用方括号[ ]括起来置于引用词的右上角。 6. 文献综述中要有自己的观点和见解。不能混淆作者与文献的观点。鼓励研究生多发现问题、多提出问题、并指出分析、解决问题的可能途径,针对性强。 7. 文献综述不少于3000字。 3、注意事项 ⒈搜集文献应尽量全。掌握全面、大量的文献资料是写好综述的前提,否则,随便搜集一点资料就动手撰写是不可能写出好的综述。 ⒉注意引用文献的代表性、可靠性和科学性。在搜集到的文献中可能出现观点雷同,有的文献在可靠性及科学性方面存在着差异,因此在引用文献时应注意选用代表性、可靠性和科学性较好的文献。 ⒊引用文献要忠实文献内容。由于文献综述有作者自己的评论分析,因此在撰写时应分清作者的观点和文献的内容,不能篡改文献的内容。引用文献不过多。文献综述的作者引用间接文献的现象时有所见。如果综述作者从他人引用的参考文献转引过来,这些文献在他人
经济学专业文献综述范本
国家产业安全理论研究综述 曹秋菊苏艳 [内容提要]随着商品和生产要素在国际间流动的加快,国家产业发展面临的风险和不确定性大大增加。本文对国内外学者对产业安全理论的研究进行了梳理和评述,以期对我国在开放条件下应对国家产业安全问题有所启示。 [关键词]产业安全理论贸易理论投资理论 一、国家产业安全的理论起源 目前普遍的看法是,产业安全起源于国家经济安全理论。国家经济安全作为系统、科学的研究仅仅只有几十年的历史,有关国家经济产业安全的理论也正在讨论、构建和形成之申。发展经济学家托达罗曾对发展中国家的共同经济特征进行过描述,他认为,发展中国家处于低生活水平、高失业和收入分配不均状态的一个重要原因,是穷国与富国的经济、政治力量的悬殊。力量的悬殊不仅表现在富国占有控制国际贸易格局的支配地位,还表现在富国拥有决定以什么条件向穷国转移技术、外援和私人资本的专断权力"发达国家还向发展中国家输出不切合后者实际国情的价值观、体制以及行为准则等,说明发展中国家在国际关系中,受着国外势力的控制和支配。以巴西学者T.D.桑托斯为代表的依附理论者认为"所谓依附,我们指的是若干国家的经济受到它们所依从的另一些国家经济的发展和扩大的制约"。他们认为,经济上依附将会产生国内经济不稳、加强外国资本主义的控制、受跨国公司的压榨等不良后果。 著名国际经济学家查尔斯.金德尔伯格曾说过,国际金融体系有内在的"疯狂、恐慌和崩溃"倾向。它容易不时发生债务危机、国际资本流动不稳、投机、为追求更高收益率或安全避风港而出现的资本抽逃。他认为,国际金融是同霸主国对国际经济和政治事务施加影响紧密相关的。霸主国既是国际金融体系的管理者,又是该体系中的主要收益者。总之,从发展经济学家以及国际经济学家和国际政治学家的著作中,我们都能发现蕴涵着国家产业安全的问题。① 二、国家产业安全的贸易理论基础 1.重商主义保护贸易论是产业安全经济思想的萌芽。国际贸易保护理论开始于15世纪的重商主义,它是代表商业资本利益的经济思想和政策体系,分早期重商主义和晚期重商主义。早期重商主义的代表人物是英国的约翰,海尔斯和威廉,斯塔福,主要观点是:金银是财富的唯一代表,国家的一切经济活动和一切经济政策的目的都是为了获取金银,为了国际经济贸易的顺差,国家必须干预经济。景玉琴(2005)研究认为,
外文文献参考网站
香港科技大学图书馆Dspace https://www.360docs.net/doc/971881070.html,t.hk/dspace 包括香港科技大学的学术论文、学位论文、研究报告等内容,均可免费获取全文。 Openj-gate https://www.360docs.net/doc/971881070.html,/ 提供4350种开放获取的期刊的数百万期刊全文文献。 加利福尼亚大学国际和区域数字馆藏 https://www.360docs.net/doc/971881070.html,/escholarship/ 加利福尼亚大学国际和区域数字馆藏研究项目。eScholarshipRepository主要提供已出版的期刊论文、未出版的研究手稿、会议文献以及其他连接出版物上的文章1万多篇,均可免费阅读。 剑桥大学机构知识库 https://www.360docs.net/doc/971881070.html,/ 由Cambridge University Library和University Computing Service维护,提供剑桥大学相关的期刊、学术论文、学位论文等电子资源。 发展中国家联合期刊库 https://www.360docs.net/doc/971881070.html,.br/ 非营利的电子出版物服务机构,提供来自发展中国家(如巴西、古巴、印度、印尼、肯尼亚、南非、乌干达、津巴布韦等)的开放获取的多种期刊的全文。 美国密西根大学论文库 https://www.360docs.net/doc/971881070.html,/index.jsp 美国密西根大学论文库2万多篇期刊论文、技术报告、评论等文献全文。包含艺术学、生物学、社会科学、资源环境学等学科的相关论文,另还有博硕士论文。标识为OPEN的可以打开全文。 jfg CERN Document Server http://cdsweb.cern.ch/ 主要覆盖物理学(particle physics)及相关学科,提供360,000多篇全文文献,包括预印文献、期刊论文、图书、图片、学位论文等等。 kl ArXiv https://www.360docs.net/doc/971881070.html,/ ArXiv是属于Cornell University的非盈利教育机构,面向物理学、数学、非线性科学、计算机科学和定量生物学等学科提供16种免费电子期刊的访问。 NASA Technical Reports Server https://www.360docs.net/doc/971881070.html,/?method=browse 主要是关于航空航天领域研究的科技报告和会议论文。 National Service Center for Environmental Publications https://www.360docs.net/doc/971881070.html,/ncepihom/ National Service Center for Environmental Publications提供的是美国环境保护总署(EPA)出版物。可以通过EPA出版号或题名检索EPA National Publications Catalog。 Energy Citations Database https://www.360docs.net/doc/971881070.html,/energycitations/ 提供美国能源部的科技信息摘要。学科范围:材料科学、环境科学、计算机、能源和物理。文献类型包括期刊论文、学位论文、研究报告和专利。 网上免费全文期刊FullText https://www.360docs.net/doc/971881070.html,/ https://www.360docs.net/doc/971881070.html,提供7000多种学术期刊的免费全文获取。 Open J-Gate 开放获取期刊门户
经济增长--文献综述
请大家查阅2014年《经济研究》中有关经济增长的论文,写一份有关经济增长的文献综述。字数在1000内,格式为“主题+主要结论+主要研究方法”。 对经济增长理论的一个贡献 本文基于哈罗德-多玛模型,主要谈论的是一个长期增长模型,在模型中接受除不变要素比例之外的所有哈罗德-多玛假定。与哈罗德-多玛模型相反的是,我认为在新古典中比较标准的条件下,单个复合商品由劳动和资本生产的。其中将比较详实地考察体系如何去拟合一个作为外生变量的既定的劳动增长率,从而看一看哈罗德所谓的不稳定是否出现。除此之外,还要分析价格-工资-利息之间重要作用的反应,然后,我会稍微将一些假定予以放松,看看会有什么变化。最后考虑更加“凯恩斯化”的关系和刚性后果。这些分析首先建立一个长期增长的基本模型K=sF(K,L0ent)上,该方程决定了在所有劳动力都就业下资本积累的时间轨迹。它的解给我们一个关于共同体的资本存量的唯一时间轮廓,资本存量将使全部可供劳动都实现就业。在可变化要素比率和不可变规模收益时,自然的增长率和有保证的自然增长率之间就有可能不发生简单对立,或许根本没有。然后提出要素固定比例不变、柯布道格拉斯以及规模报酬不变等三种情况来分析要素对经济增长的关系。然后确定价格工资利率行为,并利用中兴技术变化、劳动供给、可变储蓄率、税收及人口的视角对理论进行一些拓展,和对工资刚性、灵活偏好、政策含义和不确定性进行修正。通过上述的分析,说明储蓄、人口增长和技术进步如何影响一个经济的产出水平及其随时间推移而出现的增长。 2014年1月-10月《经济研究》有关经济增长方面的论文还是比较多的,基本上每一期都有1-2篇关于经济增长方面的论文。我根据学者们在经济增长中
教你怎么阅读外文文献
教你怎么阅读外文文献 2009-10-30 22:38 | (分类:默认分类) NO.1 中科院大博士是如何进行文献检索和阅读的(好习惯受益终生) 1.如何进行文献检索 我是学自然科学的,平时确实需要不少外文文献,对于自然科学来讲英文文献检索首推Elsevier,Springer等。虽然这些数据库里面文献已经不算少了。但是有时还会碰到查不到的文献,而这些文献的数据库我们所在研究所或大学又没有买,怎么办?我基本通过以下向个途径来得到文献。 1.首先在Google 学术搜索里进行搜索,里面一般会搜出来你要找的文献,在Google 学术搜索里通常情况会出现“每组几个”等字样,然后进入后,分别点击,里面的其中一个就有可能会下到全文,当然这只是碰运气,不是万能的,因为我常常碰到这种情况,所以也算是得到全文文献的一条途径吧。可以试一下。同时,大家有没有发现,从Google学术搜索中,还可以得到一些信息,Google学术搜索中会显示出你搜索文章的引用次数,不过这个引用次数不准确,但是从侧面反应了这篇文章的质量,经典文章的引用次数绝对很高的.同时如果你用作者进行搜索时,会按引用次数出现他写的全部的文章,就可以知道作者的哪些文章比较经典,在没有太多时间的情况下,就可以只看经典的. 2.如果上面的方法找不到全文,就把文章作者的名字或者文章的title在Google 里搜索(不是Google 学术搜索),用作者的名字来搜索,是因为我发现很多国外作者都喜欢把文章的全文(PDF)直接挂在网上,一般情况下他们会把自己的文章挂在自
己的个人主页(home page)上,这样可能也是为了让别的研究者更加了解自己的学术领域,顺便推销自己吧。这样你就有可能下到你想要的文献的全文了。甚至可以下到那个作者相近的内容的其它文章。如果文献是由多个作者写的,第一作者查不到个人主页,就接上面的方法查第二作者,以此类推。用文章的title来搜索,是因为在国外有的网站上,例如有的国外大学的图书馆可能会把本校一年或近几年的学术成果的Publication的PDF全文献挂在网上,或者在这个大学的ftp上也有可能会有这样类似的全文.这样就很可能会免费下到你想要的全文了. 3.如果上面两个方法都没有查到你要的文献,那你就直接写邮件向作者要。一般情况下作者都喜欢把自己的文献给别人,因为他把这些文献给别人,也相当于在传播他自己的学术思想。下面是本人向老外作者要文献的一个常用的模板: Dear Professor ××× I am in ××× Institute of ×××, Chinese Academy of Sciences. I am writing to request your assistance. I search one of your papers: 。。。。。。。。。。。。。。。。。(你的文献题目) but I can not read full-text content, would you mind sending your papers by E-mail? Thank you for your assistance. Best wishes !(or best regards) ××× 本人的经验是讲英语的国家的作者给文章的机率会大,一般你要就会给,其它不讲英语的国家,如德国,法国,日本等国家的作者可能不会给。出于礼貌,如果你要的文献作者E-mail给你了,千万别忘记回信致谢. 4.最后一种方法其实大家都熟悉,就是发贴在小木虫上求助。我还用另一种方法,
房地产投资与经济增长效率的文献综述研究
Value Engineering 0引言 随着1998年住房体制的改革,我国政府提出将住宅建设作为新的经济增长点,房地产业发展进入一个崭新的阶段。房地产业作为国民经济的基础产业和支柱产业,对我国的经济发展起着举足轻重的作用。我国正处于经济增长和城市化加速时期,房地产市场发展非常迅速,房地产投资增速高于其他固定资产投资增速,也远高于经济增长速度,这使得房地产市场存在很大的泡沫风险。此外由于我国房地产业收益过高,这必然会引起社会上人力、物力和财力等各种资源涌入房地产市场,掀起国内房地产开发投资的热潮,这也可能使得房地产投资资本积累过度,从而影响经济增长的质量。因此对房地产投资与经济增长效率的研究具有重大意义。本文主要回顾经济增长与投资效率的研究及房地产投资与经济增长的研究,为后续进一步研究做好准备工作。 1经济增长与投资效率的文献回顾 在整个研究经济增长的发展史上,投资形成资本, 结合劳动力的投入,共同构成了社会生产不可缺少的生产要素。在经典增长理论中,投资(尤其是物质资本投资)是一个国家工业化进程中实现高速增长的不可或缺的因素,但仅仅依靠大量投资还不足以保证经济增长,从长期来看一个国家的宏观投资效率才是关键。通过对已有的文献的整理和分析,我们认为目前对宏观投资效率的研究主要分为两大类:从投资总量的角度分析是否存在投资过度或投资不足的问题;从投资结构的角度分析资本在不同行业、地区的配置是否合理。 分析宏观投资总量效率的主要研究方法是,根据新古典增长的动态效率理论,运用AMSZ 准则进行测算。宏观经济中动态效率的概念最早来自菲尔普斯(Phelps , 1961),后来在新古典增长理论的索洛增长模型中有了精 确的数学表达。在索洛增长模型中,资本积累的“黄金律”水平,就是“使消费最大化的稳定状态”时的资本存量(记为k * gold ),可证f ′(k * gold )=n+g+δ①。如果经济达到稳态时k * >k * gold ,则存在过度资本积累问题,这时经济处于动态无效 状态,其资源配置不再是帕累托最优的。从动态效率的定义来看,最直接判断经济中是否存在投资过度的标准,就是比较资本边际收益率与黄金律的水平。但在实际应用中准确估算边际资本收益率很难,幸运的是Abel 等(1989)提出了一个简便易行的AMSZ 准则:如果一个国家每年的总资本收益始终大于当年的总投资(D>I ),那么这个国家的宏观投资就是动态有效的,否则就是动态无效的。根据“黄金律”和AMSZ 准则,史永东、齐鹰飞(2002)和袁志刚、何彰勇(2003)研究了我国宏观投资的动态效率问题,认为中国经济是动态无效的,且存在资本的过度积累问题。在此基础上,刘宪(2004)认为史永东和袁志刚等不应当将生产税净额从总收益中去掉,从而低估了我国经济总的总资本收益。刘宪修正后的实证研究发现:中国经济从总体来看,近年来一直处于动态有效状态,并未发生资本的过度积累问题。项本武(2008)遵循AMSZ 准则,但运用更新后的总资本收益计算方式,对我国1994-2003的经济动态效率进行重新测算,得到在样本期内,我国经济的动态效率是波动的,投资率较高时,经济处于动态无效状态,投资率较低时,经济处于动态有效状态,这与我国经济的投资驱动型特征相吻合。 对宏观投资结构效率的评判方法主要是,资本边际收益率均一化准则。即通过测算资本边际收益率差异的变化趋势,来判断资本配置效率是否提高,如龚六堂、谢丹阳(2004)的表述“一般来讲,生产要素的边际生产率差异变小就表明资源配置的有效性得到改善② 。在一般均衡理论 中, 当且仅当要素价格等于其边际生产率的时候,资源配置才是有效的, 经济整体也达到帕累托最优,我们也可以据此判断资本配置效率。然而在实际中我们看不到资本的—————————————————————— —作者简介:李文华(1982-),女,山东栖霞人,硕士研究生,教师,研究方向为会计电算化;李文龙(1985-),男,山东栖霞人,宁波大学,硕士研究生,研究方向为金融计量与风险管理。 房地产投资与经济增长效率的文献综述研究 A Survey of Real Estate Investment and Efficiency of Economic Growth 李文华①LI Wen-hua ;李文龙②LI Wen-long (①山东协和学院,济南250107;②宁波大学,宁波315200) (①Shandong Xiehe Institute ,Ji'nan 250107,China ;②Ningbo University ,Ningbo 315200,China ) 摘要:房地产业作为国民经济的基础产业和支柱产业,对我国的经济发展起着举足轻重的作用。但近年来出现不少关于房地产投 资过度以及存在泡沫的言论,如何从我国目前投资体制以及政策引导角度分析房地产投资效率具有重大意义。本文整理和介绍了经 济增长与投资效率的文献及房地产投资与经济增长关系的文献,尽量准确地介绍这些研究方法并相应作出分析和评述,为后面进一步深入理论和实证研究提供帮助。 Abstract:The real estate industry,as the basic and dominant industry,has promoted the growth of national economy.Has real estate over -invested?Is there a bump in real estate market?So the study of the efficiency of real estate investment has great mean in the background of our own investment system.This paper provides a comprehensive review of the researches about economic growth and investment efficiency and about real estate investment and economic growth. 关键词:房地产投资;经济增长;投资效率Key words:real estate investment ;economic growth ;investment efficiency 中图分类号:F293.3文献标识码:A 文章编号:1006-4311(2013)14-0195-03 ·195· DOI:10.14018/https://www.360docs.net/doc/971881070.html,13-1085/n.2013.14.154
员工激励的文献综述、外文翻译.doc
一、激励理论的背景 在经济发展的过程中,劳动分工与交易的出现带来了激励问题。激励理论是行为科学中用于处理需要,动机,目标和行为四者之间关系的核心理论。行为科学认为人的动机来自需要,由需要确定人们的行为目标,激励则作用于人内心活动,激发,驱动和强化人的行为。哈佛大学维廉詹姆士研究表明:在没有激励措施下,下属一般仅能发挥工作能力的20%~30%,而当他受到激励后,其工作能力可以提升到80%~90%,所发挥的作用相当于激励前的3到4倍。日本丰田公司采取激励措施鼓励员工提建议,结果仅1983年一年,员工提了165万条建议,平均每人31条,它为公司带来900亿日元利润,相当于当年总利润的18%。由于激励的效果明显,所以各种组织为了提高生产效率,有些专家学者就开始了对激励理论的研究之中,探索激励的无穷潜力。 二、国外研究现状 国外对于激励理论有了大量的研究并获得了丰硕的成果。总体来说,可以分为两类激励理论。一类是以人的心理需求和动机为主要研究对象的激励理论,熟称“内容型激励理论”。另一类是以人的心理过程和行为过程相互作用的动态系统为研究对象的激励过程理论,它也被称作是“行为型激励理论”。 1 内容型激励理论 1.1 奠瑞的人类人格理论 这种理论认为,在面临着动态且不断变化的环境时,人们都是自适应的。它把需求分成了两种类型,即生理需求和心理需求。前者与人体基本生理过程的满足感有关,而后者所关注的是情绪上和精神上的满足感。 1.2 马斯洛的“需要层次”理论 美国心理学家马斯洛(A.H.Maslow)进一步发展了莫瑞的研究,在1954年出版的《动机与人格》一书中对该理论作了进一步的阐释。马斯洛认为人的需要可以划分为五个层次,从低到高依次为生理需要,安全需要,社交需要,尊熏需要,自我实现需要,且这五个层次的顺序,对每个人都是相同的。只有当较低层次的需要获得了基本满足后,下一个较高层次的需要才能成为主导需要。 1.3 赫茨伯格的激励—保健双因素理论 美国心理学家赫茨伯格因素理论打破了这一假设。他于1959年在《工作的激励》一书中提出了保健——激励因素理论,简称双因素理论。即保健因素和激励因素。保健因素可以用来体现高水平员工的不满意,激励因素可以用来体现高水平员工的满意度。他认为只有激励因素才能促发员工积极性,提高生产效率。 2 行为型激励理论 2.1 洛克的目标设置理论 2O世纪6O年代末,埃德温·A·洛克和他的同事们花了许多年的时间研究目标对于人类行为和绩效的效果。他们的研究导致了目标设置理论的创立并不断地得到验证,提出:指向一共同目标的工作意向是工作效率的主要源泉。他还提出了具体的设置目标的步骤。 2.2 亚当斯的公平理论 美国心理学家亚当斯(J.s.Adams)对员工受激励程度的大小与他人之间的关系进行研究,并在《工人关于工资不公平的内心冲突同其生产率的关系》(1962年与罗森合写),《工
免费外文文献网站
免费外文文献网站 电脑技术2008-05-28 13:23:58 阅读4334 评论2 字号:大中小订阅 免费外文文献网站。 https://www.360docs.net/doc/971881070.html,/cgi/collection/MDG?page=77 https://www.360docs.net/doc/971881070.html,/cgi/search/ https://www.360docs.net/doc/971881070.html,/content/vol11/issue3/index.shtml https://www.360docs.net/doc/971881070.html,/retrieval/English.htm https://www.360docs.net/doc/971881070.html,/entrez/query.cgi https://www.360docs.net/doc/971881070.html,/content/vol32/suppl_1/ https://www.360docs.net/doc/971881070.html,/current.shtml https://www.360docs.net/doc/971881070.html,/ https://www.360docs.net/doc/971881070.html,/ https://www.360docs.net/doc/971881070.html,:2048/menu https://www.360docs.net/doc/971881070.html,/data/databases_alpha.htm https://www.360docs.net/doc/971881070.html,/ https://www.360docs.net/doc/971881070.html,:2048/login https://www.360docs.net/doc/971881070.html,/ https://www.360docs.net/doc/971881070.html,/ https://www.360docs.net/doc/971881070.html,/ https://www.360docs.net/doc/971881070.html,/ https://www.360docs.net/doc/971881070.html,/ https://www.360docs.net/doc/971881070.html,/yxbslw/pxjg/2004/2004ybxk.htm(SupFree52004 年国家获奖论文集) 国外大学免费硕博全文数据库以及部分期刊全文 Universitatsbibliothek Munchen ( Germany ) http://edoc.ub.uni-muenchen.de/perl/advsearch University of Campinas Faculty of Education https://www.360docs.net/doc/971881070.html,/cr/uchsc/main https://www.360docs.net/doc/971881070.html,/Pubs/ETD/ University of Florida https://www.360docs.net/doc/971881070.html,/etd.html University of Georgia Electronic Theses and Dissertations
英文文献阅读技巧 怎么样看文献最有效
看了大半年文献,没有什么经验,前几天去实验室和老板聊天,觉得自己看文献就像看历史书,呜呼!悲哉! 无意间看到一篇文章觉得总结得不错,就与大家分享一下,觉得好就回复一个! 1.牛人一 (从phd到现在工作半年,发了12篇paper, 7篇first author.) 我现在每天还保持读至少2-3篇的文献的习惯.读文献有不同的读法.但最重要的自己总结 概括这篇文献到底说了什么,否则就是白读,读的时候好像什么都明白,一合上就什么都不知道,这是读文献的大忌,既浪费时间,最重要的是,没有养成良好的习惯,导致以后不愿意读文献. 1. 每次读完文献 (不管是细读还是粗读), 合上文献后,想想看,文章最重要的 take home message是什么, 如果不知道,就从abstract, conclusion里找, 并且从discuss里最好确认一下. 这样一来, 一篇文章就过关了. take home message其实都不会很多, 基本上是一些concepts, 如果你发现你需要记得很多,那往往是没有读到重点. 2. 扩充知识面的读法, 重点读introduction, 看人家提出的问题, 以及目前的进展类似 的文章, 每天读一两篇,一个月内就基本上对这个领域的某个方向有个大概的了解.读好的review也行, 但这样人容易懒惰. 3. 为了写文章的读法, 读文章的时候, 尤其是看discussion的时候, 看到好的英文句型, 最好有意识的记一下,看一下作者是谁,哪篇文章,哪个期刊, 这样以后照猫画虎写的时候, 效率高些.比自己在那里半天琢磨出一个句子强的多. 当然,读的多,写的多,你需要记得句型就越少.其实很简单,有意识的去总结和记亿, 就不容易忘记. 2.牛人二 科研牛人二告诉研究生怎么看文献,怎么写论文 一、先看综述 先读综述,可以更好地认识课题,知道已经做出什么,自己要做什么,,还有什么问题没有解决。对于国内文献一般批评的声音很多.但它是你迅速了解你的研究领域的入口,在此之后,你再看外文文献会比一开始直接看外文文献理解的快得多。而国外的综述多为本学科的资深人士撰写,涉及范围广,可以让人事半功倍。 二、有针对地选择文献 针对你自己的方向,找相近的论文来读,从中理解文章中回答什么问题,通过哪些技术手段来证明,有哪些结论?从这些文章中,了解研究思路,逻辑推论,学习技术方法. 1.关键词、主题词检索: 关键词、主题词一定要选好,这样,才能保证你所要的内容的全面。因为,换个主题词,可以有新的内容出现。 2. 检索某个学者: 查SCI,知道了某个在这个领域有建树的学者,找他近期发表的文章。 3. 参考综述检索: 如果有与自己课题相关或有切入点的综述,可以根据相应的参考文献找到那些原始的研究论文。
经济增长理论文献综述
科技经济市场 1引言 500年至1500年,经济的年增长只有0.1%,在1000年的漫长岁月中,产出只增长了3倍,而18世纪的英国却取得了10倍于过去的增长率。这一现象第一次让人兴奋不已,古典经济学家们首先探讨了经济增长问题,对经济增长过程的分析是由斯密、李嘉图和马尔萨斯为主要代表的英国古典经济学家的核心工作,他们是研究经济增长理论的杰出前驱,斯密强调劳动专业化分工对经济增长的重要性,李嘉图则强调国际贸易对经济增长的贡献,而马尔萨斯则强调人口与经济增长的关系。但他们的研究视野都被局限在识别影响增长的因素和说明决定经济增长过程的机制上。 哈罗德1939年发表的《关于动态理论的一篇论文》和1948年出版的《走向动态经济学》,提出了经济学界的第一个经济增长理论模型,使经济增长问题的研究从定性走向了定量,1946-1947年美国经济学家多马发表了二篇有关经济增长的论文。哈罗德和多马提出的经济增长模型既是对凯恩斯宏观理论的进一步扩展,又是现代经济增长理论研究的起点,从而标志着主流经济学开始将经济增长的理论研究作为了重要的研究课题。 2经济增长理论模型化的开始 1870年以后,经济学主流关注的重点从供给转向了需求,经济增长的研究已远离了主流经济学家的视野,哈罗德-多马则开创了主流经济学家对经济增长理论模型的研究,标志着经济增长理论研究在主流经济学中的复兴。 现代经济学的增长模型是建立在Harrod(1939)和Domar (1946)的基础上,按照Harrod-Domar模型,决定一国经济增长的的最主要因素有两个:决定全社会投资水平的储蓄率和反映生产效率的资本-产出比率。由于假设前提的局限,在他们的模型中,资本和劳动同时实现充分就业的稳定状态的经济增长很难实现,即经济长期均衡增长呈现出“刀刃”特征。但Harrod-Domar模型标志了经济学界运用数理经济方法研究经济增长理论的开始,是对经济增长理论研究的一次重大革命:他对资本积累和劳动就业的研究,对以后的经济增长理论模型将资本和劳动作为经济增长所必须依赖的两大要素,显然具有直接的影响。这一模型既是现代经济增长理论的起点,也是将经济增长理论模型化的现代经济增长模型研究的起点,同时,它也是经济增长理论模型内生化进程的出发点。 Harrod-Domar模型强调物质资本的增长对现代经济增长的决定意义。这是以后的经济增长理论研究经济增长率的起点,模型中四个外生的参数:资本-产出比、储蓄率、技术进步的速度和人口增长率,以后的经济增长理论模型的发展基本上就是围绕着将这四个外生变量内生化而进行的。 3现代经济增长理论模型的基准 索罗在Harrod-Domar模型的基础上新引进了三个假设:(1)总 量生产函数象柯布道格拉斯生产函数一样具有新古典性质;(2)劳动和资本这二种生产要素在任何时刻都处于供求均衡状态;(3)劳动和资本可以相互替代。在此基础上索罗于1956年发表的论文《A Contribution to the Theory of Economic Growth》成了近半个世纪几乎所有的经济增长理论模型研究的基准点:(1)自索罗模型开始,新古典生产函数就成了经济增长理论模型中标准的总量生产函数;(2)在索罗模型的影响下,整个经济时刻都处于动态一般均衡状态成了经济增长理论模型中的通则;(3)索罗模型将给定人们掌握的技术下的劳动生产率内生化,于是在其模型中引入了那个著名的代表技术水平的变量A;(4)索罗模型还在经济增长理论中确立了一个思想传统:它使经济增长理论变成了完全从供给方面研究长期经济增长的根源;(5)在索罗模型的影响下,主流经济增长模型都以自己的长期增长稳态来解释形成“卡尔多稳态”的原因。 罗索模型通过假设资本和劳动之间的替代解决了Harrod-Domar模型中的“刀刃”问题,但它却不能解决没有外生给定技术进步时产生人均产出的长期增长,此外模型中的储蓄率也不是通过个人动态最优化行为内生决定的,更为紧要是的它能解决经济增长中的许多问题却不能解决经济增长本身!索罗模型的缺陷激发了经济学家们构造经济增长数学模型的冲动。其中,拉姆齐模型通过变分法解决了消费都在现在消费和未来消费之间的有效折中,解决了最优化的储蓄、生产和消费的时间路径,沿着这条思路的研究取得的最重要成果是卡斯和库普曼斯在1965年作出的贡献:他们将拉姆齐的消费都最优化理论引入新古典经济增长模型,从而使新古典模型达到了最完美的程度。 4将储蓄内生化的经济增长模型 新古典经济理论没有考虑消费者的最优化决策行为,而是假设储蓄是产出的固定比例,并且是外生给定的,从而使这个模型缺乏微观经济基础。于是新古典经济理论在将资本内生化的基础上进行了将储蓄率内生化。新古典经济理论的第二步内生化不仅导致了拉齐姆-卡斯库普曼斯模型(无限斯界模型)的产生,而且也导致了戴蒙德的世代交替模型的诞生。 按新古典经济学的研究范式将储蓄内生化,首要条件是建立附有对时间的主观帖现率的新古典的效用函数,在个人效用函数最大化分析中,重要问题之一是决策的时间范围,即决策的个人是将未来无限长时间中的效用最大化,还是仅仅将自己有限的一生的时间内进行效用的最大化,以前一种时间假定为条件建立的经济模型被称为“无限期界模型”(Infinite Horizon M odel)以后一种时间假设为条件建立的模型被称为“世代交叠模型”(Overlapping generations M odel)。 拉姆齐以数学模型论证了最优消费行为下,一国储蓄所必须满足的条件(Ramsey,1928),但由于当时经济数学工具的限制,拉姆齐推导出的其实是每个时点上的最优储蓄,而没有依据基本的效用函数指出整个未来时期中最优消费和最优储蓄的动 经济增长理论文献综述 佘时飞 (电子科技大学中山学院,广东中山528402) 摘要:在哈罗德-多马将经济增长理论模型化的基础上,索罗将资本进行了内生化,拉姆齐-卡斯-库普曼斯和戴蒙德则将储蓄进行了内生化,从而进一步完善了新古典经济增长理论。此后沿着内生化方向,出现了大量的文献,将经济增长理论的研究进一步推向深入。内生化将经济增长理论发展带入了一个全新的时代,成为当前经济理论研究的主导方向,本文将对这一方向的发展作一个较为系统的综述。 关键词:技术进步;制度创新;内生增长 经济研究 趦趻 2009年第8期
大数据外文翻译参考文献综述
大数据外文翻译参考文献综述 (文档含中英文对照即英文原文和中文翻译) 原文: Data Mining and Data Publishing Data mining is the extraction of vast interesting patterns or knowledge from huge amount of data. The initial idea of privacy-preserving data mining PPDM was to extend traditional data mining techniques to work with the data modified to mask sensitive information. The key issues were how to modify the data and how to recover the data mining result from the modified data. Privacy-preserving data mining considers the problem of running data mining algorithms on confidential data that is not supposed to be revealed even to the party
running the algorithm. In contrast, privacy-preserving data publishing (PPDP) may not necessarily be tied to a specific data mining task, and the data mining task may be unknown at the time of data publishing. PPDP studies how to transform raw data into a version that is immunized against privacy attacks but that still supports effective data mining tasks. Privacy-preserving for both data mining (PPDM) and data publishing (PPDP) has become increasingly popular because it allows sharing of privacy sensitive data for analysis purposes. One well studied approach is the k-anonymity model [1] which in turn led to other models such as confidence bounding, l-diversity, t-closeness, (α,k)-anonymity, etc. In particular, all known mechanisms try to minimize information loss and such an attempt provides a loophole for attacks. The aim of this paper is to present a survey for most of the common attacks techniques for anonymization-based PPDM & PPDP and explain their effects on Data Privacy. Although data mining is potentially useful, many data holders are reluctant to provide their data for data mining for the fear of violating individual privacy. In recent years, study has been made to ensure that the sensitive information of individuals cannot be identified easily. Anonymity Models, k-anonymization techniques have been the focus of intense research in the last few years. In order to ensure anonymization of data while at the same time minimizing the information