雅思表格写作

表格写作
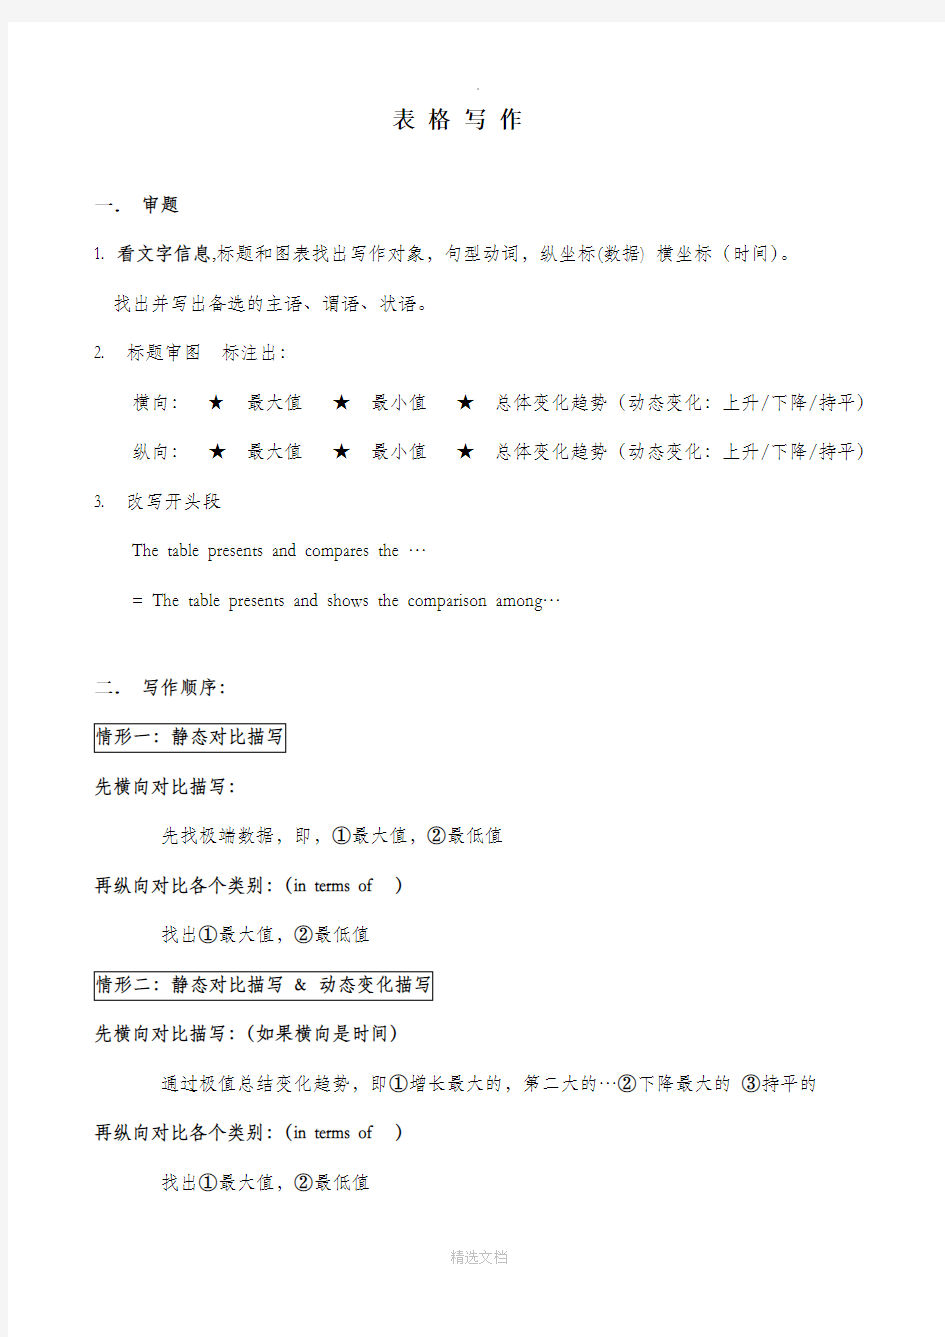
一.审题
1. 看文字信息,标题和图表找出写作对象,句型动词,纵坐标(数据) 横坐标(时间)。
找出并写出备选的主语、谓语、状语。
2. 标题审图标注出:
横向:★ 最大值★最小值★总体变化趋势(动态变化:上升/下降/持平)纵向:★最大值★最小值★总体变化趋势(动态变化:上升/下降/持平)3. 改写开头段
The table presents and compares the …
= The table presents and shows the comparison among…
二.写作顺序:
先横向对比描写:
先找极端数据,即,①最大值,②最低值
再纵向对比各个类别:(in terms of )
找出①最大值,②最低值
先横向对比描写:(如果横向是时间)
通过极值总结变化趋势,即①增长最大的,第二大的…②下降最大的③持平的
再纵向对比各个类别:(in terms of )
找出①最大值,②最低值
三.写作技巧
1.要突出强调最大和最小值
2.寻找数字之间的关系(倍数)
3. 有时间就要写变化趋势
四.表格必备万能句型
静态数据对比描写(三个必备句型)
动态描写变化(三个必备句型)
范文一
The table below shows the consumer durables (telephone, refrigerator, etc.) owned in Britain from 1972 to 1983.
Write a report for a university lecturer describing the information shown below.
You should write at least 150 words.
The chart shows that the percentage of British households with a range of consumer durables steadily increased between 1972 and 1983.
The greatest increase was in telephone ownership, rising from 42% in 1972 to 77% in 1983. Next came central heating ownership, increasing from 37% of households in 1972 to 64% in 1983. The percentage of households with a refrigerator rose 2 1% over the same period and of those with a washing machine by 14%. Households with vacuum-cleaners,televisions and dishwashers increased by 8%, 5% and 2% respectively. In 1983,the year of their introduction, 18% of households had a video recorder. Obviously, television always keeps as the most durable goods in British households, compared with the central heating as the least one.
The significant social changes reflected in the statistics are that over the period the proportion of British houses with central heating rose from one to two thuds, and of those with a phone from under a half to over three-quarters. Together with the big increases in the ownership of washing machines and refrigerators, they are evidence of both rising living standards and the trend to lifestyles based on comfort and convenience.
范文二
The take below gives information about the underground railway systems in six cities.
Underground Railways Systems
The table shows the details regarding the underground railway systems in six cities.
London has the oldest underground railway systems among the six cities. It was opened in the year 1863, and it is already lye years old. Paris is the second oldest , in which it was opened in the year 1900. This was then followed by the opening of the railway systems in Tokyo, Washington DC and Kyoto. Los Angeles has the newest underground railway system, and was only opened in the year 2001. In terms of the size of the railway systems, London, For certain, has the largest underground railway systems. It has 394 kilometres of route in total, which is nearly twice as large as has the smallest system. It only has 11 kilometres of route, which is more than 30 times less than that of London.
serves the greatest number of passengers
per year, at 1927 million passengers. The system in Paris has the second greatest number of passengers, at 1191 million passengers per year. The smallest underground railway system, Kyoto, serves the smallest number of passengers per year as predicted.
In conclusion, the underground railway systems in different cities vary a lot in the site of the system, the number of passengers served per year and in the age of the system.
范文三
The table below shows carbon dioxide emissions from transport in three European countries
in 1994 and 2004.
The given table shows an overview of carbon dioxide emissions from four main transport sources (namely,road transport,railways,civil aviation and shipping) in the United Kingdom,France and Germany in 1994 and 2004.
Germany, although having higher emissions than either the United Kingdom or France did, saw the amount decrease slightly from 47.2 to 46.7 million tones. By comparison, France recorded an increase of four million tones from 34.7 million in 1994, while the United Kingdom had a smaller
growth, 2.5 million tones over the same period.
In all the three countries, road transport was responsible for the majority of emissions. In the United Kingdom road transport produced emissions up to 32.6 million tonnes in 2004, 2 million more than ten years earlier, while other three transport sources did not show any remarkable growth. A similar pattern was seen in France, where road transport added 3.6 million tonnes to the total emissions within ten years. Germany, by contrast, was the only country of the three to experience a drop in road transport emissions. Other three transport sources had a lower emission volume as well, except civil aviation, with the amount rising to 1.2 million.
As shown in the table, both UK and France failed to reduce carbon dioxide emissions from transport sources during the period 1994 to 2004. In contrast to the decrease in Germany, Road transport continued to account for the biggest source of emissions.
范文四
The table shows information about the favored tourist destinations in the city of Llorente of different age groups.
The table shows information about the favored tourist destinations in the city of Llorente of different
age groups. Each figure for destinations shows the percentage of tourists who visited the destinations on their last holiday. There are four age groups—twenties, thirties, forties and over 50-year-old group.
The most favored destination for all age groups was shopping centers. The percentage of tourists who visited there was more than 80%, and 95% of tourists of the forties group visited there. The percentages of tourists who visited art galleries, zoos, and museums increased as the age of tourists
discotheques, and cinemas, theatres decreased as the age increased. For example, 87% of tourists in
To sum up, favored destinations were different for each age group, however, almost all tourists visited shopping centers.
范文五
The table below shows the proportion of different categories of families living in poverty in Australia in 1999.
Give reasons for your answer and include any relevant examples from your own knowledge or experience.
The table gives a breakdown of the different type of family who were living in poverty in Australia in 1999.
On average, 11% of all households, comprising almost two million people, were in this position.
poor people, with 21% and 19%respectively. Couples generally tended to be better off, with lower poverty levels for couples without children (7%) than those with children (12%). It is noticeable that for both types of household with children, a higher than average proportion were living in poverty at this time.
Older people were generally less likely to be poor, though once again the trend favoured eldery couples (only 4%) rather than single eldery people (6%).
Overall the table suggests that households of single adults and those with children were more likely to be living in poverty than those consisting of couples.
范文六
The table below provide information on rental charges and salaries in three areas of London.
Write a report for a university lecturer describing the information shown below.
Weekly rents per property
Salaries ne eded (£/year)
(£/w)
The table shows two sets of related information: the relative cost, in pounds, of renting a property with one, two or three bedrooms in three different suburbs of London and an indication of the kind of annual salary you would need to be earning to rent in these areas.
Of the three areas mentioned, Notting Hill is the most expensive with weekly rents starting at £375 (salary approximately f 100,000) and rising to£738 per week for a 3-bedroom property. To afford this, you would require a salary in the region of £200,000 per annum. Alternatively, Fulham is the cheapest area shown with rents ranging from £215 per week for a one bedroom property to £600 per week for a
3-bedroom property. To rent in this area, salaries need to be somewhere between £85,000 and £170,000 depending on the number of bedrooms required. For those able to pay in the middle price range for accommodation, Regent's Park might be a more suitable district.
范文七
The table below shows the sales at a small restaurant in a downtown business district.
Give reasons for your answer and include any relevant examples from your own knowledge or experience.
Sales: week of October 7-13
The sales at this small restaurant during the week of October 7 to 13th followed a fairly set pattern from Monday to Friday, and then showed notable shift on the weekend. The lunch and dinner sales during
the week peaked on Friday and then dipper down as the weekend set in.
During the week of October 7-14th, the lunch sales averaged at approximately $2,400. The highest lunch sales occurred on Friday, and the lowest occurred on Sunday. Sunday's lunch sales were approximately $1,000 less than the average lunch sales during the rest of the week. Dinner sales, which generated at least $1,000 to $1,500 more a day than lunch sales, also remained steady during the week. Just like the lunch sales, the dinner sales peak on Friday and dipped down for the weekend. Excluding Wednesday and Thursday, the lunch and dinner sales from October 7-11 rose gradually until the end of the business week. Midweek, on Wednesday and Thursday, the sales were slightly lower than they were on Tuesday.
According to the sales report, this restaurant has a steady lunch and dinner crowd. The most profitable day during the second week of October was Friday. Sunday, was the least profitable day, with the full day's sales totaling less than the Friday dinner sales. These numbers are reflective of a restaurant that is located in a business/financial district where business hours are Monday through Friday.
范文八
The line graph below shows the number of annual visits to Australia by overseas residents. The table below gives information on the country of origin where the visitors came from. Write a report for a university lecturer describing the information given.
NUMBER OF VISITORS (million)
19752005
SOUTH KOREA
JAPAN
CHINA
USA
BRITAIN
EUROPE 2.9
3.2
0.3
0.4
0.9
1.1
9.1
12.0
0.8
1.1
2.9
4.5
Total8.830.4
The given line graph illustrates information on the number of overseas visitors traveling to Australia in millions of people. Overall, one notable trend seems to be that Australia has steadily become more popular as a destination spot. For example, there were 20 million more visitors to Australia in 2005 than in 1975. That's a jump from 10 million to 30 million in 20 years.
The second table gives statistics showing the countries whose residents went to Australia between 1975
and 2005. In both years, the largest number of visitors came from Japan, followed by South Korea and Europe. Britain, the United States and China also had many people traveling to Australia in these years. In fact, the number of people visiting Australia grew i n every one of these countries. For example, in 2005, 12 million people went there from Japan, compared with only 3.2 million in 1975.
范文九
The table below give information about Favorite Pastimes in different countries.
This table clearly presents and compares favourable pastimes in eight different countries. The pastimes, across the top of the table, are analyzed in relation to each country.
雅思写作科技篇
科技 SCIENCE & TECHNOLOGY 在这部分,你的任务是: 一,背诵话题词汇短语 二,为题目列出英文提纲 基础词汇短语 advanced science 尖端科学 scientific invention 科学发明 exert a far-reaching impact on…对…产生一种深远的影响 double-edged sword 双刃剑 earth-shaking changes 翻天覆地的改变 pay the way for the future development 为未来的发展铺平道路 lay a solid foundation for…为…打下良好的基础 energy crisis 能源危机 depletion of resources 能源消耗 milestone 里程碑 sophisticated equipment 尖端设备 technical innovation 科技创新 expediency 权宜之计 antithetical 与…背道而驰的 over-commercialized 过渡商业化的 a heated discussion 热烈的讨论 exhaust gas 废气 disastrous 灾难性的 overshadow 使…相形见绌 compared to/with…与…相比 usher in 引领 speedy and comfortable 既快捷又舒适 opposite forces 负面影响 a fatal breakdown 致命故障 potential hazards 潜在危险 pose a threat to…对…有一种威胁 promote relative industries 促进相关产业发展 accelerate 加速… means of transportation 交通方式 transportation tools 交通工具 social status 社会地位 environmentally-friendly resources 环保的能源 make people's life easier 使人们生活更方便 alternative fuel 可替代燃料
雅思写作基础
最高级和比较级 主语谓语最高级和比较级(宾语) than 英国在某方面花费的最多 Britain spent the most heavily on… 英国的花费高于其他国家 Britain spent more than other countries. 德国花的只比法国多 Germany only spent more than France. 主系表结构 意大利的花销只比法国多一点 Italy’s spending is only marginally greater than that of France. 英国的花费高于其他国家 British spending is considerably higher than that of other countries. 西班牙是最受欢迎的度假胜地。 Spain is the most popular holiday destination. 被动语态 女性失业率高于男性的。 More women are unemployed than men. 红色车的销量较高。 Far more red cars are sold. 英国在玩具上的花费高于其他国家 More money was spent on toys in Britain than in other countries. 女性的失业率最高 The highest percentage of women are unemployed. The unemployment rate for females is the highest. 位居中间maintain middle position 表示比较的连接词 By comparison = in contrast = by contrast: 对比来说, Compared with A = in contrast to A :和A对比来说, On the contrary = conversely: 相反 数字连接词修饰词 at \with\ reaching the figure of some\approximately\more or less\ just over\just under\ number or so The number of visitors to France and Germany reached 3million and 5million respectively 相等be equal to 主谓宾结构中常用动词 Spend Consume Consider mention cite prefer\favor\appeal to enjoy\have \own Suffer hoose 最the most 最不the least
雅思图表作文经典句型
雅思图表作文经典句型 一.上升增长 1.…add up to…增加了 e.g. The total amount of …added up to 14 billion pounds(14%) in 1994. 2.to jump to / to soar to.. 一跃达到/ 猛增到… e.g. The total working days lost soaredto 10 million in 1979. 3.…an increase of about…percent as compared with.. 与…相比大约增加了… e.g. In August as many as 39 car accidents were reported, indicating an increase of about 79% as compared with the number of January. 4.…to experience an increase/incline …有了增长 e.g. Tobacco consumption is experiencing an incline. 二.下降,减少 1.…to sink/drop/reduce to…减少到… e.g. The rate of strikes sank/dropped to the lowest point in 1979. 2.…to experience a decrease/decline …有了减少 e.g. Tobacco consumption is experiencing a decrease. 注意:
雅思经典图表作文范文
# 43. You should spend about 20 minutes on this task. The table below shows CO2 emissions for different forms of transport in the European Union. The Pie Chart shows the percentage of European Union funds being spent on different forms of transport. You should write at least 150 words.
model answer: The chart shows CO2 emissions per passenger kilometre for variuos methods of transport in the European Union while the pie chart shows European Union spending on transport. Flying by air produces by far the greatest CO2 emissions, approximately three times as much as passenger cars which are the next largest producers. Very little is spent by the EU on air travel while roads make up more than half of the EU transport budget. Trains produce about three times less CO2 emissions per passenger kilometre than passenger cars and eight times less than air travel. Nearly a third of EU transport funds are spent on railways. Ships are a clean form of transport and produce about the same amount of CO2 per passenger kilometre as trains do. However, only 2 percent of EU funds are spent on ports. A further one percent is spent on inland waterways. Coaches are the cleanest form of transport. Emissions of CO2 per passenger kilometre from coaches are half those of buses. Buses emit less than half as much CO2 per passenger kilometre as cars. The European Union spends 10 percent of its transport budget on public transport, such as buses and coaches. (197 words)
雅思写作教学计划
雅思写作基础段教学大纲 课程名称:雅思写作基础段 课程周期:16小时 课程安排:2小时 / 次;共8次 教学目标: 教学安排: 第一次:雅思写作task 1整体介绍;task 1常用词汇及运用 第二次:雅思写作task 1常见图表介绍及相应的表达 第三次:雅思写作task 2整体介绍和常用词汇及运用 第四次:雅思写作task 2分类介绍与背景构建 第五次:雅思写作task 2常用表达运用及强化进阶 第六次:雅思写作task 1 和task 2 混合基础分场景共建 第七次:雅思写作task 1和task 2混合表达及词汇共建 第八次:雅思写作基础段总结及强化段铺垫与衔接 雅思写作强化段教学大纲 课程名称:雅思写作强化段 课程周期:12小时 课程安排:2小时 / 次;共6次 教学目标: 在进行了起步段和基础段之后,通过强化段的课程来帮助学生更深入地理解雅思写作考试。帮助学生解决备考中的关键性问题——思维发散。通过强化段的课程来提高学生在雅思写 作方面的应试能力。 教学安排: 第一次:雅思写作task 1图表分类强化 第二次:雅思写作task 1图表分类强化 第三次:雅思写作task 1图表分类强化 第四次:雅思写作task 2分类强化 第五次:雅思写作task 2分类强化 第六次:雅思写作task 2分类强化篇二:定制雅思教学计划 雅思阅读【总学时】 24学时 教材选用 《剑桥雅思考试全真试题4-9》外语教研社 第一阶段:第一个月(4次*2h) 教学重点:基础词汇积累&定位信息,关键词的基本能力 授课内容: 1,扩充雅思基础阅读词汇。 2,学会寻找关键词,在原文中快速定位,教授雅思阅读中常见的3种题型:1heading sentence(找标题)summary(摘要填空) ture/false/not given(是非题) 再陈述与推理及true, false, not given 题的技巧。 培养学生雅思判断题需要的逻辑思维 4,教会学生读文章的步骤,利用文章中的图片图表信息做题。 模考安排:每4次课一次单科模考和分析反馈 第二阶段:第二个月(4次*2h) 教学重点:猜词与复杂句,基本题型的操练 授课内容:1,词根,词缀,词性,利用上下文猜词的能力;十大句子关系。 学会如何判断词性,句子成分,如何判断区分有用与无用的生词。 3,快速找到复杂句的重点,根据复杂句完成简单的问题;
英语图表作文常用句型
1 起伏不定go up and down / fluctuate/ be unstable/ be in flexible 2 The first point to note is the huge increase in the number of 需要注意的第一点就是…的急剧增 长 3 The statistics show that 这些数据表明 4 占百分之几 Form/comprise/make up/constitute/ account for ….percent 5 This graph describes the trend of 该图描述了…的趋势
6 The statistics lead us to the conclusion that 由这些数据,我们可以做出如下结论 8 增加:Increase / raise / rise / go up/ soar/ ascend/ mount/ climb 9 减少:Decrease / go down / drop / fall/ reduce/ descend/ shrink /decline/sink 10 稳定:Remain stable / stabilize / level off/ remain unchanged 11 It can be seen from the table that 由表格我们可以看出 12 The table shows the changes in the number of… over the period from…to… 该表格展示了从…到…数据的变化
英语考试作文-9分雅思图表写作范文全集之地图篇 学校变迁
英语考试作文 9分雅思图表写作范文全集之地图篇学校 变迁 9分雅思图表小作文范文全集之地图学校变迁The diagrams below show the site of a school in 2004 and the plan for changes to the school site in 2024. 真题传送门:2017全年雅思写作真题范文大汇总(第一时间更新) 范文集结:全部9篇9分雅思写作地图范文汇总放送 范文 The two pictures compare the layout of a school as it was in the year 2004 with a proposed site design for the year 2024. It is clear that the main change for 2024 involves the addition of a new school building. The school will then be able to accommodate a considerably larger number of students. In 2004, there were 600 pupils attending the school,
and the two school buildings were separated by a path running from the main entrance to the sports field. By 2024, it is expected that there will be 1000 pupils, and a third building will have been constructed. Furthermore, the plan is to join the two original buildings together, creating a shorter path that links the buildings only. As the third building and a second car park will be built on the site of the original sports field, a new, smaller sports field will need to be laid. A new road will also be built from the main entrance to the second car park. Finally, no changes will be made to the main entrance and original car park. (183 words, band 9)
雅思写作36个基础句型
雅思写作36个基础句型 1 benefit from 从……当中获益 例句:Others,however,believe that boys and girls benefit more from attending mixed schools.(剑8例句) 2 invest in 对……投资 例句:The government should invest a large proportion of its budget in helping the needy, despite the economic recession. 3 promote the development of 促进……的发展 例句:Even though the city has invested millions of pounds in museums and art galleries,it has done little to promote the development of education and medical care. 4 boost efficiency/productivity 提高效率/生产力 例句:The main question about high-tech education is whether it actually boosts the efficiency and effectiveness of learning. 5 play a pivotal role in 在……中起关键作用 例句:Vitamins and minerals play a pivotal role in keeping our body heathy;therefore,children and adults alike shoud eat more vegetables that are rich in various vitamins and minerals. 6 enrich one’s social/academic/professional experience 丰富……的社会的/学术的/职业的经历 例句:Working for a period before going to university can greatly enrich students’social experience and make them more capable in university. 7 keep society safe and stable 保持社会稳定 例句:Harmony keeps society safe and stable while conflict disturbs social order. 8 have a duty/obligation to do…有责任做… 例句:In most European countries,parents have a legal obligation to ensure that their children receive proper education. 9 relax their bodies and ease their minds 让人放松身心 例句:Children not only need opportunities to acquire knowledge ,they need time to relax their bodies and their minds as well. 10 be based on 基于 例句:Discipline should be based on a positive,loving parent child relationship instead of on force and punishment. 11 generate employment opportunities 创造就业机会 例句:International tourism can generate employment opportunities.On the other hand ,it may damage the culture heritage of a nation. 12 be less time-consuming and more economical 省钱又省时间 例句:Contrary to the popular belief ,advertising makes our shopping experience neither less time-consuming nor more economical. 13 relieve one’s academic/financial/psychological burden 减轻某人的学业/经济/心理负担 例句:Part-time jobs help students to relieve their parents’financial burdens.Nevertheless,working on a part-time basis may create psychological burdens for the students themselves. 14 fulfill one’s potential 发挥某人的潜力 例句:Employees may feel they cannot fulfill their professional potential when their work is not
雅思写作常用单词
雅思小作文必备词汇 图表chart = graph = diagram 直线line 曲线curve 柱bar /column 饼pie 表table = figures = statistics the thin(细线) / thick(粗线) / broken(虚线) / dotted(点线) line 表明,表示,阐明show , give information about,reveal,indicate,demonstrate 直线图类词汇 (上升类动词)Increase------------ decrease (下降类动词) go up-------------- go down rise up-------------- fall down climb-----------------slide ascend --------------decline keep an upward tendency ----keep a downward tendency 波动动词类:fluctuate fluctuate upward / downward(波动向上/向下) 保持平稳类动词: keep / remain / maintain / stay unchanged / constant / stable(形容词,不变的) 修饰动词的副词: slightly 轻微地,slowly 缓慢地,gradually 逐渐地,steadily 稳定地,rapidly 迅速地,significantly 明显地,sharply 明显地,dramatically急剧地, 修饰名词的形容词: slight, slow, gradual, steady, rapid, moderate, significant, sharp, dramatic 大约,大概,左右类词汇:almost / approximately / around / roughly / more or less / nearly 时间from … to …/during the period/ between … and … / starting from ….
雅思小作文之图表作文
二.雅思图表作文 1.企业垃圾(线性图) 题目:The graph below shows the amounts of waste produced by three companies over a period of 15 years. 范文:The line graph compares three companies in terms of their waste output between the years 2000 and 2015. It is clear that there were significant changes in the amounts of waste produced by all three companies shown on the graph. While companies A and B saw waste output fall over the 15-year period, the amount of waste produced by company C increased considerably. In 2000, company A produced 12 tonnes of waste, while companies B and C produced around 8 tonnes and 4 tonnes of waste material respectively. Over the following 5 years, the waste output of companies B and C rose by around 2 tonnes, but the figure for company A fell by approximately 1 tonne. From 2005 to 2015, company A cut waste production by roughly 3 tonnes, and company B reduced its waste by around 7 tonnes. By contrast, company C saw an increase
雅思写作最失败的文章开头
雅思写作最失败的文章开头 废话连篇不知所云(喷血指数:☆☆☆) 典型失败案例:Topic 1-Should college students be allowed to get married? This topic is very interesting. I'm very interested in talking about this topic. Because I'm also a college student and I'm not married…… 修改方案:开门见山直奔主题 In my opinion, it would not be a wise decision to allow college students to get married. Topic 2-Will modern technology, such as the Internet, ever replace the book or the writing word as the sole source of information? (雅思真题) Ok, this topic is a very good topic. First, let me tell you a story: I have a friend, he likes go on the internet very much. Every day, he uses internet to read news or play internet games. So we can see the internet is more and more important in our daily life. Topic 3-The importance of environmental protection Oh, this topic is surely very important. Isn't it? Of
雅思图表作文数据描述例句
雅思图表作文数据描述例句 表示上升和下降的说法: 1.The proportion of the people who were divorced went up from 2.5% in 1981 to 7.5% in 1991, rising further to 8% in 2001. 2.The crop yields worldwide in 1990 were 15% up on those of 1985. 3. The number of shoppers during the Christmas period plunged by up to 23 per cent since then on. 4. After five years of steady decline, the high-school drop-out rate started to rise. 5. Oil consumption grew steadily from 1980 to 2000, apart from in 1990, when there was a drop of 5 per cent. 6. House prices fell as much as 40% between 1980 and 1985, compared with the period 1986 to 1990, when prices roughly doubled. 7. Arable land was being lost at the rate of over 38 thousand square miles per year throughout the 1980s. 8. Exports topped $10 billion in 2006, with those to Asia Pacific in excess of $2 billion. 9. The smoking rate in young girls was on the rise, similar to that among adult women. 10. Motorcycle casualities were in decline, down from a total of 54,037 in 1995 to 38,090 in 2000. 11. Gender equality would lead to 13.4 million fewer homeless children, a 13% reduction. 12. Inflation is likely to moderate through the early months of 2007. 13. The number of married couples showed a significant decline, accounting for 50.7% of the adult population, compared with 68% in 1971. 14. The smaller gap between movie-goers and television viewers reflected a 5% drop in the number of people who g to the cinema and a 1.2% increase in those who enjoy watching TV at home. 表示占据的说法: 15. Volunteers constitute nearly half of the work force of the health care sector. 16. While Asians account for 11% of the American population, Hispanics comprise 8%. 17. Women make up 52 % of the population of Britain.\18. 18. Landfill is composed of 36% municipal waste, 24% commercial and industrial waste and 40% construction waste. 表示倍数的说法: 19. Rent as a percentage of the household expenditure more than doubled between 1974 and 1998, from 5% to 12%. 20. Britons were twice as likely to die from hear attacks as Italians and three times as Chinese. 21. Women working as childminders in the under-35 age group in 1995 were almost twice as many as in 1990. 22. Television was twice as popular as washing machine in 1990, with close to 10% of households owning one TV set at home. 23. Young people used the Internet more than three times as often as the general population in 1999. 24. The study found that people who earned more than $100,000 received nearly 50% more junk mails than lower carners. 25. It also found that those on higher incomes lost on average four times more money than other victims in property-related crime. 26. China’s agricultural trade deficit against US jumped 1.5 times to $ 35 billion over the five-year period. 读数据的方法: 27. A quarter of the customers were African origin. 28. Some 700 migrants arrived to live in Australia every week in 2005. 29. Of course UK residents who traveled overseas, some 210,000 went to America. 30. The overall UK population was some 58 million in 2001, 17% higher than in 1951. 31. With an estimated 100 million international migrants worldwide, the proportion of people living outside their country of birth approached 2% of the world’s population in 2002.
(管理流程图)雅思A类图表作文各个击破(流程图、柱图、曲线、表格)免费
A类图表作文各个击破(流程图、柱图、曲线图、表格) .5.2表格 4.5.2.1解题关键 F 1表格与饼图一样,都是静态图。切入点在描述分配; F 2表格题考查列举数字的能力和方法。通过举一些有代表性的数据来说明问题; F 3横向比较。介绍横向各个数据的区别、变化和趋势; F 4纵向比较。介绍纵向各个数据的区别、变化和趋势; F 5不需要将每一个数据分别说明,突出强调数据最大值和最小值; F 6对比时要总结出数据对比最悬殊的和最小的。 4.5.2.2表格举例 Topic 4-4:The table below shows carbon dioxide emissions from transport in three European countries in 1994 and 2004.Summarise the information by selecting and reporting the main features and make comparisons where relevant.(表格贴不上,大家看附件吧~ ^_^)范文
The given table provides an overview of carbon dioxide emissions from four main transport sources (namely,road transport,railways,civil aviation and shipping) in the United Kingdom,France and Germany in 1994 and 2004. Germany,although having higher emissions than either the United Kingdom or France did,saw the amount decrease slightly from 47.2 to 46.7 million tonnes.By comparison,France recorded an increase of four million tonnes from 34.7 million in 1994,while the United Kingdom had a smaller growth,2.5 million tonnes over the same period.(纵向比较三个国家1994到2004年间二氧化碳释放量的整体趋势变化。) In all the three countries, road transport was responsible for the majority of emissions.(横向对四个二氧化碳释放源进行比较,点明最大释放源)In the United Kingdom,road transport produced emissions up to 32.6 million tonnes in 2004,2 million more than ten years earlier,while other three transport sources did not show any remarkable growth.(接着对三个国家的释放源进行描述说明,说明从1994年到2004年间的变化)A similar pattern was seen in France,where road transport added 3.6 million tonnes to the total emissions within ten
顾家北手把手教你雅思写作全文翻译表格
本文档配合《顾家北手把手教你雅思写作(剑10)》版使用使用方法:每句话下面预留两行空格, 第一行写自己的翻译,第二行写顾家北的翻译与批阅。 全文翻译1:遵守规则论述类题目写作要点 Some people think that children should obey the rules or do what their parents and teachers want them to do. Other people think children controlled too much cannot deal with problem themselves in adulthood. Discuss both views and state your own opinion.
全文翻译2:老龄化社会+观点类( advantage/disadvantage ) +段落的数量In many countries, the proportion of older people is steadily increasing. Does this trend have positive or negative effects on society?
全文翻译3:看电视学习+观点类( agree/disagree ) +写作要点
Some people believe that children can learn effectively by watching TV and they should be encouraged to watch TV both at home and at school. To what extent do you agree or disagree?
雅思写作常用万能句型
常用万能句型: 1、Nothing has received more praise and abuse than something 译文:没有什么能像…这样毁誉参半。 2、There is no doubt that 译文:毫无疑问 3、The reason why + 句子~~~ is that + 句子 译文:之所以…主要在于 4 、So + 形容词+ be + 主词+ that + 句子(如此…以至于…) 译文:如此…因此 5、It is conceivable that + 句子 译文:可想而知 6 、Leave much to be desired 译文:…远不能令人满意 7、The most obvious reason for this phenomenon is that 译文:造成该现象的最主要原因在于 8 、A is to B what C is to D 译文:A 对于B 就恰如C对于D 9 、There are probably many reasons contributing to this phenomenon 译文:造成该现象的原因有许多。 10、When it comes to ……, 译文:一谈到… 11、No one can deny the fact that…
译文:没有人能否认 12、To be sure, the topic concerning ……can always attract our eyes 译文:无疑,有关…话题总是能够引起人们的关注 13、Never has …failed to fascinate us in modern society 译文:在当代社会…总是能够引起人们的关注 14、Simply put,… 译文:简而言之, 15、It is no overstatement to say that 译文:可以毫不夸张地说 16、…is a good case in point 译文:…就是一个绝佳的例子 17、People assume different attitudes towards this issue 译文:人们对该问题的观点不一而同。 18、As is widely-accepted,… 译文:众所周知, 19、To conclude,… 译文:总之, 20、Nothing is further from the truth than this opinion 译文:没有任罕菊净种说法比这种观点更加荒唐了。 21、There is an element of truth in both opinions 译文:这两种观点都有其可取之处。 22、Another consideration in this case is that…