bruechap017
Monotonic d-wave Superconducting Gap in Optimally-Doped Bi$_2$Sr$_{1.6}$La$_{0.4}$CuO$_6$ S
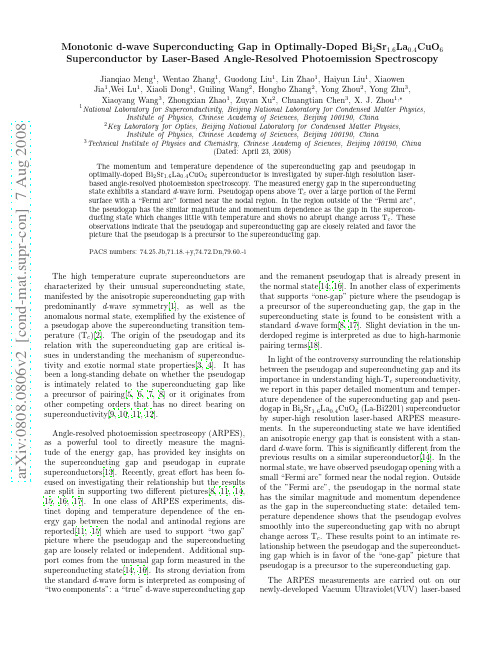
a r X i v :0808.0806v 2 [c o n d -m a t .s u p r -c o n ] 7 A u g 2008Monotonic d-wave Superconducting Gap in Optimally-Doped Bi 2Sr 1.6La 0.4CuO 6Superconductor by Laser-Based Angle-Resolved Photoemission SpectroscopyJianqiao Meng 1,Wentao Zhang 1,Guodong Liu 1,Lin Zhao 1,Haiyun Liu 1,Xiaowen Jia 1,Wei Lu 1,Xiaoli Dong 1,Guiling Wang 2,Hongbo Zhang 2,Yong Zhou 2,Yong Zhu 3,Xiaoyang Wang 3,Zhongxian Zhao 1,Zuyan Xu 2,Chuangtian Chen 3,X.J.Zhou 1,∗1National Laboratory for Superconductivity,Beijing National Laboratory for Condensed Matter Physics,Institute of Physics,Chinese Academy of Sciences,Beijing 100190,China2Key Laboratory for Optics,Beijing National Laboratory for Condensed Matter Physics,Institute of Physics,Chinese Academy of Sciences,Beijing 100190,China3Technical Institute of Physics and Chemistry,Chinese Academy of Sciences,Beijing 100190,China(Dated:April 23,2008)The momentum and temperature dependence of the superconducting gap and pseudogap in optimally-doped Bi 2Sr 1.6La 0.4CuO 6superconductor is investigated by super-high resolution laser-based angle-resolved photoemission spectroscopy.The measured energy gap in the superconducting state exhibits a standard d -wave form.Pseudogap opens above T c over a large portion of the Fermi surface with a “Fermi arc”formed near the nodal region.In the region outside of the “Fermi arc”,the pseudogap has the similar magnitude and momentum dependence as the gap in the supercon-ducting state which changes little with temperature and shows no abrupt change across T c .These observations indicate that the pseudogap and superconducting gap are closely related and favor the picture that the pseudogap is a precursor to the superconducting gap.PACS numbers:74.25.Jb,71.18.+y,74.72.Dn,79.60.-iThe high temperature cuprate superconductors are characterized by their unusual superconducting state,manifested by the anisotropic superconducting gap with predominantly d -wave symmetry[1],as well as the anomalous normal state,exemplified by the existence of a pseudogap above the superconducting transition tem-perature (T c )[2].The origin of the pseudogap and its relation with the superconducting gap are critical is-sues in understanding the mechanism of superconduc-tivity and exotic normal state properties[3,4].It has been a long-standing debate on whether the pseudogap is intimately related to the superconducting gap like a precursor of pairing[5,6,7,8]or it originates from other competing orders that has no direct bearing on superconductivity[9,10,11,12].Angle-resolved photoemission spectroscopy (ARPES),as a powerful tool to directly measure the magni-tude of the energy gap,has provided key insights on the superconducting gap and pseudogap in cuprate superconductors[13].Recently,great effort has been fo-cused on investigating their relationship but the results are split in supporting two different pictures[8,11,14,15,16,17].In one class of ARPES experiments,dis-tinct doping and temperature dependence of the en-ergy gap between the nodal and antinodal regions are reported[11,15]which are used to support “two gap”picture where the pseudogap and the superconducting gap are loosely related or independent.Additional sup-port comes from the unusual gap form measured in the superconducting state[14,16].Its strong deviation from the standard d -wave form is interpreted as composing of “two components”:a “true”d-wave superconducting gapand the remanent pseudogap that is already present in the normal state[14,16].In another class of experiments that supports “one-gap”picture where the pseudogap is a precursor of the superconducting gap,the gap in the superconducting state is found to be consistent with a standard d -wave form[8,17].Slight deviation in the un-derdoped regime is interpreted as due to high-harmonic pairing terms[18].In light of the controversy surrounding the relationship between the pseudogap and superconducting gap and its importance in understanding high-T c superconductivity,we report in this paper detailed momentum and temper-ature dependence of the superconducting gap and pseu-dogap in Bi 2Sr 1.6La 0.4CuO 6(La-Bi2201)superconductor by super-high resolution laser-based ARPES measure-ments.In the superconducting state we have identified an anisotropic energy gap that is consistent with a stan-dard d -wave form.This is significantly different from the previous results on a similar superconductor[14].In the normal state,we have observed pseudogap opening with a small “Fermi arc”formed near the nodal region.Outside of the ”Fermi arc”,the pseudogap in the normal state has the similar magnitude and momentum dependence as the gap in the superconducting state:detailed tem-perature dependence shows that the pseudogap evolves smoothly into the superconducting gap with no abrupt change across T c .These results point to an intimate re-lationship between the pseudogap and the superconduct-ing gap which is in favor of the “one-gap”picture that pseudogap is a precursor to the superconducting gap.The ARPES measurements are carried out on our newly-developed Vacuum Ultraviolet(VUV)laser-based2E - EF (eV)E - EF (eV)1.00.50G (0,0)(p ,0)1510152025k xFIG.1:Fermi surface of the optimally-doped La-Bi2201(T c =32K)and corresponding photoemission spectra (EDCs)on the Fermi surface at various temperatures.(a).Spectral weight as a function of two-dimensional momentum (k x ,k y )integrated over [-5meV,5meV]energy window with respect to the Fermi level E F .The measured Fermi momenta are marked by red empty circles and labeled by numbers;(b).Original EDCs along the Fermi surface measured at 15K.The symmetrized EDCs along the Fermi surface are shown in (c)for 15K,(d)for 25K and (e and f)for 40K.The numbers on panels (b-f)corresponds to the Fermi momentum numbers in (a).angle-resolved photoemission system with advantages of super-high energy resolution,high momentum resolution,high photon flux and enhanced bulk sensitivity[19].The photon energy is 6.994eV with a bandwidth of 0.26meV and the energy resolution of the electron energy analyzer (Scienta R4000)was set at 0.5meV,giving rise to an overall energy resolution of 0.56meV.The angular res-olution is ∼0.3◦,corresponding to a momentum resolu-tion ∼0.004˚A −1at the photon energy of 6.994eV.The optimally doped Bi 2Sr 2−x La x CuO 6(La-Bi2201)(x=0.4,T c ∼32K,transition width ∼2K)single crystals were grown by the traveling solvent floating zone method[20].One advantage of choosing La-Bi2201system lies in its relatively low superconducting transition temperature that is desirable in investigating the normal state behav-ior with suppressed thermal broadening of photoemission spectra.The samples are cleaved in situ in vacuum with a base pressure better than 4×10⁻¹¹Torr.Fig.1(a)shows the Fermi surface mapping of the op-timally doped La-Bi2201(T c =32K)measured at 15K.The low photon energy and high photon flux have made it possible to take dense sampling of the measurements in the momentum space.The photoemission spectra (En-ergy Distribution Curves,EDCs)along the Fermi surface are plotted in Fig.1(b).The EDCs near the nodal re-gion show sharp peaks that are similar to those observed in Bi2212[21].When the momentum moves away from the nodal region to the (0,π)antinodal region,the EDC peaks get weaker,but peak feature remains along the en-tire Fermi surface even for the one close to the antinodal region.The EDC peak position also shifts away from the Fermi level when the momentum moves from the nodal to the antinodal region,indicating a gap opening in the superconducting state.Note that the EDCs near the antinodal region do not show any feature near 40meV that was reported in a previous measurement[14].In order to extract the energy gap,we have sym-metrized the original EDCs with respect to the Fermi level,as shown in Fig.1c for the 15K measurements,and Fig.1d and Fig.1(e-f)for 25K and 40K,respec-tively.The symmetrization procedure not only provides an intuitive way in visualizing the energy gap,but also removes the effect of Fermi cutoffin photoemission spec-tra and provides a quantitative way in extracting the gap size[22].The symmetrized EDCs have been fitted using the general phenomenological form[22];the fitted curves are overlaid in Fig.1(c-f)and the extracted gap size is plotted in Fig.2.As shown in Fig.2,the gap in the superconducting state exhibits a clear anisotropic behavior that is consis-tent with a standard d -wave form ∆=∆0cos(2Φ)(or in a more strict sense,∆=∆0|cos (k x a )−cos (k y a )|/2form as shown in the inset of Fig.2)with a maximum energy gap ∆0=15.5meV.It is also interesting to note that the gap is nearly identical for the 15K and 25K measurements for such a T c =32K superconductor.These results are significantly different from a recent measurement where the gap in the superconducting state deviates strongly from the standard d -wave form with an antinodal gap at 40meV[14].An earlier measurement[23]gave an antin-3G a p S i z e (m e V )Angle F (degrees)FIG.2:Energy gap along the Fermi surface measured at 15K (solid circles),25K (empty circles)and 40K (empty squares)on the optimally-doped La-Bi2201(T c =32K).The solid red line is fitted from the measured data at 15K which gives ∆=15.5cos(2Φ).The Φangle is defined as shown in the bottom-right inset.The upper-right inset shows the gap size as a function of |cos (k x a )−cos (k y a )|/2at 15K and 25K.The pink line represents a fitted line with ∆=15.5|cos (k x a )−cos (k y a )|/2.odal gap at 10∼12meV which is close to our present mea-surement,but it also reported strong deviation from the standard d -wave form.While the non-d -wave energy gap can be interpreted ascomposed of two components in the previous measurement[14],our present results clearly in-dicate that the gap in the superconducting state is dom-inated by a d -wave component.In the normal state above T c =32K,the Fermi sur-face measured at 40K is still gapped over a large portion except for the section near the nodal region that shows a zero gap,as seen from the symmetrized EDCs (Fig.1e-f for 40K)and the extracted pseudo-gap (40K data in Fig.2).This is consistent with the “Fermi arc”picture observed in other high temperature superconductors[6,11,24].Note that the pseudogap out-side of the “Fermi arc”region shows similar magnitude and momentum dependence as the gap in the supercon-ducting state (Fig.2).Fig.3shows detailed temperature dependence of EDCs and the associated energy gap for two representa-tive momenta on the Fermi surface.Strong temperature dependence of the EDCs is observed for the Fermi mo-mentum A (Fig.3a).At high temperatures like 100K or above,the EDCs show a broad hump structure near -0.2eV with no observable peak near the Fermi level.Upon cooling,the high-energy -0.2eV broad hump shows little change with temperature,while a new structure emerges near the Fermi level and develops into a sharp “quasipar-ticle”peak in the superconducting state,giving rise to a peak-dip-hump structure in EDCs.This temperatureE - EF (eV)E - EF (eV)FIG.3:(a,b).Temperature dependence of representa-tive EDCs at two Fermi momenta on the Fermi surface in optimally-doped La-Bi2201.The location of the Fermi mo-menta is indicated in the inset.Detailed temperature depen-dence of the symmetrized EDCs for the Fermi momentum A are shown in (c)and for the Fermi momentum B in (d).The dashed lines in (c)and (d)serve as a guide to the eye.evolution and peak-dip-hump structure are reminiscent to that observed in other high temperature superconduc-tors like Bi2212[25].When moving towards the antin-odal region,as for the Fermi momentum B (Fig.3b),the EDCs qualitatively show similar behavior although the temperature effect gets much weaker.One can still see a weak peak developed at low temperatures,e.g.,13K,near the Fermi level.To examine the evolution of the energy gap with tem-perature,Fig.3c and 3d show symmetrized EDCs mea-sured at different temperatures for the Fermi momenta A and B,respectively.The gap size extracted by fit-ting the symmetrized EDCs with the general formula[22]are plotted in Fig. 4.For the Fermi momentum A,as seen from Fig.3c,signature of gap opening in the su-perconducting state persists above T c =32K,remaining obvious at 50K,getting less clear at 75K,and appear to disappear around 100K and above as evidenced by the appearance of a broad peak.The gap size below 50K (Fig.4)shows little change with temperature and no abrupt change is observed across T c .The data at 75K is hard to fit to get a reliable gap size,thus not included in Fig. 4.When the momentum moves closer to the antinodal region,as for the Fermi momentum B,simi-lar behaviors are observed,i.e.,below 50K,the gap size is nearly a constant without an abrupt change near T c .But in this case,different from the Fermi momentum A,4G a p S i z e (m e V )Temperature(K)FIG.4:Temperature dependence of the energy gap for two Fermi momenta A (empty squares)and B (empty circles)as indicated in insets of Fig.3(a)and (b),and also indicated in the up-right inset,for optimally-doped La-Bi2201.The dashed line indicates T c =32K.there is no broad peak recovered above 100K,probably indicating a higher pseudogap temperature.This is qual-itatively consistent with the transport[26]and NMR[27]measurements on the same material that give a pseudo-gap temperature between 100∼150K.From precise gap measurement,there are clear signa-tures that can distinct between “one-gap”and “two-gap”scenarios[4].In the “two-gap”picture where the pseudo-gap and superconducting gap are assumed independent,because the superconducting gap opens below T c in addi-tion to the pseudogap that already opens in the normal state and persists into the superconducting state,one would expect to observe two effects:(1).Deviation of the energy gap from a standard d -wave form in the super-conducting state with a possible break in the measured gap form[14];(2).Outside of the “Fermi arc”region,one should expect to see an increase in gap size in the superconducting state.Our observations of standard d -wave form in the superconducting state (Fig.2),similar magnitude and momentum dependence of the pseudogap and the gap in the superconducting state outside of the “Fermi arc”region (Fig.2),smooth evolution of the gap size across T c and no indication of gap size increase upon entering the superconducting state (Fig.4),are not com-patible with the expectations of the “two-gap”picture.They favor the “one-gap”picture where the pseudogap and superconducting gap are closely related and the pseu-dogap transforms into the superconducting gap across T c .Note that,although the region outside of the “Fermi arc”shows little change of the gap size with temperature (Fig.4),the EDCs exhibit strong temperature depen-dence with a “quasiparticle”peak developed in the su-perconducting state(Fig.3a and 3b)that can be related with the establishment of phase coherence[8,25].This suggests that the pseudogap region on the Fermi surface can sense the occurrence of superconductivity through acquiring phase coherence.In conclusion,from our precise measurements on the detailed momentum and temperature dependence of the energy gap in optimally doped La-Bi2201,we provide clear evidence to show that the pseudogap and super-conducting gap are intimately related.Our observations are in favor of the “one-gap”picture that the pseudogap is a precursor to the superconducting gap and supercon-ductivity is realized by establishing a phase coherence.We acknowledge helpful discussions with T.Xi-ang.This work is supported by the NSFC(10525417and 10734120),the MOST of China (973project No:2006CB601002,2006CB921302),and CAS (Projects IT-SNEM and 100-Talent).∗Corresponding author:XJZhou@[1]See,e.g.,C.C.Tsuei and J.R.Kirtley,Rev.Mod.Phys.72,969(2000).[2]T.Timusk and B.Statt,Rep.Prog.Phys.62,61(1999).[3]V.J.Emery and S.A.Kivelson,Nature (London)374,434(1995);X.G.Wen and P.A.Lee,Phys.Rev.Lett.76,503(1996);C.M.Varma,Phys.Rev.Lett.83,3538(1999);S.Chakravarty et al.,Phys.Rev.B 63,094503(2001);P.W.Anderson,Phys.Rev.Lett.96,017001(2006).[4]lis,Science 314,1888(2006).[5]Ch.Renner et al.,Phys.Rev.Lett.80,149(1998).[6]M.R.Norman et al.,Nature (London)392,157(1998).[7]Y.Y.Wang et al.,Phys.Rev.B 73,024510(2006).[8]A.Kanigel et al.,Phys.Rev.Lett.99,157001(2007).[9]G.Deytscher,Nature (London)397,410(1999).[10]M.Le.Tacon et al.,Nature Phys.2,537(2006).[11]K.Tanaka et al.,Scinece 314,1910(2006).[12]M.C.Boyer et al.,Nature Phys.3,802(2007).[13]A.Damascelli et al.,Rev.Mod.Phys.75,473(2003);J.C.Campuzano et al.,in The Physics of Superconductors,Vol.2,edited by K.H.Bennemann and J.B.Ketterson,(Springer,2004).[14]T.Kondo et al.,Phys.Rev.Lett.98,267004(2007).[15]W.S.Lee et al.,Nature (London)450,81(2007).[16]K.Terashima et al.,Phys.Rev.Lett.99,017003(2007).[17]M.Shi et al.,arXiv:cond-mat/0708.2333.[18]J.Mesot et al.,Phys.Rev.Lett.83,840(1999).[19]G.D Liu et al.,Rev.Sci.Instruments 79,023105(2008).[20]J.Q.Meng et al.,unpublished work.[21]W.T.Zhang et al.,arXiv:cond-mat/0801.2824.[22]M.R.Norman et al.,Phys.Rev.B 57,R11093(1998).[23]J.M.Harris et al.,Phys.Rev.Lett.79,143(1997).[24]A.Kanigel et al.,Nature Phys.2447(2006).[25]A.V.Fedorov et al.,Phys.Rev.Lett.82,2179(1999);D.L.Feng et al.,Science 289,277(2000);H.Ding et al.,Phys.Rev.Lett.87,227001(2001).[26]Y.Ando et al.,Phys.Rev.Lett.93,267001(2004).[27]G.-Q.Zheng et al.,Phys.Rev.Lett.94,047006(2005).。
Chapter 1 Introduction to Computers, Programs, and Java

Chapter 6 Arrays
Chapter 23 Algorithm Efficiency and Sorting
Liang, Introduction to Java Programming, Sixth Edition, (c) 2007 Pearson Education, Inc. All rights reserved. 0-13-222158-6
Liang, Introduction to Java Programming, Sixth Edition, (c) 2007 Pearson Education, Inc. All rights reserved. 0-
Memory is to store data and program instructions for CPU to execute. A memory unit is an ordered sequence of bytes, each holds eight bits. A program and its data must be brought to memory before they can be executed. A memory byte is never empty, but its initial content may be meaningless to your program. The current content of a memory byte is lost whenever new information is placed in it.
1
Objectives
To review computer basics, programs, and operating systems (§1.2-1.4). To represent numbers in binary, decimal, and hexadecimal (§1.5 Optional). To understand the relationship between Java and the World Wide Web (§1.6). To know Java’s advantages (§1.7). To distinguish the terms API, IDE, and JDK (§1.8). To write a simple Java program (§1.9). To create, compile, and run Java programs (§1.10). To understand the Java runtime environment (§1.10). To know the basic syntax of a Java program (§1.11). To display output on the console and on the dialog box (§1.12).
2015_-_Jian_Geng_-_Thestabilityofboundchloridesincementpastewithsulfa[retrieved_2015-09-23]
![2015_-_Jian_Geng_-_Thestabilityofboundchloridesincementpastewithsulfa[retrieved_2015-09-23]](https://img.taocdn.com/s3/m/c873140459eef8c75fbfb32d.png)
The stability of bound chlorides in cement paste with sulfate attackJian Geng a ,b ,⁎,Dave Easterbrook b ,Long-yuan Li b ,Li-wei Mo aa Research Center of Green Building Materials and Waste Resources Reuse,Ningbo Institute of Technology,Zhejiang University,China bSchool of Marine Science and Engineering,University of Plymouth,UKa b s t r a c ta r t i c l e i n f o Article history:Received 10July 2014Accepted 25November 2014Available online 27December 2014Keywords:Sulfate attack (C)Bound chlorides (D)Stability (C)Fly ash (D)Ground granulated blast-furnace slag (D)This paper presents an experimental investigation on the stability of bound chlorides in chloride-contaminated cement pastes with and without FA/GGBS when subjected to Na 2SO 4and MgSO 4attack.It is shown that bound chlorides were released in the chloride-contaminated pastes when exposed to Na 2SO 4or MgSO 4solution.This is mainly attributed to the decomposition of Friedel's salt (FS),where Cl −bound in FS is replaced by SO 42−.How-ever there were fewer released chlorides found in the pastes exposed to MgSO 4solution than in those exposed to Na 2SO 4solution.This is partly due to the low pH in the pore solution and partly due to the blocking effect of brucite on ionic transport caused by MgSO 4.The inclusion of FA/GGBS in concrete can increase the decomposition of FS and thus the release of bound chlorides.However,it also resists the penetration of Na 2SO 4and thus reduces the attack of Na 2SO 4.©2014Elsevier Ltd.All rights reserved.1.IntroductionThe corrosion of reinforcing steel in concrete structures,due to chlo-ride ion contamination,is one of the main reasons for the deterioration of concrete structures.There are two forms of chloride ions in concrete.One is free chlorides and the other is bound chlorides.It is well-known that the corrosion of reinforcing steel is mainly induced by the free chlo-rides,so reducing free chlorides by increasing bound chlorides will be bene ficial to the durability of concrete structures.According to the bind-ing mechanism,chloride ions can be bound through chemical reactions and physical absorption.In the former,chloride ions are mainly bound in Friedel's salt (FS)(3CaO·Al 2O 3·CaCl 2·10H 2O)through hydration reactions between chloride ions,tricalcium aluminate (C 3A)and its hydration products.In the latter,chloride ions are mainly absorbed by calcium silicate hydrate (C –S –H gel).It was reported that the formation of bound chlorides could be affected by a multitude of factors such as the quantity of C 3A in cement,supplementary cementitious materials (SCM),alkalinity of pore solution,Ca/Si and Ca/Al of hydration products,chloride salt type,and service condition of concrete structures [1–5].In summary,the chloride binding capacity of concrete can be improved by using SCM or cement with high C 3A content.However,many researchers have identi fied that the stability of bound chlorides,espe-cially of FS,can be affected by pH,carbonation,and chemical erosion [6–9].Sulfate attack is another problem for the durability of concrete struc-tures.The attack of sodium sulfate (Na 2SO 4)and magnesium sulfate (MgSO 4)on concrete is a common phenomenon.The mechanisms of Na 2SO 4and MgSO 4attack on concrete are different,mainly due to the solubility of phases formed with sodium and magnesium ions [10–12].With regard to Na 2SO 4attack,the deterioration of concrete is attributed to the formation of expansion products such as gypsum (CaSO 4·2H 2O)and secondary ettringite (AFt)(3CaO·Al 2O 3·3CaSO 4·32H 2O)according to the following equations:Ca ðOH Þ2þNa 2SO 4þ2H 2O →CaSO 4·2H 2O þ2NaOHð1Þ3ðCaSO 4·2H 2O Þþ3CaO ·Al 2O 3þ26H 2O →3CaO ·Al 2O 3·3CaSO 4·32H 2Oð2Þ2ðCaSO 4·2H 2O Þþ3CaO ·Al 2O 3·CaSO 4·12H 2O þ16H 2O →3CaO ·Al 2O 3·3CaSO 4·32H 2O :ð3ÞWhereas for MgSO 4attack,the transformation of the cementitious C –S –H gel to the non-cementitious magnesium silicate hydrate mush (M –S –H),which has very little strength,is the main reason for the dete-rioration of concrete,although gypsum and secondary AFt are also formed during the attack.In addition,brucite,i.e.Mg(OH)2,will form when magnesium is present in the pore solution,which has low solubil-ity and could densify the pore system and thus affect the transport ofCement and Concrete Research 68(2015)211–222⁎Corresponding author.E-mail address:gengjian@ (J.Geng)./10.1016/j.cemconres.2014.11.0100008-8846/©2014Elsevier Ltd.All rightsreserved.Contents lists available at ScienceDirectCement and Concrete Researchj o u rn a l h o m e p a g e :h t tp ://e e s.e l s e v i e r.c o m /C EM C O N /d e f a u l t.a s pions in the cement paste.The mechanism of MgSO4attack occurs according to the following equations:CaðOHÞ2þMgSO4þ2H2O→CaSO4·2H2OþMgðOHÞ2ð4Þx CaO·y SiO2·z H2Oþx MgSO4þð3xþ0:5y−zÞH2O→xðCaSO4·2H2OÞþx MgðOHÞ2þ0:5yð2SiO2·H2OÞð5Þ4MgðOHÞ2þSiO2·nH2O→4MgO·SiO2·8:5H2Oþðn−4:5ÞH2O:ð6ÞIn fact,sulfate attack and chloride contamination are often found to coexist in concrete structures which are exposed to marine and saline environments.The effects of the sulfate and chloride on a concrete structure's durability are multifaceted.On the one hand,the existence of sulfate,especially of Na2SO4,inhibits the formation of FS and reduces the quantity of bound chlorides[13–15].On the other hand,the exis-tence of chloride ions is beneficial for the resistance of concrete to Na2SO4and MgSO4attack[15–18].However,Baghabra argued that the effect of chloride ions on MgSO4attack was slight because the trans-formation of cementitious C–S–H gel to non-cementitious M–S–H was not affected by chloride ions[19].Despite the work on the interaction of sulfate and chloride in con-crete mentioned above,there is very little work on the effect of sulfate attack on the stability of bound chlorides in concrete.Brown and Badger investigated the distributions of bound sulfates and chlorides infield concrete cores exposed to mixed NaCl,Na2SO4and MgSO4attack. They found that there was extensive AFt in the absence of a gypsum zone for some concrete cores[20].Xu et al.obtained similar results, i.e.that sulfate attack could lead to the release of bound chlorides[21]. Both studies suggested the transformation of FS to AFt due to sulfate attack,but the mechanism of FS transform to AFt and the stability of bound chlorides absorbed by C–S–H gel under sulfate attack were not discussed in depth.It is well known that the use offly ash(FA)and ground granulated blast-furnace slag(GGBS)in concrete can not only improve the chloride binding capacity of concrete,but also the resistance of concrete to sulfate attack[22,23].Hence,it would be interesting to know how they affect the stability of bound chlorides when the concrete is under sulfate attack.The purpose of this paper is to report the experimental in-vestigation on the stability of bound chlorides in cement paste under Na2SO4and MgSO4attack,and the corresponding influence of FA and GGBS on the stability of bound chlorides.The stability of bound chlorides in cement paste was examined by analyzing the change of a dimensionless index,R cl,which represents the mass ratio of bound chlo-rides to initial total chlorides in the sample after it was exposed to a5% Na2SO4solution or a5%MgSO4solution for28,56or90days.The mech-anisms of the release of bound chlorides are discussed based on the results of X-ray diffraction(XRD),Fourier transform infrared(FT-IR) and differential thermo-gravimetric analysis(DTG).2.Experiment2.1.MaterialsThe materials used in the experiments were Type42.5Ordinary Portland Cement(OPC),grade II FA and GGBS.The chemical composi-tions of OPC,FA and GGBS are listed in Table1.The potential phase com-positions of OPC,calculated from chemical analysis by Bogue,are given in Table2.All other chemical reagents used in the experiments,but not listed in the tables,are analytically pure.2.2.MethodsIn order to reduce the experimental running time but still able to achieve good and representative results,chloride binding was achieved by using0.5mol/L NaCl solution as the mixing water for the casting of samples.The mass ratio of the mixing water to the binder(cement and SCM)was0.5,which was the same for all samples.The influence of single and combined use of FA and GGBS on the stability of bound chlorides was also investigated.The replacement of cement with SCM was30%by weight,and the proportions of FA to GGBS in the combined samples were either1:1or7:3.The detailed mix proportions of the samples tested are listed in Table3.A total of106samples were tested.All samples were of a size of 40mm×40mm×160mm.There were three groups of samples.The first group(2×5×7samples)were cured at a standard curing condi-tion(20±2°C and95%RH)for periods of1,3,7,14,28,56and90days for the investigation of the effect of curing time and SCM on the evolu-tion of bound chlorides in the cement paste.The second group(2×5×3 samples)were examined for the effect of Na2SO4attack on the stability of bound chlorides.In this group,all samples,after the56days standard curing,were dried at a room temperature(20±2°C and60%RH)for 1day.Then,for each sample itsfive surfaces were sealed by paraffin wax and one40mm×40mm surface was left untouched.After then, all samples were immersed in a covered plastic container(575mm ×400mm×275mm)of5%Na2SO4solution for28,56and90days at the standard curing condition(20±2°C and95%RH).The third group(2×1×3samples)were for the samples only with OPC,which were cured as the same as those done in the second group.The only dif-ference is that they were immersed in a similar covered container of5% MgSO4solution for28,56and90days at the standard curing condition (20±2°C and95%RH)for the examination of the effect of MgSO4at-tack on the stability of bound chlorides.The volume of the sulfate solu-tions used in the immersion tests was25L and the storage solutions were not renewed during the immersed tests.In the second and third groups,when the attack time reached28,56, and90days,the samples were dried at room temperature for1day,and then were sliced into four pieces parallel to the exposed surface (starting from the exposed surface)and each piece is one cm thick. Afterwards,each piece was broken into small blocks,which were then immersed in anhydrous ethanol for7days to terminate hydration. These small blocks were ground intofine powder by passing through a sieve of0.15mm mesh aperture size,which was then stored in a des-iccator with silica gel and soda lime at11%RH to minimize carbonation before it was used in the tests for chloride content titration and other material characterization analyses.The initial total chloride content(C t)of the sample cured at the stan-dard curing condition can be calculated based on the mixing water of Table1Chemical composition of main materials(data presented by mass%).SiO2CaO MgO Fe2O3Al2O3SO3Ignition loss OPC19.6760.43 4.56 4.20 5.70 2.30 2.54FA43.10 6.300.247.2638.200.70 2.04GGBS23.5052.80 6.500.7011.80 1.650.78Table2Potential phase composition of OPC(data presented by mass%).Potential phase composition OPCC3S51.58C2S17.77C3A8.01C4AF12.773.91212J.Geng et al./Cement and Concrete Research68(2015)211–2220.5mol/L NaCl solution,which is 8.863mg ·g −1.The free chloride content (C f )was measured using the traditional leaching method according to the standard of Test Code for Hydraulic Concrete (SL352-2006)and the total chloride content (C t )was measured using the acid-soluble method (SL352-2006).In order to analyze the stability of bound chlorides in concrete,the dimensionless index (R cl )was exam-ined,which is de fined as follows,R cl ¼C t −C f %ð7Þwhere 8.863mg.g −1is the initial total chloride content in the sample.X-ray diffraction (XRD)/reference intensity ratio (RIR)analysis and DTG can be used to approximately determine the quantity of FS,AFt and calcium hydroxide (CH)in the samples.XRD/RIR can determine the relative mass relations among different minerals in a sample,which is calculated according to the following equations [24,25]:W i ¼I i =RIR iX i ¼1I i=RIR i ðÞð8ÞW 1þW 2þW 3þ⋯þW l ¼1ð9Þwhere W i is the relative mass of mineral i ,RIR i is the reference intensityratio of mineral i ,which can be collected from the PDF card of the Inter-national Centre for Diffraction Data (ICDD),I i is the integral intensity of the highest peak of mineral i ,which is calculated using X'Pert HighScore Plus ™software,and N is the number of minerals in the sample.XRD/RIR is usually used to determine the quantity of substances in metals because of simple compositions [25].For cement based materials,it is rather complicated to accurately determine the kinds of hydration products,which increases the dif ficulty of the quantitative analysis.However,if the quantity of one of the minerals can be determinedusing other methods,the calculation process of XRD/RIR becomes pared with the FS and AFt,the quantity of CH can be accurately determined using DTG.Therefore,the quantities of the FS and AFt can be calculated by solving the following algebraic equations,m FS :m AFt ¼T 1ð10Þm FSFS þm AFt þm CH ¼T 2ð11Þm AFtm FS þm AFt þm CH ¼T 3ð12Þm CHm FS þm AFt þm CH¼T 4ð13Þwhere m FS ,m AFt and m CH are masses of FS,AFt and CH,respectively,T 1,T 2,T 3and T 4are the mass ratios,which can be calculated from Eqs.(8)and (9).Note that,m CH can be determined by DTG and thus m FS and m AFt can be determined by Eq.(10)plus any one taken from Eqs.(11)–(13).XRD was carried out using the D8Advance instrument of Bruker AXS with a Cu K αradiation generated with 40kV and 30mA.The diffraction spectra were collected in the range of 5–60°(2θ)scale,with a step sizeTable 3Mix proportions (data presented by mass %).Samples OPC FA GGBS w/b a NoteCN 100000.5Exposed to 5%Na 2SO 4solutionCF 703000.5CG 700300.5CF1G17015150.5CF7G3702190.5CM1000.5Exposed to 5%MgSO 4solutionaw/b represents the mass ratio of mixing water (i.e.0.5mol/L NaCl solution)to binder (cement +SCM).Fig.1.Variation of R cl with standard curing time in samples of differentmixes.Fig.2.Values of R cl in the surface layer of the sample at various different sulfate attack times (CM was exposed to MgSO 4,while all the others were exposed to Na 2SO 4).Fig.3.Values of R cl in different layers of the sample after 90days sulfate attack (1st layer is next to the surface and 4th layer is away from the surface.CM was exposed to MgSO 4,while all the others were exposed to Na 2SO 4).213J.Geng et al./Cement and Concrete Research 68(2015)211–222of 0.02°/s.FT-IR was performed for the samples on a Nicolet Nexus 470spectrometer using the KBr pellet technique in the range of 400–4000cm −1.DTG was carried out in a Netzsch TG-209F1thermal an-alyzer,using a heating rate of 20°C/min at the range of 25–1000°C,in N 2atmosphere.3.Stability of bound chlorides 3.1.Standard curing conditionThe variation of R cl during the standard curing time is shown in Fig.1.It can be seen from the figure that R cl in the samples with SCM is higher than that in the sample only with OPC when they have the same curing time,which is more obvious after the curing time exceeds 14days.Up to 28days,the combined use of FA and GGBS results in higher values of R cl in CF1G1and CF7G3than in the samples with only either FA (CF)or GGBS (CG).However,after the 28days standard curing,the R cl value of the samples has an order of CF ≈CF7G3N CF1G1N CG,which increases with the increased proportion of FA to GGBS.The latereffect of FA on chloride binding is mainly due to its slow pozzolanic re-action.The results shown in Fig.1indicate that the inclusion of SCM in concrete can increase the chloride binding capacity and the effect of FA on chloride binding is more signi ficant than that of GGBS.Furthermore,they also show that the R cl values of all samples increase very obviously before 28days but after that there is less change,suggesting that the equilibrium between free and bound chlorides has been reached.3.2.Sulfate attack conditionFig.2shows the expected decrease in R cl of the surface layer of all samples with the sulfate attack,but the rate of the decrease is higher than that was reported [21].The R cl value in the surface layer of sample CN exposed to Na 2SO 4solution,for example,decreases from 59.8%to 4.3%after only 28days.After that,R cl continuously decreases with the attack time but with a slow reduction rate,from 4.3%at 28days to 1.9%at 90days.The results for locations other than the surface layer at 90days are shown in Fig.3.It can be seen from the figure that,although the 4th layer of sample CN is far away from theexposedFig.4.XRD patterns of samples CN(CM),CF and CG at standard curing condition for (A)28and (B)56days (E:ettringite (AFt),F:Friedel's salt (FS),CH:calcium hydroxide,M:mono-sulfoaluminate,V:Vaterite,CSH:C –S –H gel,C:calcite).214J.Geng et al./Cement and Concrete Research 68(2015)211–222surface,there is still a notable decrease in the R cl value from59.8%at the beginning of the Na2SO4attack to16.6%after90days of attack.This demonstrates that the stability of bound chlorides in concrete is very susceptible to Na2SO4attack.Note that the data plotted in Fig.2show that there is also a decrease in the R cl values of the samples with SCM after Na2SO4attack for28days, but the R cl values are still higher than that of the sample CN only with OPC.This suggests that the use of SCM can alleviate the effect of Na2SO4attack on the stability of bound chlorides.This is partly because the effect of SCM on the diffusion of ions,since the ionic diffusion coef-ficient in cement paste with SCM is normally lower than that in OPC paste,and partly because the cement paste with SCM has more bound chlorides[26].Additionally,in contrast with the results obtained under the standard curing condition,the R cl values of the samples with SCM increase with the decreased proportion of FA to GGBS,and also the R cl value of the surface layer of sample CF is the lowest of all samples containing SCM,following the Na2SO4attack.This suggests that Na2SO4attack can also alter the effect of SCM on the stability of bound chlorides.This appears to be consistent with what is reported in literature[21].The stability of bound chlorides in concrete under MgSO4attack is also shown in Figs.2and3.When the MgSO4attack time extends from0to28days,the R cl value of the surface layer of sample CM decreases from59.8%to26.3%,which is slower than that of sample CN exposed to Na2SO4solution.When the attack time reaches90days, the R cl value of sample CM's surface layer decreases to7.5%,which is still almost four times as high as that of sample CN.This indicates that the stability of bound chlorides is less susceptible to MgSO4attack when compared with Na2SO4attack.Again,thisfinding is consistent with what is reported in other experiments[21,27].The different reductions of R cl in samples CM and CN reflect the different effects of MgSO4and Na2SO4on bound chlorides.During the immersion process free chloride ions will diffuse out and sulfate ions will diffuse into the specimen.The former may decrease the bound chlo-ride level in the sample owing to the equilibrium between the free and bound chlorides.The latter can transform FS into AFt,which not only can reduce the bound chlorides but also can change the pore system and thus affect the diffusion rate of ions.In addition,when magnesium is present,brucite will be formed,which can also change the pore sys-tem and thus affect the transport of ions and the R cl value.The slower reduction of R cl found in sample CM shown in Figs.2and3indicates that the magnesium ions must have some influence on the sulfate attack to the bound chlorides.This influence could be physical and/or chemi-cal.The former is mainly due to the forming of brucite in the surface layer,which reduces the inward diffusion of sulfate ions and the out-ward diffusion of chloride ions.Indeed,the measured free chloride con-centration after the90days immersion was found to be higher in sample CM than in sample CN and have the ratios of about1:0.72for the surface layer and1:0.81for the4th layer.An accurate analysis for the diffusion effect on the bound chlorides requires having more data on thinner layers and knowing the binding isotherms.Nevertheless, the above results did indicate that the diffusion of chloride ions was affected by magnesium ions.The chemical effect of magnesium ions on bound chlorides will be discussed in the next section.Note that the ionic diffusion coefficient in concrete with SCM is nor-mally smaller than that in concrete only with OPC.Thus,the inclusion of SCM in cement paste can provide additional resistance to the ingress of sulfate ions,which in turn can affect the stability of bound chlorides. More discussion on this will be provided in the next section.4.Material characterization analyses4.1.X-ray diffractionThe XRD patterns of samples CN,CF and CG cured at the standard curing condition for28and56days are shown in Fig.4.From the XRD patterns one can identify the FS with a very obvious diffraction peak at around11°2θ.Fig.5shows the relative masses of AFt,FS and CH in samples CN,CF and CG after they were cured in the standard condition for56days.It can be seen from thefigure that the use of FA and GGBS is beneficial to forming more FS.This result can be attributed to two rea-sons.First,the forming process of FS in concrete has been associated with the quantity of aluminate in cementious materials.The higher the quantity of aluminate,the more FS is formed.According to the chemical composition shown in Table1,there is a larger quantity of alu-minate in GGBS and FA than in OPC,which can be released due to the latent hydraulic property of GGBS and the pozzolanic property of FA, which is beneficial to the formation of FS.Secondly,the formation of FS would be hindered because SO42−can react with aluminate prior to Cl−to form mono-sulfoaluminate(AFm)and AFt[13–15].In addition, C–A–H and C–S–H gel,formed due to the hydration reactions induced by FA and GGBS,are also beneficial to chloride binding.As shown in Fig.5,although the quantity of aluminate in FA is higher than that in GGBS,the quantity of FS in sample CF is still lower than that in sample CG after standard curing for56days.It was believed that only reactive alumina Al2O3r−in SCM could react with Cl−to form FS[5].The quantity of CaO in FA used in this study is6.3%,which is low calciumfly ash according to Chinese specification GB/T15696-2005,and where Mullite is the main form of Al2O3,so it is adverse to the formation of FS.Nevertheless,a notable decrease in the intensity of diffraction peak (IDP)of CH can be found in the XRD patterns of sample CF over the curing time from28to56days,which is induced due to the pozzolanic reaction between CH and FA.As a result,more C–S–H gel and C–A–H are formed,which could increase the bound chlorides in sample CF.It should be noticed that the IDP change at around30°(2θ)shown in Fig.4correlates with both C–S–H gel and calcite(CaCO3),because of the overlap of the two strongest diffraction peaks at29.25°(2θ)and 29.40°2θ,respectively[8,28].The XRD patterns of sample CN under Na2SO4attack are shown in Fig.6.It can be observed from Fig.6A that the IDP of FS in the surface layer of sample CN becomes very weak after Na2SO4attack for28 days,which indicates that FS has been decomposed due to the Na2SO4 attack.A quantitative analysis of FS,AFt and CH of sample CN after the Na2SO4attack for28and90days is shown in Fig.7.It can be seen from thefigure that the relative mass of FS in the sample decreases very quickly from2.04to0.45after the28days attack.This suggests that the stability of FS is very susceptible to Na2SO4attack,which may also explain why the decrease of R cl is quick as is shown in Fig.2.How-ever,when the attack time is extended from28to90days,the change in the quantity of FS is slight,which indicates that a large quantity of FShasFig.5.Analysis of ettringite(AFt),Friedel's salt(FS)and calcium hydroxide(CH)in sam-ples CN/CM,CF and CG after they had56days standard curing(wt.%represents the mass percentage of AFt/FS/CH in sample).215J.Geng et al./Cement and Concrete Research68(2015)211–222been decomposed following 28days of the Na 2SO 4attack.Moreover,it can be seen from Fig.7that the quantity of FS gradually decreases from the inside to the surface,which correlates with the change of the R cl value shown in Fig.3.In addition,one can see from Fig.6B that AFt with a diffraction peak at around 9°(2θ)can be detected in every layer of sample CN after the Na 2SO 4attack for 90days.The data shown in Fig.7for AFt indicate that the quantity of AFt in the fourth layer of sam-ple CN is higher than its initial value,which con firms that the attack of Na 2SO 4has reached the fourth layer of the sample.Fig.7also shows the expected opposite changes of FS and AFt with time.The XRD patterns of samples CF and CG after the Na 2SO 4attack for 90days are shown in Fig.8.Similar to the sample CN,the diffraction peaks of FS in the samples with SCM,especially in sample CF,become very weak.Similar to the analysis of the sample CN,Fig.9shows the relative mass of FS,AFt and CH of samples CF and CG after the Na 2SO 4attack for 90days.It seems that the quantities of FS in samples CF and CG are as high as that in sample CN after the Na 2SO 4attack.However,considering the higher quantity of FS in samples CF and CG before the Na 2SO 4attack as shown in Fig.5,the decrease of the quantity of FS in them is quicker than that in sample CN.Therefore,it can be concluded that the stability of FS in the samples with FA or GGBS is susceptible to Na 2SO 4attack when compared to the sample CN.The XRD patterns of samples CN and CM attacked by Na 2SO 4and MgSO 4for 90days are shown in Fig.10.An interesting finding is that there is still an obvious diffraction peak of FS in the sample CM,which is different from the sample CN attacked by Na 2SO 4.The analysis results shown in Fig.11demonstrate that there is more FS in sample CM than in sample CN.Therefore,it can be concluded that the Na 2SO 4attack has more effect on the decomposition of FS in hardened cement paste than the MgSO 4attack.In addition,the IDP of AFt in sample CM is lower than that in sample CN due to the different erosion mechanisms.However,there is still an obvious increase in AFt for sample CM from 0to 90days as demonstrated in Figs.5and 11,which indicates that MgSO 4attack can also lead to the formation of secondary AFt.NoteFig.6.XRD patterns of samples CN with Na 2SO 4attack.(A)1st layer at different days and (B)different layers at 90days (E:ettringite (AFt),F:Friedel's salt (FS),CH:calcium hydroxide,M:mono-sulfoaluminate,V:Vaterite,CSH:C –S –H gel,C:calcite).216J.Geng et al./Cement and Concrete Research 68(2015)211–222that,when magnesium is included in the exposure solution,brucite is formed at the expense of calcium hydroxide,which can affect not only the leaching of chloride from the specimen but also the inward trans-port of sulfate from the exposed solution and thus provide the in fluence on the decomposition of FS and the formation of AFt.However,our XRD result did not reveal a signi ficant amount of brucite and/or gypsum in the surface layer.This is probably due to the specimen layer used in the tests being too thick.Both Skaropoulou and Sotiriadis reported their test results in which brucite was detected in XRD patterns,but the IDP of it was very weak when compared to other phases [11,17].However,in other similar experiments brucite was not detected in XRD patterns [27,29,30].This is probably attributed to the consumption of brucite due to the formation of M –S –H as shown in Eqs.(4)–(6)[19].4.2.Fourier transform infrared (FT-IR)Fig.12shows the FT-IR spectra of sample CN after the Na 2SO 4attack for 28and 90days,respectively.The band at around 3640cm −1is due to the stretching vibration of \OH in Ca(OH)2[30],which is very weak in all samples due to Na 2SO 4attack.The presence of carbonate bands at around 1430and 870cm −1indicates that the samples have already absorbed CO 2molecules from the air before they were immersed into sulfate solution [31].The band at around 1110cm −1comes from asym-metric stretching vibration of S –O in SO 42−,which is identi fied as the fingerprint peak of AFt [32,33].As is shown in Fig.12,owing to more secondary AFt being formed,this band becomes stronger from the in-side to the surface over the attack time.The changes in the bands at around 3440and 1650cm −1are due to the stretching vibration of \OH in structural water of hydration products and the bending vibra-tion of \OH in the interlayer water of hydration products [30].The two bands are also related to the formation of secondary AFt,which be-come strong with the increased quantity of secondary AFt.In addition,the band at around 970cm −1comes from asymmetric stretching vibra-tion of Si –O in C –S –H gel [31,34].It can be observed from Fig.12that there is no obvious change in this band over the attack time,which sug-gests that the stability of C –S –H gel is independent of Na 2SO 4attack.With regard to FS,because chloride ions are not absorbed in the range 400–4000cm −1,the bands at around 730,530and 460cm −1,which are due to Al –O vibrations of [Al(OH)6]3−,can be identi fied as the fin-gerprint peaks of FS [35,36].Owing to the decomposition of FS under Na 2SO 4attack,the strength of these bands appears very weak.Fig.13shows the FT-IR spectra of samples CF and CG after the Na 2SO 4attack.There is no obvious band at around 3640cm −1in thespectra due to the consumption of CH induced by hydration reactions of FA and GGBS and sulfate attack.It can be observed from Fig.13that there is an increase in the strength of the band of C –S –H gel at 976cm −1in sample CF over the attack time from 56to 90days.Guerre-ro et al.attributed this to the further activating action on FA due to the increase in alkalinity induced by Na 2SO 4attack [15].Moreover,this re-sult also indicates that the stability of C –S –H gel is independent of Na 2SO 4attack.The difference of the bands at 714,535and 458cm −1be-tween samples CF and CG is slight.Fig.14shows the FT-IR spectra of samples CN and CM after Na 2SO 4and MgSO 4attack for 90days,respectively.It is observed from Fig.14that the strength of the band at around 710cm −1in sample CM is much stronger than that in sample CN.Also there is more FS in sample CM than in sample CN,which agrees with the results shown in Figs.10and 11.Moreover,it can be seen clearly from Fig.14that the strength of the band at around 970cm −1in sample CM is lower than that in sample CN.This is likely attributed to the decomposition of C –S –H gel induced by MgSO 4attack.As a result of that,the bound chlorides absorbed by C –S –H gel are released.A weak band at around 1110cm −1in sample CM due to the attack of MgSO 4can induce the formation of secondary AFt.4.3.Derivative thermo-gravimetric analysis (DTG)The DTG curves of sample CN attacked by Na 2SO 4are shown in Fig.15.There are some notable endothermic peaks in the DTG curves.The peak near 100°C is mainly attributed to the dehydration of C –S –H gel and AFt,which are dif ficult to distinguish because of the overlap of dehydration temperature from 85to 130°C [23].The peak near 160°C is attributed to AFm [23].Besides these,the peaks near 340,450and 710°C are attributed to the dehydration of FS,CH and the decomposi-tion of calcite.The absence of the peak for FS in the DTG curve after the Na 2SO 4attack for 28days shown in Fig.15further demonstrates that the stability of FS is susceptible to Na 2SO 4attack.The change in the peak of AFm,which plays an important role in the formation of sec-ondary AFt during the Na 2SO 4attack,is also consistent with the change of FS.Fig.16shows the DTG curves of samples CF and CG after the Na 2SO 4attack for pared to sample CG,sample CF has a weak strength of the peak for FS,which is consistent with the analysis result shown in Fig.9and the R cl data shown in Fig.2.Fig.17shows similar DTG results of samples CN and CM after Na 2SO 4and MgSO 4attack for 90days.It is noticed from the figure that the strength of the peak for C –S –H gel and AFt in sample CM is far lower than that in sample CN.Ac-cording to the FT-IR results shown in Fig.14,this result further indicates that MgSO 4attack will lead to the decomposition of C –S –H gel,resulting in the release of bound chlorides.5.Discussion5.1.Stability of Friedel's saltSuryavanshi and Swamy reported that a drop in alkalinity of pore so-lution due to carbonation could induce the decomposition of FS [8].Con-versely,Na 2SO 4attack can increase the alkalinity of the pore solution,which has a negative effect on chloride binding [23,27,37].The question now is how Na 2SO 4attack affects the stability of FS.The exchange be-tween Cl −and SO 42−is the main mechanism in the formation of FS,which can be explained by the following reaction [27]:3CaO ·Al 2O 3·CaSO 4·12H 2O ðAFm Þþ2Cl −→3CaO ·Al 2O 3·CaCl 2·10H 2O ðFS ÞþSO 2−4þ2H 2O :ð14ÞEssentially,FS belongs to a phase of the AFm family,which has a complex chemical and structural constitution.A general formula for AFm phase is [Ca 2(Al,Fe)(OH)6]+X·m H 2O,where the bracketsindicateFig.7.Analysis of ettringite (AFt),Friedel's salt (FS)and calcium hydroxide (CH)in sample CN after Na 2SO 4attack for 0,28and 90days (wt.%represents the mass percentage of AFt/FS/CH in sample).217J.Geng et al./Cement and Concrete Research 68(2015)211–222。
Vyntus

Vyntus ® PNEUMO I Vyntus ® IOS I Vyntus ® APSModular high-end PC-Spirometer for spirometr y, impulse oscillometr y and bronchial challenge testingRocc airway resistance SNIP – Sniff nasal insp.Rhinomanometryof PFT labs depend every day on Vyaire’s proven,of publications the JAEGER pneumotach wasthe device of choice. Its excellent dynamic range effectively tests a broad population from small children to adults.The pneumotach has been designed to work with the validated II bacterial/viral filter and is easy to disassemble.User’s demand hygiene that isdownstreamed parts only needsto be cleaned and disinfectedAnimation incentives Choose from 10 user-definablePrecise data managementSentrySuite software acts as your powerful assistant that will help guide and coach you from calibration to test completion and report generation.with macros or select from aExtremely quiet impulsegenerator with an impressive resolution of 10 complete impedance spectra persecond over the whole range from 3 – 50Hz informative Intra Breath Analysis.Heated JAEGER pneumotach also used for your spirometry measurementsWhen using MicroGard,our pneumotach and all down-streamed parts only needs to be cleaned and disinfectedImpulse oscillometry provides an effective measure of lung dysfunction in 4-year old children at risk for Spirometry underestimated the prevalence of lung function abnormalities in comparison to forcedVyntus APS – for accurate and safe bronchial challenge testingVyntus APS is an Aerosol Provocation System.Up-to-date and sophisticated electronicsand mechanics allow for optimal use of itsnebulization technology with precise dosing. For the observation measurements Vyntus APS combines with the Vyntus PNEUMO and/ or the Vyntus IOS in one system.Low noisecompressorand interfacefor Vyntus APS/PNEUMO/IOSExpiratory filtereffectivelyprotects foraerosolcontaminationCombine your VyntusAPS with VyntusPNEUMO or Vyntus IOScomparable to the Gold Standard. 6A published1-concentration-4-step dosimeterprotocol formethacholinetesting togetherwith the VyaireAPS system isavailable. 7Highest level of patient safetywith SentrySuite softwareThe built-in intelligence of the observation module ensures patient safety while achieving accurate provocation thresholds. After the initial baseline measurement to exclude a contra-indication, the software monitors the patient’s response to each provocation step. It either automatically progresses to the next provocation step or flags that the pre-setprovocation level has been achieved.Customizableclassification barOn-the-fly clear overview aftereach observation measurementcalculationAccuracy:+/– 12 mLTechnicalSpecificationsVyntus PNEUMOVyntus IOSVyntus APS/IOS11Directives 93/42/EEC amended by 2007/47/EC, RoHS 2011/65/EU compliant Market clearancesCEVyntus APS nebulizerOption rhinomanometryOption SNIPFor EU, Switzerland, Norway, Iceland, Turkey, United Kingdom, Africa, Middle East, Asia except China, Australia, New Zealand, South America, Canada distribution only. All illustrations, descriptions and technical specifications are subject to change without prior notice. Trademarks are the proper ty of their respective owners.© 2019 Vyaire Medical, Inc. or one of its af filiates. All rights reser ved. Vyaire, the Vyaire Medical logo and all other trademarks are trademarks or registered trademarks of Vyaire Medical, Inc. or one of its af filiates. Medical devices class IIa according to Medical Devices Directive 93/42/EEC. Please read the complete Instructions For Use that come with the devices or follow the instructions on the product labeling. | V YR-INT-1900093R E F E R E N C E S* based on the Bio Burden DIN EN ISO 11737-1: Report 18AA00881 Z L Borrill, C M Houghton, A A Woodcock, J Vestbo, and D Singh Medicines Evaluation Unit, North-west Lung Centre, Wythenshawe Hospital, Manchester, UK Br J Clin Pharmacol. 2005 April; 59(4): 379–384. doi: 10.1111/j.1365-2125.2004.02261.x.2 Y aegashi M, Yalamanchili V, Kaza V, Weedon J, Heurich A, Akerman M. Respir Med. 2007 May;101(5):995-1000.3 M ansur AH, Manney S, Ayres JG. Resp Med. 2007 Sep 25. Respiratory Medicine, Birmingham Heartlands Hospital NHS Trust, Birmingham, West Midlands, UK.4 M arotta A, Klinnert, M, Price, M, Larsen, G. Liu, A.H. J Allergy Clin Immunol 2003; 112(2): 317-322. Division of Pediatric Allergy and Immunology, National Jewish Medical and Research Center, and the Department of Pediatrics, University of Colorado Health Sciences Center, Denver, 80206, USA.5 S kloot G, Goldman M, Fischler D, Goldman C, Schechter C, Levin S, Teirstein A. Chest. 2004 Apr;125(4):1248-55. Division of Pulmonary and Critical Care Medicine, Mount Sinai School of Medicine, New York, NY, USA.6 R . Köbrich, N.J. van Duijn, R. Lauschner, P.J. Sterk; Jaeger Toennies GmbH, Hoechberg, Germany; Lindopharm GmbH, Hilden, Germany; Dept. Pulmonology, Leiden University Medical Center, Leiden, The Netherlands.7 R Merget et al., Development of a 1-concentration-4-step dosimeter protocol for methacholine testing. Respir Med. 2009. Apr; 103(4):607-13. doi: 10.1016/j.rmed.2008.10.010.G L O B A L H E A D Q U A R T E R SVyaire Medical, Inc.26125 North Riverwoods BlvdMettawa, IL 60045USA Vyaire Medical GmbH Leibnizstrasse 7 97204 HoechbergGermany。
步力生态小资系统操作流程

步力生态小资系统操作流程Operating the Bulei ecological petty bourgeoisie system requires a structured approach to effectively manage and utilize the various features and functions available. The first step in the process is to familiarize oneself with the system interface and layout. This includes understanding the different modules and their respective functions, as well as how they all work together to create a comprehensive ecosystem for small businesses.在操作步力生态小资系统时,需要有条不紊地处理,有效地管理和利用各种可用功能和特点。
该流程的第一步是熟悉系统界面和布局。
这包括了解不同的模块及其各自的功能,以及它们如何共同工作,为小企业创建一个全面的生态系统。
Once the user is comfortable with the interface, the next step is to set up the system to align with the specific needs and requirements of the small business. This includes inputting relevant data, configuring settings, and customizing modules to optimize performance and efficiency. It is essential to pay attention to detailduring this process to ensure that all aspects of the system are tailored to the unique characteristics of the business.一旦用户熟悉了界面,下一步就是设置系统,使其与小企业的特定需求和要求保持一致。
Chapter-07

• forms a “web of trust”
– trust keys have signed – can trust keys others have signed if have a chain of
signatures to them
– & because compression is non deterministic
• uses ZIP compression algorithm
PGP Operation – Email Compatibility
• when using PGP will have binary data to send (encrypted message etc)
system
Email Security Enhancements
• confidentiality
– protection from disclosure
• authentication
– of sender of message
• message integrity
– protection from modification
• also use key ID in signatures
PGP Message Format
PGP Key Rings
• each PGP user has a pair of keyrings:
– public-key ring contains all the public-keys of other PGP users known to this user, indexed by key ID
2 The Quenching and Partitioning Process-Background and Recent Progress

Materials Research, V ol. 8, No. 4, 417-423, 2005© 2005*e-mail: rizzo@dcmm.puc-rio.brThe “Quenching and Partitioning” Process: Background and Recent ProgressJohn G. Speer a , Fernando C. Rizzo Assunção b *, David K. Matlock a , David V . Edmonds caAdvanced Steel Processing and Products Research Center, Colorado School of Mines, Golden, CO 80401, USA bDepartment of Materials Science and Metallurgy,Pontifícia Universidad Católica, 22453-900 Rio de Janeiro - RJ, Brazil cSchool of Process, Environmental and Materials Engineering, University of Leeds,Leeds LS2 9JT, United KingdomReceived: July 19, 2004; Revised: April 8, 2005A new process concept, “quenching and partitioning” (Q&P) has been proposed recently for creating steel microstructures with retained austenite. The process involves quenching austenite below the martensite-start temperature, followed by a partitioning treatment to enrich the remaining austenite with carbon, thereby stabilizing it to room temperature. The process concept is reviewed here, along with the thermodynamic basis for the partitioning treatment, and a model for designing some of the relevant processing temperatures. These concepts are applied to silicon-containing steels that are currently being examined for low-carbon TRIP sheet steel applications, and medium-carbon bar steel applications, along with a silicon-containing ductile cast iron. Highlights of recent experimental studies on these materials are also presented, that indicate unique and attractive microstructure/property combinations may be obtained via Q&P. This work is being carried out through a collaborative arrangement sponsored by the NSF in the USA, CNPq in Brazil, and the EPSRC in the United Kingdom.Keywords: carbon partitioning, retained austenite, martensite1. IntroductionHigh strength ferrous alloys containing significant fractions of retained austenite have been developed in recent years, and have important commercial applications. In sheet steels, for example, carbon-enriched metastable retained austenite is considered beneficial because the TRIP phenomenon during deformation can contribute to formability and energy absorption. In gear and bearing surfaces, austenite is considered to provide damage tolerance in rolling/sliding contact fatigue applications. In thicker section structural applica-tions, retained austenite may provide enhanced resistance to fracture. Similarly, austempered ductile cast iron materials develop favorable property combinations through a microstructure of fine ferrite plates in combination with carbon-rich retained austenite.Steels with substantial amounts of carbon-enriched retained austenite are typically produced by transforming at low tempera-tures, leading to a microstructure containing “carbide-free bainite” that consists of bainitic ferrite laths with interlath retained austenite. Alloying additions such as Si or Al are made to suppress cementite precipitation that usually accompanies bainite formation. Recently, an alternative processing concept, “quenching and partitioning (or Q&P), has been developed for the production of austenite-contain-ing steels, based on a new understanding of carbon partitioning hypothesized between martensite and retained austenite 1. This paper reviews the fundamental elements of the process concept, and recent experimental investigations to examine the Q&P processing response of two commercial Si-containing steels and a commercial Si-contain-ing ductile cast iron.2. Background and Q&P Fundamentals2.1. Carbon partitioning conceptCarbon partitioning between martensite and retained austenite is usually ignored in quenched steels, because the temperature is normally too low for substantial amounts of carbon diffusion to occur after quenching, and because carbon supersaturation in martensite is ordinarily eliminated by a different mechanism, viz. carbide precipita-tion during tempering. Consequently, while carbon-enriched retained austenite has been identified in martensitic steels for some time 2, the thermodynamics of carbon partitioning between martensite and retained austenite has been scarcely considered. Recently, a model has been developed to address carbon partitioning from as-quenched martensite into austenite, under conditions where competing reac-tions such as bainite, cementite or transition carbide precipitation are suppressed 1. The model predicts the “endpoint” of partitioning, when martensite (i.e. ferrite) is in metastable equilibrium with austenite.Metastable equilibrium between austenite and ferrite is not a new concept 3, and equilibrium (e.g. orthoequilibrium) and paraequilibrium concepts are well understood at sub-critical temperatures for condi-tions where partitioning of slow-moving substitutional elements is ei-ther complete or absent, respectively. It must be recognized, however, that transformations occurring under equilibrium or paraequilibrium necessarily involve interface migration and thus require short range movements of iron and substitutional atoms, even when long-range substitutional diffusion is precluded as in the paraequilibrium case. When the position of the martensite/austenite interface is effectively418Speer et al.Materials Researchconstrained , as we consider to apply for carbon partitioning betweenmartensite and retained austenite at relatively low temperatures, then even short-range diffusional movements of iron and substitutionals are precluded, and it is not possible for a ferrite/austenite mixture to reach equilibrium in the Fe-C system (or paraequilibrium in multicomponent alloy systems). The metastable α/γ equilibrium in the case of an immobile or constrained interface, is therefore termed “constrained paraequilibrium” or CPE. Paraequilibrium and CPE derive fundamentally from the immobility of iron and substitutionals in comparison to carbon and other interstitials. Consequently, these two conditions are considered by the authors to be closely related, although this view is not held universally 4 and remains the subject of discussion 5.Constrained paraequilibrium is essentially defined by one thermo-dynamic requirement, and one key matter balance constraint. First, carbon diffusion is completed under constrained paraequilibrium conditions when the chemical potential of carbon is equal in the fer-rite and austenite. Ignoring effects of alloying on carbon activity, this requirement may be represented using results of Lobo and Geiger 6,7 for the Fe-C binary system as follows:,.(,.)x x eRT T T x 767894381691051204CCC$=---c a c(1)where x αC and x γC represent the mole fractions of carbon in ferrite and austenite. The relevant thermodynamics are embedded in Equation 1. This thermodynamic condition may be understood by comparing the schematic Gibbs molar free energy vs. composition diagram in Figure 1a representing metastable equilibrium in the Fe-C system, with constrained paraequilibrium in Figure 1b.In (ortho) equilibrium, or paraequilibrium in higher order alloys,there are unique ferrite and austenite compositions (x αEQ and x γEQ ) satisfying the common tangent construction whereby the chemicalpotentials of both carbon and iron are equal in both phases (m αC = m γCand m αFE = m γFE ). (In paraequilibrium, the same construction would apply if the vertical axis at the composition of pure iron were replaced by the appropriate composition in multicomponent space representing the relative fractions of iron and substitutional elements in the alloy). In constrained paraequilibrium, the thermodynamic condition that the chemical potential of carbon is equal in both phases requires only that the tangents to the ferrite and austenite free energy curves must intersect the carbon axis at a single point. This condition can be satisfied by an infinite set of phase compositions 8, and examples of two such conditions are given in Figure 1b, one which is associ-ated with phase compositions (x αC -P I E I and x γC -P I E I) having a higher carbon concentration than the equilibrium phase compositions, and one as-sociated with phase compostions (x αC -P I E and x γC -P IE) having lower carbon levels than equilibrium. The actual CPE phase compositions must also satisfy the unique matter balance constraint associated with the stationary α/γ interface. This second constraint requires that the number of iron (and substitutional) atoms is conserved in each phase during carbon partitioning. Mathematically, this matter balance for iron may be represented by:f γCPE (1 – x γC CPE) = f γi (1 – x C alloy ) (2)where x C alloyis the overall carbon content of the steel (in atom fraction, recognizing also that in Fe-C binary alloys, 1 – x C = x FE ), f γi is themole fraction of retained austenite before partitioning begins, and f γCPEand x γC CPE represent the austenite amount and carbon concentration, respectively, at constrained paraequilibrium when carbon partition-ing is complete. (A small change in austenite fraction is consistent with transfer of carbon atoms across the interface). Constrained paraequilibrium is achieved when Equations 1-2 above, and Equa-tions 3-4 below are satisfied, where the mass balance for carbon is represented by:f αCPE x αC CPE + f γCPE x γC CPE= x C alloy (3)and the relationship between the phase fractions of α and γ is sim-ply:f αCPE + f γCPE = 1(4)Example CPE calculations have been reported previously 1, whereit was shown that most of the carbon in the steel is expected to parti-tion to the austenite, and quite high levels of carbon enrichment are possible. The dependence of the metastable CPE condition on alloy carbon content, temperature, and the as-quenched austenite and martensite phase fractions was also illustrated. While the detailed calculations are not difficult, it was found that the austenite composi-tion at constrained paraequilibrium can be closely approximated by assuming that virtually all of the carbon in the martensite partitions to the austenite , and then applying the appropriate carbon matter balance based on the amount of retained austenite present after quenching 9.The results of the constrained paraequilibrium model suggested a new process, whereby austenite is formed at high temperature (either by full austenitization or intercritical heat treatment), followed by cooling to a temperature carefully selected (between M s and M f ) to control the fractions of martensite and retained austenite, and finally by a thermal treatment that accomplishes the desired carbon partition-ing to enrich the austenite with carbon and stabilize some (or all) of it to room temperature. This process sequence and the corresponding microstructural changes are illustrated schematically in Figure 2 10. The process assumes that carbon supersaturation is relieved by dif-fusion into retained austenite, and is referred to as quenching and&E#'GAX G %1M A # M G#M A &E M G&EX A %1&E#'AGM #A )) M #G ))M #A ) M #G )X #A )0%X #A ))0%X #G )0%X #G ))0%(a)(b)Figure 1. Schematic molar Gibbs free energy vs. composition diagrams il-lustrating metastable equilibrium at a particular temperature between ferriteand austenite in the Fe-C binary system. a) equilibrium (EQ), and b) two possible constrained paraequilibrium conditions (I and II).V ol. 8, No 4, 2005The “Quenching and Partitioning” Process: Background and Recent Progress 419partitioning, or Q&P, to distinguish it mechanistically from conven-tional quenching and tempering (Q&T) of martensite, where carbide precipitation and decomposition of retained austenite (to ferrite plus cementite) are typical. The example in Figure 2 indicates an initial full austenitization step, although intercritical annealing is also en-visioned for formable sheet products containing an equiaxed ferrite component in the microstructure. During intercritical annealing, a smaller initial fraction of austenite would be present with a higher initial carbon content.The quenching and partitioning heat treatment was envisioned to have application to high-strength austenite containing TRIP sheet steel products, replacing an isothermal bainitic heat treatment of low-carbon steels containing substantial additions of Si, Al, or P to suppress carbide formation. Some suggested advantages of Q&P include the potential for greater carbon enrichment of austenite, decoupling of the (bainitic) ferrite growth kinetics from the carbon partitioning process, and increasing strength via formation of sub-stantial quantities of lath martensite in the microstructure. Other opportunities were identified to employ retained austenite through Q&P processing of higher strength bar steels or even austempered ductile cast iron. Finally, it was suggested that a specific CPE phase composition (where the austenite composition approximates T o ) might even represent a viable steady state boundary condition at the α/γ interface during bainitic ferrite growth, providing a model for the bainite transformation mechanism that is both “fully” diffusional and “fully” martensitic 1.2.2. Importance of suppressing carbide precipitationThe absence of carbide formation is a fundamental element of the constrained paraequilibrium model, since the existence of metastable equilibrium between ferrite and austenite is precluded if the more stable ferrite plus iron carbide equilibrium can be achieved. Any carbide formation effectively “consumes” carbon, since these carbon atoms are no longer available to enrich the austenite. Thus, it is necessary to understand and control carbide precipitation proc-esses that may occur during any partitioning treatments associated with the Q&P process.It is well known that cementite formation can be eliminated or suppressed through additions of silicon 11,12, and also that aluminum and even phosphorus can produce a similar effect 13. Such elements thus play a critical enabling role in the Q&P process. It is also well known in the martensite tempering literature that silicon suppresses cementite formation, or delays the transition from early-stage tem-pering (where ε or η carbides are present), to later-stage tempering (where θ-Fe 3C is present)14-16. In martensite, fine transition carbidesare usually not considered detrimental, whereas cementite can be of more concern. Thus, the greater emphasis has been on understanding when transition carbides are replaced by cementite formation 16,17, rath-er than on the initiation of transition carbide precipitation. For Q&P processing, however, any transition carbide precipitation diminishes the potential for carbon enrichment of austenite, and it is necessary to develop a better understanding of the onset of transition carbide formation, including composition and processing effects 9,18.Precipitation of transition carbides within retained austenite during martensite tempering has not been documented. Since the chemical potential of carbon is much higher in as-quenched martensite than in the retained austenite, it is reasonable to conclude that carbide nucleation would be more likely in bcc ferrite than in austenite 9,19. The α/γ interface is also a favored site for carbide formation. In the Q&P process, high carbon supersaturation of the martensite prior to partitioning could conceivably drive transition carbide formation to a greater extent than would be possible during bainite growth at the same temperature if bainitic ferrite grows with a much lower carbon content than the austenite. (In this context, it should be noted that the carbon supersaturation of bainitic ferrite during growth remains a subject of controversy). In any event, the extent to which carbide formation is suppressed will be a critical factor influencing the microstructures that are achievable using the Q&P process, and further studies are needed to establish more clearly the influences of alloying and processing on the carbide precipitation behavior and kinetics in these steels.2.3. Process design (selection of quenching temperature)A methodology for designing the quench temperature to achieve the maximum possible retained austenite fraction after Q&P process-ing, was developed in a recent publication 9. The model ignores partitioning kinetics, and assumes that all of the carbon partitions from martensite to austenite, and that carbide precipitation is avoided completely. The model results are shown in Figure 3, for a 0.19%C,Figure 2. Schematic illustration of the Q&P process for producing of austen-ite-containing microstructures. C i , C γ, C m represent the carbon concentrations in the initial alloy, austenite, and martensite, respectively. QT and PT are the quenching and partitioning temperatures 10.1UENCH 4EMPERATURE #0H A S E &R A C T I O NFigure 3. Predicted Q&P microstructure components for experimental steel containing 50% intercritical ferrite, vs. quench temperature, assuming full partitioning prior to final quenching to room temperature. The final austenite fraction at room temperature is given by the solid bold line. Dashed lines represent the austenite and martensite (M) present at the initial quench temperature, and the additional martensite formed during the final quench to room temperature. For this example, M initial quench + M final quench + γfinal = 0.5, and the intercritical ferrite fraction is 0.5.420Speer et al.Materials Research1.96%Al, 1.46%Mn, 0.02%Si (by weight) TRIP sheet steel composi-tion, assuming that intercritical annealing was conducted to achieve a microstructure containing 50% austenite and 50% ferrite prior to quenching. In this figure, the final austenite fraction after partitioning and cooling to room temperature is plotted (bold solid line) vs. the quenching temperature prior to partitioning. The austenite and mar-tensite fractions at the quench temperature are also plotted, along with the fraction of “fresh” martensite that forms during final cooling.The model first estimates the fractions of austenite and martensite at the quench temperature (QT in Figure 1) based on the undercool-ing below M s , according, for example, to the Koistinen-Marburger 14 relationship:f m = 1 – e – 1.1x 10⁻²(M s – QT)(5)where f m is the fraction of austenite that transforms to martensite upon quenching to a temperature QT below the M s temperature, and M s for the applicable austenite composition can be estimated from published correlations. (For processing where intercritical annealing is conducted rather than full austenitization, the initial carbon con-centration of the austenite is controlled by the intercritical annealing temperature, and may be estimated by assuming that nearly all of the carbon in the steel is contained in the austenite, since the carbon solubility in ferrite is very low). After completion of (full) partition-ing between martensite and austenite subsequent to quenching, the carbon concentration in the remaining austenite may be estimated, and the final phase fractions may be predicted after final cooling, again applying the Koistinen and Marburger relationship to the carbon-enriched austenite.The model results indicate an “optimum” quenching temperature that yields a maximum amount of retained austenite. Above the peak temperature, substantial austenite fractions remain after the initial quenching step, but the austenite stability is too low during final quenching, and increasing amounts of fresh (M final quench ) martensite are found at higher quench temperatures, reducing the final austenite fraction at room temperature. Below the peak temperature too much austenite is consumed during the initial quench prior to carbon par-titioning, and the carbon content of the retained austenite is greater than needed for stabilization at room temperature. The peak is found at the particular quench temperature where martensite formation is just precluded during the final quench, whereby the austenite has an M s temperature of room temperature after full partitioning. This methodology provides guidance for experimental processing design, and allows the effects of changes in a variety of processing variables to be explored and predicted. Partitioning kinetics are not predicted in this simple model, however, and development of a more sophisticated model will require further understanding of the length-scale of the microstructure over which partitioning occurs, and the kinetics of carbide precipitation processes that may occur.3. Highlights of Recent Progress3.1. Medium-carbon bar steelsInitial investigation of the Q&P processing concept verified the presence of significant amounts of carbon enriched austenite in a 0.35%C, 1.3%Mn, 0.74%Si (wt. pct.) microalloyed bar steel, despite the apparent formation of some transition carbides during the parti-tioning treatment 10. More recently, the Q&P processing response of a 0.6%C, 2%Si (grade 9260) steel was examined by Gerdemann, and compared to the results of conventional austempering or quenching (to room temperature) and tempering 20. Wafers (28.5 mm in diameter by 2.5 mm thick) were austenitized in molten salt for 15 minutes at 900 °C, quenched into a molten tin-bismuth bath at temperaturesranging between 150 and 210 °C, and equilibrated for 120 seconds before partitioning at temperatures between 250 and 500 °C in mol-ten salt for times ranging between 10 and 3600 seconds, and finally, quenched to room temperature. The quenching temperatures were designed using the methodology described above.The results showed that substantial levels of retained austenite could be achieved by Q&P processing of the 9260 alloy, approaching 30% by volume. The relationship between the amount of retained austenite and the quench temperature is reproduced here in Figure 4, for conditions involving a 10 seconds partitioning treatment at 500 °C. The figure shows that the amount of austenite measured by X-ray diffraction was in qualitative agreement with model calcula-tions, although the measured austenite fractions were lower than the maximum amounts predicted.Partitioning at lower temperature (250 °C) led to partition-ing treatment times that would be more appropriate for industrial processing of bulk specimens (e.g. 45 to 60 minutes), whereas much shorter times were associated with the maximum austenite fractions at higher temperature (e.g. 10 seconds at 400 °C). Some encouraging property results were noted in this study, such as hardness levels in excess of HRC58 in combination with austenite fractions approaching 10%. In contrast, substantial austenite levels were not achievable by conventional quenching and tempering, and lower hardnesses were associated with bainitic processing (austempering). The combination of high hardness along with a significant retained austenite fraction is considered to be of possible interest for gear or bearing applications, where “damage tolerance” under pitting or contact fatigue conditions is enhanced by austenite that is present in the microstructure 21.Microstructure characterization is currently underway, and Figure 5 shows an example resulting from quenching to 190 °C, and holding in the bath for 120 seconds. Transmission electron microscopy (TEM) shows the martensite substructure in bright field (Figure 5a), along with finely dispersed retained austenite in dark field (light regions in Figure 5b). This heat-treatment condition is associated with much more retained austenite (> 6%) than is obtained by quenching directly to room temperature (< 2%), illustrating that partitioning has already begun during the 120 seconds equilibration at the quench temperature (190 °C)20.1UENCH 4EMPERATURE #!U S T E N I T E 6O L U M E &R A C T I O NFigure 4. Final volume fraction of retained austenite depending on the quench temperature at a partitioning temperature of 500 °C, and calculated austenite volume fraction over this quench temperature range 20.V ol. 8, No 4, 2005The “Quenching and Partitioning” Process: Background and Recent Progress4213.2. TRIP sheet steelsHigh strength sheet steels containing significant fractions ofretained austenite have been developed in recent years, and are thesubject of growing commercial interest23,24. Carbon-enriched meta-stable retained austenite is considered beneficial because the TRIPphenomenon during deformation can contribute to formability andenergy absorbtion. These steels are typically produced by intercriticalannealing followed by austempering, with additions of Si, Al, or Pto suppress carbide formation that usually accompanies the bainitetransformation. Initial studies on the Q&P processing response9of TRIP sheet steel showed that substantial amounts of austenitecould be obtained via Q&P processing, with measured retainedaustenite fractions similar to the predicted maximum of 15% in this0.19%C, 1.96%Al, 1.46%Mn steel. Because of concerns related touncertainty in the effects of aluminum on the Ms temperature, andoverlapping of the carbon partitioning and bainite transformation mechanisms owing to accelerated austenite decomposition kinetics associated with aluminum additions, more recent studies have been conducted using a 0.19%C, 1.63%Si, 1.59%Mn TRIP sheet steel18. Transformation response and mechanical behavior are both being assessed, and initial results have been very encouraging. Variations in quenching temperature were examined, along with selected vari-ations in partitioning time and temperature, using either “1-step” or “2-step” Q&P processing. In 1-step processing, partitioning is carried out at the quenching temperature, while 2-step processing involves reheating to a selected partitioning temperature that differs from the quench temperature.New microstructures that extend the strength levels of current TRIP steels resulted from Q&P processing, as shown in the results of Figure 6, comparing the measured strength and formability (ductility) combinations with current “state-of-the-art” sheet grades including dual-phase (ferrite-martensite), austempered TRIP (bainite), and martensitic steels. (The data used in this figure are discussed further in reference18.) Much additional opportunity remains to explore available property combinations, and optimize retained austenite fractions and austenite stability, as well as to understand the operative fundamental mechanisms and explore industrial processing capabilities. Scanning electron microscopy, as illustrated in the example of Figure 7, shows the presence of intercritical ferrite (dark featureless areas), along with a mixture of martensite and fine retained austenite. The fine sub-structure in the Q&P heat treated condition is apparently responsible for the elevated strength levels and distinguishes the resulting Q&P microstructure from bainite produced by conventional austempering at the same temperature as partitioning is accomplished in Q&P18.3.3. Austempered ductile cast ironAustempered ductile iron (ADI) contains substantial levels of silicon, and is usually processed by heating into the austenite-plus-graphite phase field, followed by austempering at a lower temperature to transform the austenite to “ausferrite,” which is essentially bainitic ferrite with carbon-enriched retained austenite. This microstructure provides ADI with high strength in combination with ductility and toughness that is sufficient for many applications. Because of the high-silicon levels and the importance of retained austenite, Q&P was considered to offer a potential heat treating alternative for ADI, and a team of 4thyear undergraduate students at Colorado School of Mines(a)(b)Figure 5. TEM bright field (a) and (002)γdark field (b) images showingmartensite and retained austenite in 9260 alloy quenched to 190 °C andequilibrated for 120 seconds before final cooling to room temperature22.5LTIMATE 4ENSILE 3TRENGTH -0A4OTAL%LONGATIONFigure 6.Total elongation vs. ultimate tensile strength for TRIP, Dual phase(DP), martensitic (M), and Q&P sheet steel products18.。
英文版《实践论》on practice

英文版《实践论》on practice"The Practice of Practice" is a work written by French philosopher and sociologist Pierre Bourdieu. This book was translated into English under the title "On Practice." 《实践论》是法国哲学家和社会学家皮埃尔·布迪厄所著的著作。
这本书被翻译成英文,标题是《On Practice》。
Bourdieu's "On Practice" explores the concept of practice as a form of social action that contributes to the reproduction and transformation of social structures. Bourdieu argues that practice is not only a matter of individual choice, but is shaped by social and cultural forces. Bourdieu的《实践论》探讨了实践的概念,将其视为社会行为的一种形式,有助于社会结构的再生产和转变。
Bourdieu认为,实践不仅仅是个人选择的问题,而是由社会和文化力量塑造的。
One of the key ideas in "On Practice" is the concept of habitus, which refers to the deeply ingrained habits, dispositions, and tastes that are developed through a person's socialization and shape their actions and outlook on the world. Bourdieu argues that habitus serves as a generative principle that guides and structures individual practices.《实践论》中的一个关键观念是habitus的概念,它指的是通过个人社会化而形成的根深蒂固的习惯、性格和品味,塑造了他们的行为和世界观。
- 1、下载文档前请自行甄别文档内容的完整性,平台不提供额外的编辑、内容补充、找答案等附加服务。
- 2、"仅部分预览"的文档,不可在线预览部分如存在完整性等问题,可反馈申请退款(可完整预览的文档不适用该条件!)。
- 3、如文档侵犯您的权益,请联系客服反馈,我们会尽快为您处理(人工客服工作时间:9:00-18:30)。
劳动投入与劳动生产率
劳动投入可以用来说明经济增长中供给因 素的作用。 劳动时间的增加是由于工作周的平均长度 的增加、劳动力人数的增加,以及劳动生 产率的增长引起的,这些都会带来更高的 经济增长。
McGraw-Hill/Irwin
Copyright © 2007 by The McGraw-Hill Companies, Inc. All rights reserved.
投入品和生产率
一国在任何年份的实际GDP都取决于其投入品 的数量和这些投入品的生产率。 因此,一个国家从某一年到下一年的经济增长 取决于其投入品的增加和投入品生产率的提高。
McGraw-Hill/Irwin
Copyright © 2007 by The McGraw-Hill Companies, Inc. All rights reserved.
增长的计算
来自CEA的政府方面的数据显示,美国的 经济增长可以归功于劳动数量的增长以及 劳动生产率的提高。
McGraw-Hill/Irwin
Copyright © 2007 by The McGraw-Hill Companies, Inc. All rights reserved.
增长的计算
对生产率增长做出了贡献的因素包括技术 进步、物质资本和人力资本的增长、规模 经济以及资源配置的优化。
全球竞争
Copyright © 2007 by The McGraw-Hill Companies, Inc. All rights reserved.
McGraw-Hill/Irwin
生产率加速增长
不言自明,较强劲的生产率增长和剧烈的全
球竞争使得经济能够实现较高的经济增长率。
然而,怀疑者们对于生产率能否保持长期 稳定的高增长率提出了质疑。
第七部分
经济增长和国际经济学
第17章:经济增长 章 经济增长
经济增长
经济增长是指实际GDP(或人均实际GDP) 经济增长 随着时间而不断增加。
美国的实际GDP (经过了通货膨胀调整)由
1950年的11,770亿美元增长到了2004年的108,420 亿美元。
McGraw-Hill/Irwin
Copyright © 2007 by The McGraw-Hill Companies, Inc. All rights reserved.
的一个新的重大浪潮以及全球竞争的加剧。
McGraw-Hill/Irwin
Copyright © 2007 by The McGraw-Hill Companies, Inc. All rights reserved.
新经济中生产率加速增长的原因
微型芯片与信息技术
新企业 报酬递增源于:
更加专门化的投入 开发成本的摊薄 同时消费 网络效应 干中学
McGraw-Hill/Irwin
Copyright © 2007 by The McGraw-Hill Companies, Inc. All rights reserved.
生产可能性和总供给
也可以将经济增长考虑为经济的长期总供给曲 线的扩张。
当经济扩张时,长期总供给曲线右移。
回顾可知,ASLR 是一条垂直的曲线,处于经济 的潜在(充分就业)产出水平上。
效率因素
为了发挥其生产潜力,经济除了充分就业之外 还必须实现经济效率。 当经济同时实现了生产效率(有效率地利用资 源)和配置效率(产品生产使得人们的福利水 平最大化)的时候,就是实现了经济效率。
McGraw-Hill/Irwin
Copyright © 2007 by The McGraw-Hill Companies, Inc. All rights reserved.
需求因素
通过购买经济中不断扩张的商品和服务产出, 家庭、企业和政府支出为经济增长做出了贡献。 总支出对产出的增长做充分利用。
McGraw-Hill/Irwin
Copyright © 2007 by The McGraw-Hill Companies, Inc. All rights reserved.
McGraw-Hill/Irwin
Copyright © 2007 by The McGraw-Hill Companies, Inc. All rights reserved.
增长是合意和可持续的吗? 增长是合意和可持续的吗?
反增长的观点
导致了污染、全球变暖、臭氧破坏和其他环境问 题 歧视、贫困和无家可归等诸多社会问题依然存在 工人们的体力和脑力健康受到了损害
增长计算法
增长计算法是指促进了实际GDP变化的供给 增长计算法 方面因素的簿记。 经济顾问委员会(CEA)运用这一方法来评价 经济增长背后的各因素。
McGraw-Hill/Irwin
Copyright © 2007 by The McGraw-Hill Companies, Inc. All rights reserved.
供给因素
供给因素与经济扩张的物质能力有关。 自然资源以及人力资源数量的增加和质量的提 高,以及资本品供给的增加和技术的进步,都 能够使经济扩张其潜在的GDP。
McGraw-Hill/Irwin
Copyright © 2007 by The McGraw-Hill Companies, Inc. All rights reserved.
生产可能性分析
生产可能性分析能够帮助说明经济增长背 后的六个要素。
McGraw-Hill/Irwin
Copyright © 2007 by The McGraw-Hill Companies, Inc. All rights reserved.
增长和生产可能性
四个供给因素当中的某一个 增加都会使得生产可能性曲 线外移,从AB移到CD 。 需求因素和效率因素将使得 经济从点a移向点b 。 图中: 横轴:食品(百万) 纵轴:生产设备(千台) 文字:可实现的;不可实现 的
增长的要素
在一个动态的过程中,三个关键因素互相 作用,确保了经济增长。 六个要素当中包括四个供给因素、一个需 求隐身和一个效率因素。
McGraw-Hill/Irwin
Copyright © 2007 by The McGraw-Hill Companies, Inc. All rights reserved.
美国整体的社会、文化、政治环境等其他因素 也促进了经济增长。
McGraw-Hill/Irwin
Copyright © 2007 by The McGraw-Hill Companies, Inc. All rights reserved.
生产率加速增长
美国在1995-2004年期间所经历的生产率增 长要高于1973-1995年期间。 某些经济学家声称美国已经实现了一个新 经济,亦即其生产率加速增长源于技术进步
McGraw-Hill/Irwin
Copyright © 2007 by The McGraw-Hill Companies, Inc. All rights reserved.
(b)长期总供给的增加 ) 横轴:实际GDP 横轴:实际 纵轴:价格水平 纵轴:
McGraw-Hill/Irwin
Copyright © 2007 by The McGraw-Hill Companies, Inc. All rights reserved.
加快了地球资源的退化与枯竭
McGraw-Hill/Irwin
Copyright © 2007 by The McGraw-Hill Companies, Inc. All rights reserved.
增长是合意和可持续的吗? 增长是合意和可持续的吗?
对经济增长的辩护
更高的生活水平和物质丰裕度 国家基础设施的改善 更好的医疗保健 更有保障的公共安全 更安全的工作环境
McGraw-Hill/Irwin
Copyright © 2007 by The McGraw-Hill Companies, Inc. All rights reserved.