地下水
高中地理:地下水知识点
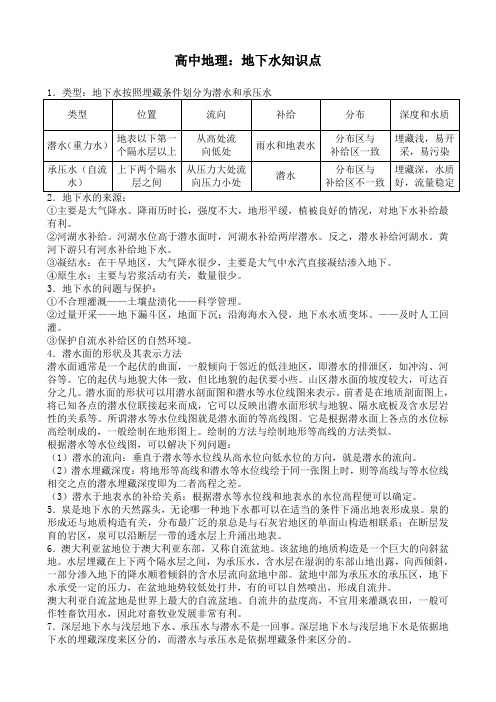
高中地理:地下水知识点①主要是大气降水。
降雨历时长,强度不大,地形平缓,植被良好的情况,对地下水补给最有利。
②河湖水补给。
河湖水位高于潜水面时,河湖水补给两岸潜水。
反之,潜水补给河湖水。
黄河下游只有河水补给地下水。
③凝结水:在干旱地区,大气降水很少,主要是大气中水汽直接凝结渗入地下。
④原生水:主要与岩浆活动有关,数量很少。
3.地下水的问题与保护:①不合理灌溉——土壤盐渍化——科学管理。
②过量开采——地下漏斗区,地面下沉;沿海海水入侵,地下水水质变坏。
——及时人工回灌。
③保护自流水补给区的自然环境。
4.潜水面的形状及其表示方法潜水面通常是一个起伏的曲面,一般倾向于邻近的低洼地区,即潜水的排泄区,如冲沟、河谷等。
它的起伏与地貌大体一致,但比地貌的起伏要小些。
山区潜水面的坡度较大,可达百分之几。
潜水面的形状可以用潜水剖面图和潜水等水位线图来表示。
前者是在地质剖面图上,将已知各点的潜水位联接起来而成,它可以反映出潜水面形状与地貌、隔水底板及含水层岩性的关系等。
所谓潜水等水位线图就是潜水面的等高线图。
它是根据潜水面上各点的水位标高绘制成的,一般绘制在地形图上。
绘制的方法与绘制地形等高线的方法类似。
根据潜水等水位线图,可以解决下列问题:(1)潜水的流向:垂直于潜水等水位线从高水位向低水位的方向,就是潜水的流向。
(2)潜水埋藏深度:将地形等高线和潜水等水位线绘于同一张图上时,则等高线与等水位线相交之点的潜水埋藏深度即为二者高程之差。
(3)潜水于地表水的补给关系:根据潜水等水位线和地表水的水位高程便可以确定。
5.泉是地下水的天然露头,无论哪一种地下水都可以在适当的条件下涌出地表形成泉。
泉的形成还与地质构造有关,分布最广泛的泉总是与石灰岩地区的单面山构造相联系;在断层发育的岩区,泉可以沿断层一带的透水层上升涌出地表。
6.澳大利亚盆地位于澳大利亚东部,又称自流盆地。
该盆地的地质构造是一个巨大的向斜盆地。
水层埋藏在上下两个隔水层之间,为承压水。
地下水基础知识大全
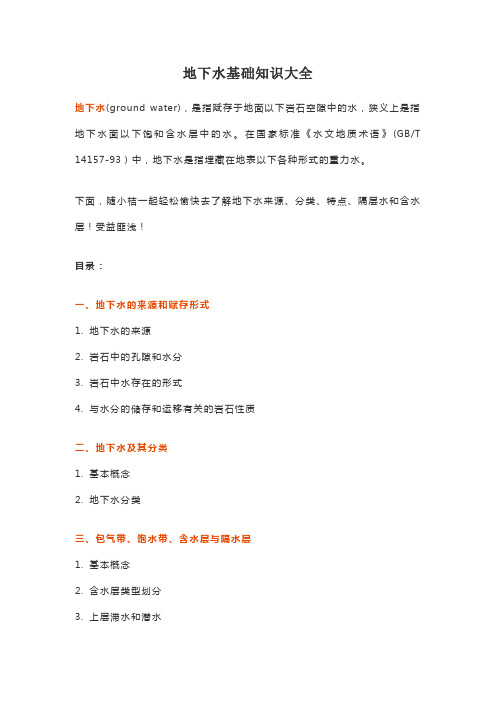
地下水基础知识大全地下水(ground water),是指赋存于地面以下岩石空隙中的水,狭义上是指地下水面以下饱和含水层中的水。
在国家标准《水文地质术语》(GB/T 14157-93)中,地下水是指埋藏在地表以下各种形式的重力水。
下面,随小桔一起轻松愉快去了解地下水来源、分类、特点、隔层水和含水层!受益匪浅!目录:一、地下水的来源和赋存形式1. 地下水的来源2. 岩石中的孔隙和水分3. 岩石中水存在的形式4. 与水分的储存和运移有关的岩石性质二、地下水及其分类1. 基本概念2. 地下水分类三、包气带、饱水带、含水层与隔水层1. 基本概念2. 含水层类型划分3. 上层滞水和潜水4. 层间水(承压水)5. 潜水和承压水(层间水)比较一、地下水的来源和赋存形式|一、地下水的来源1. 渗入水2. 沉积水3. 再生水4. 初生水5. 有机成因水|二、岩石中的孔隙和水分1. 岩石中的孔隙:孔隙、裂隙和溶孔2. 有关孔隙度的几个基本概念•孔隙:组成松散岩石颗粒或颗粒集合体之间的间隙;裂隙:应力作用下坚硬岩石破裂变形产生的。
可分为成岩裂隙、构造裂隙和风化裂隙;溶孔(洞):可溶的沉积岩在地下水溶蚀下产生的空洞;孔隙度Φ:某一体积V岩石中孔隙体积Vn所占比例裂隙率Kr:裂隙体积Vr与包括裂隙在内的岩石体积V的比值熔岩率K:溶洞的体积Vk与岩石总体积V的比值3. 影响孔隙度大小的因素方体排列紧密,孔隙度大;四面体排列,松散,孔隙度大;颗粒分选程度:分选好,孔隙度大;分选差,颗粒大小悬殊,细小颗粒充填于粗大颗粒之间,孔隙度降低;颗粒形状:颗粒形状不规则--排列松散--孔隙度大粘性土的结构和次生孔隙:带电粘粒--聚合--结构孔隙--孔隙度增大--次生孔隙(虫洞、根孔、干裂缝)发育--孔隙度增大。
孔隙的特点4. 岩石中的各种裂隙1-分选良好,排列酥松的砂;2-分选良好,排列紧密的砂;3-分选不良的,排列紧密的砂;4-经过部分胶结的砂岩;5-具有结构性孔隙的黏土;6-经过压缩的黏土;7-具有裂隙的岩石;8-具有溶的可溶岩|三、岩石中水存在的形式1. 气态水:以水蒸气的形式储存在地下的水;2. 固态水:指岩石中温度在0℃以下的重力水。
地下水的基本知识

地下水的基本知识1.地下水的概念地下水是指以各种形式埋藏在地壳空隙中的水,包括包气带和饱水带中的水。
地下水也是参于自然界水循环过程中处于地下隐伏径流阶段的循环水。
地下水是储存和运动于岩石和土壤空隙中的水,那么地下水必然要受到地质条件的控制。
地质条件包括岩石性质、空隙类型与连通性、地质地貌特征、地质历史等。
地下水环境是地质环境的组成部分,它是指地下水的物理性质、化学成分和贮存空间及其由于自然地质作用和人类工程——经济活动作用下所形成的状态总和。
2.地下水的埋藏条件岩石和土体空隙既是地下水的储存场所,又是运移通道。
空隙的大小、多少、连通性、充填程度及其分布规律决定着地下水埋藏条件。
根据成因可把空隙区分为孔隙、裂隙与溶隙三种,并可把岩层划分为孔隙岩层(松散沉积物、砂岩等)、裂隙岩层(非可溶性的坚硬岩层)与可溶岩层(可溶性的坚硬岩石)。
孔隙岩层中的空隙分布比裂隙可溶岩层均匀,溶隙一般比孔隙、裂隙岩层中的空隙规模大。
这三种空隙的大小分别以孔隙度、裂隙率与岩溶率表示,即某一体积岩石中孔隙、裂隙和溶隙体积与岩石总体积之比,以百分数表示。
岩石空隙中存在着各种形式的水,按其物理性质可分为气态水、吸着水、薄膜水、毛细水、重力水和固态水。
此外,还有存在于矿物晶体内部及其间的沸石水、结晶水与结构水。
水文地质学所研究的主要对象是饱和带的重力水,即在重力作用支配下运动的地下水。
岩石空隙是地下水储存场所和运动通道。
空隙的多少、大小、形状、连通情况和分布规律,对地下水的分布和运动具有重要影响。
将岩石空隙作为地下水储存场所和运动通道研究时,可分为三类,即:松散岩石中的孔隙,坚硬岩石中的裂隙和可溶岩石中的溶穴。
(1)孔隙。
松散岩石是由大小不等的颗粒组成的。
颗粒或颗粒集合体之间的空隙,称为孔隙。
岩石中孔隙体积的多少是影响其储容地下水能力大小的重要因素。
孔隙体积的多少可用孔隙度表示。
孔隙度是指某一体积岩石(包括孔隙在内)中孔隙体积所占的比例。
地下水的基本概念及其分类
地下水的基本概念及其分类
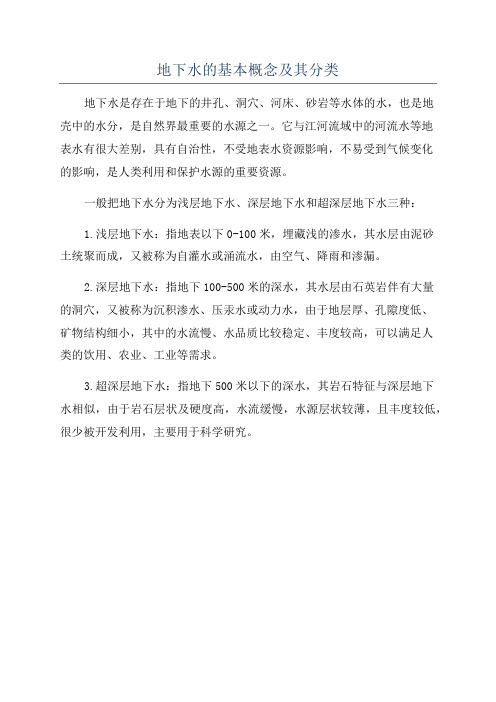
地下水是存在于地下的井孔、洞穴、河床、砂岩等水体的水,也是地
壳中的水分,是自然界最重要的水源之一。
它与江河流域中的河流水等地
表水有很大差别,具有自治性,不受地表水资源影响,不易受到气候变化
的影响,是人类利用和保护水源的重要资源。
一般把地下水分为浅层地下水、深层地下水和超深层地下水三种:
1.浅层地下水:指地表以下0-100米,埋藏浅的渗水,其水层由泥砂
土统聚而成,又被称为自灌水或涌流水,由空气、降雨和渗漏。
2.深层地下水:指地下100-500米的深水,其水层由石英岩伴有大量
的洞穴,又被称为沉积渗水、压汞水或动力水,由于地层厚、孔隙度低、
矿物结构细小,其中的水流慢、水品质比较稳定、丰度较高,可以满足人
类的饮用、农业、工业等需求。
3.超深层地下水:指地下500米以下的深水,其岩石特征与深层地下
水相似,由于岩石层状及硬度高,水流缓慢,水源层状较薄,且丰度较低,很少被开发利用,主要用于科学研究。
地下水相关概念
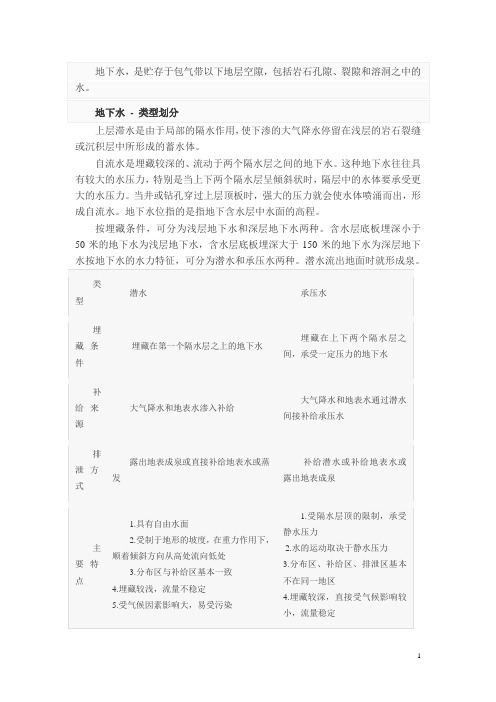
上层滞水是由于局部的隔水作用,使下渗的大气降水停留在浅层的岩石裂缝或沉积层中所形成的蓄水体。
自流水是埋藏较深的、流动于两个隔水层之间的地下水。
这种地下水往往具有较大的水压力,特别是当上下两个隔水层呈倾斜状时,隔层中的水体要承受更大的水压力。
当井或钻孔穿过上层顶板时,强大的压力就会使水体喷涌而出,形成自流水。
地下水位指的是指地下含水层中水面的高程。
按埋藏条件,可分为浅层地下水和深层地下水两种。
含水层底板埋深小于50米的地下水为浅层地下水,含水层底板埋深大于150米的地下水为深层地下水按地下水的水力特征,可分为潜水和承压水两种。
潜水流出地面时就形成泉。
(一)按地下水的贮存埋藏条件分类1.包气带水类型划分结合水(分吸湿水、薄膜水)毛管水(分毛管悬着水与毛管上升水)重力水(分上层滞水与渗透重力水)2.饱水带水潜水承压水(分自流溢水与非自流溢水)(二)按岩土的贮水空隙的差异分类1.孔隙水2.裂隙水3.岩溶水将上述两种基本类型组合在一起,便可得到组合类型,如孔隙潜水、承压裂隙水等等。
(一)包气带水的特征与包气带的类型贮存在地下自由水面以上包气带中的水,称为包气带水。
包气带水包括吸湿水、薄膜水、毛细水、汽态水、过路的重力渗入水以及上层滞水。
1.包气带水的主要特征与饱和带中的地下水相比较,包气带水具有如下特征:一包气带含水率和剖面分布最容易受外界条件的影响,尤其是与降水、气温等气象因素关系密切,多雨季节,雨水大量入渗,包气带含水率显著增加;干旱月分,土壤蒸发强烈,包气带含水量迅速减少,致使包气带水呈现强烈的季节性变化。
二包气带在空间上的变化,主要体现在垂直剖面上的差异,一般规律是愈近表层,含水率的变化愈大,逐渐向下层,含水率变化趋于稳定而有规律。
三包气带含水率变化还与岩土层本身结构,岩土颗粒的机械组成有关,因为颗粒组成不同,使得岩土的孔隙大小和孔隙度发生差异,从而导致了含水量的不同。
赋存在地下岩土空隙中的水。
含水岩土分为两个带,上部是包气带,即非饱和带,在这里,除水以外,还有气体。
第5章 地下水
第二节 地下水类型及其主要特征
3. 承压水的补给与排泄 承压水的补给源有大气降水、地表水及潜水; 承压水的排泄方式有:向潜水排泄、泉的排泄及向地表 水排泄。 4. 承压水对工程建设的影响 (1)良好的城市供水水源; (2)基坑突涌; (3)排水比较困难,井深,范围广,水量大。
运动多属于非层流运动。
第二节 地下水类型及其主要特征
地下水按照埋藏条件可以分为包气带水、潜水和承压水 三类;按照含水层的空隙性质可分为孔隙水、裂隙水和岩溶 水三类。
第二节 地下水类型及其主要特征
5.2.1 包气带水 处于地表面以下潜水位以上的包气带岩土层中,包括土 壤水、沼泽水、上层滞水以及基岩风化壳(粘土裂隙)中季节 性存在的水。主要特征是受气候控制,季节性明显,变化大, 雨季水量多,旱季水量少,甚至干涸。包气带水对农业有很 大意义,对工程建筑有一定影响。
第二节 地下水类型及其主要特征
承压斜地
第二节 地下水类型及其主要特征
承压含水层在同一区域内均可在不同深度有着若干层 同时存在的情况,它们之间的水头高度与地形和构造二者 有关。 当地形和构造一致时称为正地
形。下部含水层压力高,若有裂隙
穿透上下含水层,下部含水层的水 通过裂隙补给上部含水层。如山东
济南的承压斜地,地下水通过近20m厚的第四系覆盖层出
水下施工。若潜水对施工有危害,宜用排水、降低水位、隔离(包括冻结法
等)等措施处理。
第二节 地下水类型及其主要特征
5.2.3 承压水 承压水是指埋藏并充满在两个稳定隔水层之间的含水层 中的地下水,是一种有压重力水。
第二节 地下水类型及其主要特征
1. 承压水的形成 最适宜形成承压水的地质构造有向斜构造盆地和单斜构 造。 承压盆地 此类承压水的水 位受到气候及地形的 控制,往往有较好的 径流条件。
地下水
地下水定义:地下水是赋存于地表以下岩土空隙中的水,主要来源于大气降水,经土壤渗入地下形成的。
地下水是地质环境的组成部分之一,能影响环境的稳定性。
主要表现在:地基土中的水能降低土的承载力;基坑涌水不利于工程施工;地下水常常是滑坡、地面沉降和地面塌陷发生的主要原因;一些地下水还腐蚀建筑材料。
第一节地下水概述1.地下水:气态水、结合水、毛细水、重力水、固态水以及结晶水和结构水。
重力水(自由水):不受静电引力影响,在重力作用下运动,可传递静水压力,能产生浮托力、孔隙水压力,在运动过程中产生动水压力,具有溶解能力。
2.含水层:在正常的水力梯度下,饱水、透水并能给出一定水量的岩土层。
含水层的形成必须具备的条件:岩土层中有较大(指能透水)的空隙;含水层要为隔水层所限,以便地下水汇集不至流失;含水层要有充分的补给来源。
3.隔水层:在正常的水力梯度下,不透水或透水相对微弱的岩土层。
它可以是含水甚至饱水(如粘土),也可以是不含水的(如致密的岩石)。
4.滞水层:弱透水层。
5.岩土的水理性质:指岩土与水接触时,控制水分储存和运移的性质。
(1)容水度:岩土孔隙完全被水充满时的最大的水体积与土体积之比。
(2)持水度:饱和岩土在重力作用后,保持在土中水的体积与土体积之比。
这部分滞留土中的水为结合水和毛细水。
(3)给水度:在重力作用下排出的水的体积与岩土体积之比。
(4)透水性:岩土允许重力水渗透的能力。
用渗透系数表示。
(5)达西定律:地下水线性渗透的基本规律。
Q=kiA; v=ki第二节地下水类型地下水按埋藏条件可分为:包气带水、潜水、承压水。
按含水介质类型分为:孔隙水、裂隙水、岩溶水。
地面以下、稳定地下水面以上为包气带。
稳定地下水面以下为饱水带。
1.包气带水:处于地表面以下、潜水位以上的包气带岩土层中,包括土壤水、沼泽水、上层滞水以及基岩风化壳(粘土裂隙)中季节性存在的水。
2.潜水:埋藏在地表以下第一层较稳定的隔水层以上具有自由面的重力水。
地下的水是怎么产生的原理
地下的水是怎么产生的原理
地下水的产生主要有以下几个过程:
1. 降雨入渗:当降雨发生时,部分降雨水会渗入地表土壤或岩石中。
这些降雨水穿过土壤和岩石的孔隙,并随着重力下渗到地下层,形成地下水。
2. 补给区水源:在山地和山脚下,地下水主要通过山区的补给区形成。
当降雨水渗入孔隙岩层或水溶岩中,沿着倾斜的地层或裂隙层向下流动,最终形成地下水。
3. 河流渗漏:河流和湖泊的水也会通过渗漏进入地下层,进而形成地下水。
当河流或湖泊的水位高于地下水位时,水通过河流或湖泊的沉积物、河床或湖底渗入地下层。
4. 岩石溶解:某些岩石(如石灰岩和石膏岩)具有易溶性,地下水在通过这些岩石时会逐渐溶解,并形成地下水洞穴、地下水库或地下水河流。
总的来说,地下水的形成是通过降雨水的渗透、山区补给、河流渗漏以及岩石溶解等多种过程的综合作用形成的。
- 1、下载文档前请自行甄别文档内容的完整性,平台不提供额外的编辑、内容补充、找答案等附加服务。
- 2、"仅部分预览"的文档,不可在线预览部分如存在完整性等问题,可反馈申请退款(可完整预览的文档不适用该条件!)。
- 3、如文档侵犯您的权益,请联系客服反馈,我们会尽快为您处理(人工客服工作时间:9:00-18:30)。
RESEARCH COMMUNICATIONS*For correspondence. (e-mail: rameshtyagi@) 19. Price, G. P., Preferred orientations in quartzites. In Preferred Orien-tation in Deformed Metals and Rocks: An Introduction to Modern Texture Analysis (ed. Wenk, H. R.), Academic Press, New York, 1985, pp. 385–406.20. Ramsay, J. G. and Huber, M. I., The Techniques of Modern Struc-tural Geology , Folds and Fractures . Academic Press, New York, 1987, vol. 2.21. Park, R. G., Shear zone deformation and bulk strain in granite–greenstone terrain of the Western Superior Province, Canada . Pre-cambrian. Res ., 1981, 14, 31–47.22. Anderson, E. M., The Dynamics of Faulting , Oliver and Boyd Edin-burgh, 1951.ACKNOWLEDGEMENTS. The research was supported by Depart-ment of Science and Technology, New Delhi.Received 16 July 2004; revised accepted 6 November 2004Reliable natural recharge estimates in granitic terrainRamesh Chand*, G. K. Hodlur, M. Ravi Prakash, N. C. Mondal and V. S. SinghNational Geophysical Research Institute, Uppal Road, Hyderabad 500 007, IndiaThe average natural recharge to the aquifer of Kongal river basin located in Nalgonda district, Andhra Pradesh, India due to the monsoons is estimated using injected tritium technique at a few selected sites. Kriging and Thiessen Polygon methods are employed to interpolate recharge estimates and arrive at more realistic values. The estimate is made from the spatial distribution of recharge values. The spatial distribution of recharge values is derived from 25 site-specific measurements. The quantum of groundwater recharge through vertical infiltration has been estimated as 27.5 and 30.0 mm (l –2) by Kriging and Thiessen polygon methods respectively; a value of 25.0 mm (l –2) was arrived at using average recharge values in the area. The total rainfall during the corresponding period is 566.67 mm (l –2) and thus the fractional amount of recharge is 5% of the rainfall.G ROUNDWATER abstraction has increased to complement the increasing water demand by the continuously growing population. Groundwater recharge to the aquifer system is thus the most important variable to be estimated. Its estima-tion is thus an important input for a rational exploitation and management of groundwater resources. A reliable estima-tion of recharge in hard-rock aquifers is a difficult task in view of wide spatial–temporal variations in the hydro-logical and hydrometrological conditions. It may be estimated by several conventional methods such as groundwaterbalance, lysimeter, etc. These methods require analysis of large volumes of hydrological data (precipitation, surface run-off, evapo-transpiration, change in groundwater storage, etc.) accumulated over a considerable time span, which is generally inadequate, lacking or unreliable in many areas 1–3. The tracer technique is a direct method for estimation of groundwater recharge 4–6 at the site-specific point. Extensive research has been done in the allied fields during the last four decades 7–16. Here an attempt has been made to estimate recharge in the area by the injected tritium technique and to also estimate the spatial variation of recharge by Kriging and Thiessen methods.Integrated hydrogeological and geophysical studies were carried out by National Geophysical Research Institute (NGRI), Hyderabad in the Kongal river basin, located in Nalgonda district, Andhra Pradesh, India (Figure 1 a ). The aim was to develop an appropriate methodology for groundwater management and development. Estimation of natural re-charge from precipitation was an important component of this work. Natural recharge to the shallow aquifer takes place through the movement of percolated rain water through the vadose zone, till it reaches the water table. Hence it depends upon many parameters, namely porosity, permeability, infil-tration capacity of the soil, amount of rainfall, and its variation in space and time domains. Recharge estimates are arrived at by averaging the recharge values estimated at a few repre-sentative sites in the region. Hence, in any given area, if the number of data points gives the recharge values at the representative sites, the accuracy level of the recharge esti-mate of the area improves and tends to become a more realistic evaluation of the parameters. An attempt has been made to utilize the Krige estimates to obtain recharge values for the sites, using neighbouring field-estimated values falling with a certain distance. Using such statistically generated large values, the total recharge of the study area has been arrived at. The study area is about 50 km east of Hyderabad. It covers an area of 180 km 2 of the Kongal river (Figure 1 a ) and lies between 78°48′38″–79°03′25″E long. and 17°07′48″–17°16′48″N lat. Most of the area is covered by pink granite. The area is devoid of major strike like folds and faults. Joint patterns are not common in exposures. Many basic dykes, which are fine-grained dolerite, traverse the granite. These dykes are spread throughout the basin. These are NS, NW–SE, NE–SW and EW trending dykes. A small strip of kankar, which is silty and clayey, is exposed in the southwest-ern zone and also the northeastern part. The area is drained by Kongal river, and its main network of streams is shown in Figure 1 a . The river flows NW to SE and passes through Palwela village. Surface water bodies such as lakes are spread out in the southeastern part of the basin. The area is in general a flat terrain without major topographical relief like hills and valleys. The drainage of the area clearly indica-tes the slope of the terrain, which is NW to SE. Groundwater occurs in shallow-weathered and deep-fractured granite in the western and northwestern parts, whereas in the remaining area it occurs in weathered gneisses. The depth to water levelRESEARCH COMMUNICATIONSFigure 1. Geological map of the study area (a ) and location map of tritium-injected sites (b ).Table 1. Estimated recharge values at 25 sites in Kongal river basinSite no. Villages Recharge (cm)1 Choutuppal-I 0.52 Talasingaram 1.63 Pantangi-I (irrigated field) 11.4 4 Koyalagudem 0.5 5 Yellagiri 0.76 Choutuppal-II 0.57 Golagudem 1.38 Aregudem 1.29 Gundrampally-I 5.010 Yepur-I 2.1 11 Gundrampally-II 1.7 12 Gundrampally-III 1.413 Veliminedu-I 6.414 Ipparti 6.215 Palwela 2.016 Krishnapuram 1.4 17 Tangedpally 3.8 18 Lakkaram 1.819 Dharmojigudem 0.520 Pantangi-II 2.021 Veliminedu-II 6.422 Lingojigudem 4.7 23 Katreuvugudem-I 1.4 24 Katreuvugudem-II 1.525 Yepur-II 2.1Total number of injected points = 45, Total number of sites = 25.varies from a few metres to about 25 m below ground level. The groundwater is mostly exploited through dug wells, dug-cum-bore-wells and bore wells for irrigation, as well as domestic purposes 17. The main source of groundwater is pre-cipitation and to a lesser extent infiltration of water from the tanks and surface water during monsoon periods. Rain gauge stations were established at Gundranpally, Chou-tuppal village, Choutuppal Observatory of NGRI for moni-toring the daily rainfall. The average rainfall recorded from the stations is found to be 57 cm during the study period. Locations where natural recharge was estimated by using injected tracer technique are shown in Figure 1 b .The injected tracer method of recharge estimation takes care of many of the variables and gives the net amount ofwater that joins the water table after contributions to evapora-tion (evapo-transpiration) and run-off. Recharge is esti-mated at representative sites and average recharge in the area under study is computed. To estimate the natural recharge in the Kongal basin, 25 representative sites were selected(Figure 1 b ). Tritium is tagged below the shallow root zone before the onset of monsoon rains and soil samples were collected after monsoon. The displaced position of the tracer is indicated by the peak in its concentration distri-bution, which corresponds to spot natural recharge over thetime interval between the injection of tritium and the collec-tion of the soil core profiles. Moisture content and tritium activity of samples of each site were plotted against depth. The displacement of the tracer was determined and used to estimate the recharge.A small quantity (2.5 ml) of tritiated water (activity 10 µC/ml) was injected at 80 cm depth below the root zone in a 1.2 cm diameter hole made using a drive rod. The hole was filled back with local soil. The location of injec-tion points is shown in Figure 1 b . Results are shown in theTable 1.Soil samples were weighed immediately after collection in the field and double-sealed in a plastic bag. Hoffer-type augers of varying lengths were used. Soil moisture was extracted in the laboratory using the vacuum distillation set-up. The moisture content in about 25 g of soil taken from each sample was determined on a torsion balance, heated by an infrared oven at 105°C. Four millilitre distil-late was mixed with 10 ml of insta-gel (a universal liquid scintillation cocktail for aqueous and non-aqueous samples, manufactured by Packard Instrument Company, USA) in low potash glass vials, and tritium activity was counted us-ing liquid scintillation counter having background of about 25 counts per minute. The tritium activity of every 10 cm sec-RESEARCH COMMUNICATIONSFigure 2. Profile of recharge at (a ) Aregudem and (b ) Lingojigudem.Table 2. Parameters of fitted variogram for recharge variable Mean square Model type Nugget Sill Range (km) errorCubic 0.6 2.70 1.90 3.352 Spheric 0.6 2.77 1.60 3.486 Exponential 0.6 2.25 0.50 3.595tion was plotted against the sample depth for all the profiles. Typical examples of such plots along with moisture varia-tion are shown in Figure 2 a and b .The estimated recharge due to rainfall has varied from 0.5 to 6.4 cm at different sites, with an average value of 2.5 cm in the study area. The total natural recharge to the basin was estimated using point recharge values at each site by Kriging and Theissen polygons.Kriging method is an interpolation technique based on the theory of regionalized variables 18,19. There have been several studies on the spatial variability to groundwater hydro-logy 17,20–22. Spatial distribution of the natural recharge due to monsoon is computed after carrying out variogram analysis of the site-specific recharge measurements. A cubic variogram model, which yielded minimum mean square error (Table 2) is fitted to the experimental variogram. The fitted model revea-led a zone of influence of 1.9 km, which implies that the field values are correlated in space up to a distance of 1.9 km. In the present case, the area was divided into uniform square grids of 1.5 × 1.5 km 2 and the recharge values were estimated at the central node of each grid. The contours of Kriged recharge values and their estimated error variance are shownin Figure 3 a and b respectively. The quantum of natural recharge through vertical infiltration has been estimated to be 4.95 MCM by this method for a complete season. This computed spatial distribution of recharge is helpful in demarcating potential zones of recharge; this in turn helps in selecting sites for future drilling for resources.The area was divided into polygons of various sizes based on the Thiessen polygon method (Figure 3 c ). The location at the centre of each polygon was considered to arrive at the average recharge estimate for each polygon. Finally the recharge values of all the polygons were summed up to arrive at the total natural recharge. The quantum of natural recharge through vertical infiltration has been estimated to be 5.40 MCM by the polygon method. The total input estimated by taking average value of recharge using tracers has been estimated as 4.5 MCM over the study area of 180 km 2. The quantum of groundwater recharge through vertical infiltration has been estimated as 25, 27.5 and 30 mm (l –2) using average value of recharge, Kriging and Theissen polygons methods respectively. The total rainfall during the corresponding monsoon period is 102 MCM and thus the fractional amount of recharge is 5% of the rainfall. The Krige method of estimation provides estimates with error bounds. The Kriged values are obtained using optimal grid size, by variogram analysis. The optimal grid size is a vital parameter provided by the Kriging method for interpolating the spatial recharge values. The estimate is unbiased and has minimum estimation variance; hence is more reliable than the polygon and the averaging method of recharge values. Recharge contours obtained through Kriging is generally smooth, because the Krige estimates are the weighted averageRESEARCH COMMUNICATIONSFigure 3. Kriged recharge values (a), estimated error variance (b), recharge estimation by Theissen polygons (c).of neighbouring field values. Interpolation errors are usually large where the data are sparse, especially when one moves towards the boundary compared to the interior portion of the basin. The estimation error can therefore be reduced if the num-ber of observations is increased at those locations. The result also focuses attention on the large number of scientists enga-ged in groundwater development and management for the application of Kriging method for estimating average as well as the quantum of groundwater recharge over the study area.1. Jacobus, J., de Vries and Simmers, I., Groundwater recharge: Anoverview of processes and challenges. Hydrogeol. J., 2002, 10, 5–17.2. Scanlon, B. R., Healy, R. W. and Cook, P. G., Choosing appropri-ate techniques for quantifying groundwater recharge. Hydrogeol.J., 2002, 10, 18–39.3. Mondal, N. C. and Singh, V. S., A new approach to delineate thegroundwater recharge zone in hard rock terrain. Curr. Sci., 2004, 87,658–662.4. Munich, O. K., Moisture movement measurement by isotope tag-ging. Guide Book on Nuclear Techniques in Hydrology, IAEA,Vienna, 1968, pp. 112–117.5. Munich, K. O., Roether, W. and Thilo, L., Dating of groundwaterwith tritium and C–14. Isotope Hydrology, IAEA, Vienna, 1967,pp. 305–320.6. Zimmermann, U., Munnich, O. K. and Roetgher, W., Downwardmovement of soil moisture traced by means of hydrogen isotopes.Am. Geophys. Monogr., 1967, 11, 28–36.7. Smith, D. B., Wearn, P. L., Richards, H. J. and Rowe, P. C., Watermovement in the unsaturated zone of high and low permeabilitystrata by measuring natural tritium. Isotope Hydrology, IAEA, Vienna, 1970, pp. 73–87.8. Sukhija, B. S. and Rama, Evaluation of groundwater recharge in semi-arid region of India using environmental tritium. Proc. IndianAcad. Sci. Sect. A, 1973, 77, 279–292.9. Dincer, T., Al-Murgin, A. and Zimmerman, U., Study of infiltra-tion and recharge through the sand dunes in arid zones with special tothe stable isotopes and thermonuclear tritium. J. Hydrol., 1974,23, 79–109.10. Allison, G. B. and Huges, M. W., The use of environmental chlorideand tritium to estimate total local recharge to an unconfined aquifer.Aust. J. Soil Res., 1978, 16, 181–195.11. Athavale, R. N., Murthi, C. S. and Chand, R., Estimation of rechargeto phreatic aquifers of Lower Maner Basin by using the tritium injec-tion method. J. Hydrol., 1980, 45, 185–202.12. Athavale, R. N., Chand, R. and Rangarajan, R., Ground water rechargeestimation for two basins in the Deccan Trap Bassalt formation.Hydrol. Sci. J., 1983, 28, 525–538.13. Sharma, M. L., Bari, M. and Byrne, J., Dynamics of seasonal re-charge beneath semi-arid vegetation on the gnangara mound,Western Australia. Hydrol. Process., 1991, 5, 383–398.14. Sharma, M. L., Measurement and prediction of natural groundwaterrecharge – An overview. J. Hydrol., 25, 1987, 49–56.15. Ragarajan, R., Natural recharge evaluation in selected basins ofsemiarid India using injected tritium method, Ph D thesis, Osma-nia University, Hyderabad, 1997, p. 80.16. Rangarajan, R. and Athavale, R. N., Annual replenishable groundwa-ter potential of India – An estimate based on injected tritium stud-ies. J. Hydrol., 2000, 234, 38–53.17. Prakash, M. R. and Singh, V. S., Network designs for groundwatermonitoring – A case study. Environ. Geol., 2000, 39, 628–632. 18. Matheron, G., Principles of Geo-statistics. Econ. Geol., 1963, 58,1246–1266.19. Matheron, G., Les Variables regionalisees et leur estimation, Mas-sion, Paris, 1965, p. 306.20. Delhome, J. P., Spatial variability and uncertainty in groundwaterflow parameters. A geostatistical approach. Water Resour. Res.,1979, 15, 269–280.21. Gambolati, G. and Volpi, G., Groundwater contour mapping inVenice by stochastic interpolator. Water Resour. Res., 1979, 15,281–290.22. Ahmed, S. and Marsily, G. de, Multivariate geostatistical methodsfor estimating transmissivity using data on transmissivity and specificcapacity. Water Resour. Res., 1987, 23, 1717–1737.ACKNOWLEDGEMENTS. We thank the Director, Dr V. P. Dimri, NGRI, Hyderabad, for encouragement and permission to publish this paper. We also thank the anonymous reviewers for valuable suggestions to improve the paper.Received 1 September 2004; revised accepted 6 November 2004c。