DSP外文资料42
外文翻译--DSP产品的发展及应用
外文原文Development and application of DSPDSP concept first appeared in the last century 60s to 70s before they achieve some real-time processing by a computer and they were used for the high frontier. As DSP technology was closed to a large number of operations,and related to the completion of millions of instructions per second operation , it made it into a new unit on the MIPS (millions of instructions per second). 80's, some companies one after another designed for DSP processing technology processor, then became a high-performance DSP processor name. TI released in 1982, first DSP chip, called the TMS32010, this is a processing speed up to 5 MIPS processor. DSP development of the global market has bright prospects, DSP industry will become the most development potential in the 21st century a sunrise industry.DSP digital signal processing technology can represent, but also can represent the digital signal processor, in fact, are inseparable, the former is the theory of technology, through the latter is the actual product. The combination of the real problems on the part of the solution and implementation of a program is called a digital signal processing solutions (DSPS).DSPS is changing all aspects of our way of life, such as contact between people by phone turned personal communication. Human from the invention of the telephone number to 5 million phone users spent 70 years up to 5 million, and analog cellular phone users spent 14 years, while digital cellular phones (GSM is one of them) only took 5 years to achieve the same number of users .Another example of our entertainment, VCD, DVD is replacing VHS recorders, digital TV started NTSC or PAL analog alternative system of TV. Mainly by the number of home theater A / V equipment composition, DSP not only give you surround sound, but also a variety of on-site for your virtual effects.DSP increasingly comes into people's lives, so the annual growth rate of DSP chips is more than 50% in recent years, while the semiconductor production decline, only DSP chip to maintain highgrowth momentum.DSP development challenge is the rapid speed of faster CPU and prices continued to drop, so DSP manufacturers face two options, one is to accelerate the development of DSP, the other is out of competition. It seems the major DSP manufacturers have chosen the first route, in particular, accounted for 45% share of global DSP sales in the United States TI company's products on the basis of structural adjustment in order to go to one of investment diversification, Establishing the development of DSPS as the main products, namely, has all the technology, all products in DSP.Modern digital signal processors are high-speed digital signal processing IC circuit, it happens to meet the needs of multimedia information society, so it get the rapid development and growth. Today, the world electronics market for a variety of DSP devices have very rich. Large and small packages of DSP devices, has been widely used in various production areas, and areas of DSP applications continues to expand rapidly exception.1、digital mobile phoneDigital mobile phones despite the complex pattern, but basically can be classified into two categories: high-speed mobile phones and low-speed mobile phone. The high-speed mobile phone by definition is used the body in the high-speed mobile phone, such as in aircraft, ships and cars in the free-call phone. While a standard digital high-speed mobile a lot, but in general use today is the European GSM (Global System for Mobile Communication) standard. Since the introduction of digital cellular telephones has been more than 70 countries around the world widely. Digital cellular phones known as the GSM standard are called digital cellular phones, which have international roaming (Roaming) function, SIMC (Subscriber Identification Module Card) to the user the convenience of using cellular phones. Data communication services are being expanded capabilities and its compatibility with the ISDN system, for example, the British Ministry of BT's Cellnet GSM has been used to provide digital data and fax services, so also the placement of a Toshiba laptop digital cell phones.The so-called low-speed mobile phone, of course, high-speed mobile body can not be applied in full, but in walking speed is very easy to use, cheaper prices than digital cell phones, so called the poor cellular phone. Low-speed mobile phone is on their real terms. It is the digital cordless phone, analogue cordless phone remains the Marsupial structure: sub-machine, also known as mobile phones, can be about 100 meters away from the machine tool is within a radius of space to achieve the free movement of walking through it; machine tools, also known as base station can be used as the family's staying phone can also be hung on the walls of shops, street wire column, widely distributed. By a unified exchange facilities management, seamless handover (Seamless Hand On) function. Such a lot of low-speed mobile phone standards. For example, the more widely used in Europe's DECI (Digital European Cordless Telecommunication), Japan, South Korea, Southeast Asia, the application of PHS (Personal Handy-phone System), and Philips, and our joint development of DCCT (Digital China Cordless Telephone). Of these, PHS and DECT standard low-speed mobile phone developed rapidly, China's DCCT lack of key DSP technology is still in the design stage.Digital mobile phones (including high speed and low speed) for each phone to be used for at least a DSP device, therefore, the rapid development of digital mobile phones need a very large number of DSP devices.2, data modemAs is well known that traditional digital signal processor applications, one is a modem. Now, the modem as a connection information processing systems and multimedia communication ties, more and more attention. In recent years Internet craze in full swing, the common people in the Internet surfing become common practice. Use of PC, via a modem via telephone lines, Internet dial-up connection is to achieve the most convenient form of the visit. As Internet users increased dramatically, once led to 28.8Kbps modem out of stock products on the market. Especially by the use of PC, visit the program calls the active image information, the expected use of higher data transfer speed of the modem.To meet this new demand has developed a high-speed international (33.6Kbps) modem international standards. This means that, in the high-speed modems in need for more high-performance DSP devices. This 33.6Kbps modem (V.34)It is designed for the transmission of data, on this basis developed DSVD modem, it can transfer both voice data transfer. Undoubtedly, this way will require a higher function of DSP devices.With the emerging high performance modem, it seems like a low-speed modems such as V. 17 (14.4Kbps) no longer useless. In fact, just the opposite, and now the rise of information appliances, such as machine tools left behind PHS phones and personal FAX integration products on the market. This means, V. 17 (14.4Kbps) type of modem is still the market. Thus, the requirements of various modems in DSP also varied.3、disk / CD-ROM controller needsWith the development of multimedia information, various information storage media products emerged, such as disk storage, CD-ROM and DVD (Digital Versatile Disk)-ROM of new products onto the market. Today's disk drive HDD, storage capacity has been considerable, large HDD Leaving aside, even the ordinary PC-HDD storage capacity has been higher than in 1GB, see photo 4. Small HDD to the high-density, high storage capacity and high-speed access direction, the controller must have high precision and high-speed response characteristic, it is not what it used for DSP performance, high-speed DSP is essential for critical devices.Japan's HDD technology can not surpass the U.S., so the main direction of focus to the CD-ROM technology, in 1996, Japan Electronics Show'96 on the 35th, and finally the DVD-ROM products available to the public. Moreover, Japan is not satisfied, his aim was to win the rewritable DVD-RAM. Only in respect terms of DVD-ROM, single-sided 12cm disc record a 4.7GB volume of information, equivalent to the floppy disk FD 12cm diameter 3200 film as much storage capacity than CD-ROM 6 times higher. Such a high density DVD-ROM, read the fine degree of control can be imagined.HDD and CD ROM in the controller in reason to use high-speed DSP, the use of its high-speed "plot and" processing power. Because the disc rotation control, head positioning control and CD laser beam focus control, are adopted digital servo control technology and systems. This is the control technology which is now built on the basis of mathematical models. It needs a complex matrix operation for control., it is absolutely impossible without high-speed operation DSP.4. graphics and video processing requirementsActivities in the application of DVD image compression / decompression with the MPEG2 encoder / decoder, but also widely used in video on demand VOD, high-grade cable and satellite broadcasting and other areas. In these areas, the application of DSP should have a higher processing speed and functionality. Moreover, the active image compression / decompression technology is changing, for example, DCT transform domain coding is difficult to improve the compression ratio and reconstructed image quality, so there visual perception characteristics of guided image compression method based on wavelet analysis. The new algorithm appears to require a corresponding high-performance DSP. Recently, Japanese universities and high-tech companies for the development of virtual reality VR system, put considerable power, the use of modern computer science CG images generated 3-D graphics, an urgent need for multiple DSP parallel processing system. Of these, the system node in the DSP unit, requires compatible with parallel processing architecture.Color still image compression / decompression, JPEG standard is widely used, the core algorithm is also the discrete cosine transform. JPEG encoder / decoder application, in addition to digital cameras, the estimated color printer and color scanner will be applied. Therefore, the development of DSP will surely grow.5, automotive electronic systems and other applicationsIncreasingly prosperous automotive electronic systems, such as the installation of infrared and millimeter-wave radar, DSP will be needed for analysis. Today, more and more vehicles, anti-collision system has become a hotspot. Moreover, the use of camera images through DSPprocessing data needs to be displayed in the driving system where, for the driver information.Areas of DSP applications can be said to abound, video conferencing system, is also a large number of applications DSP devices. The machines are also audio-visual applications DSP. With the development of science and technology, there will be many new DSP applications.中文译文DSP产品的发展及应用DSP概念最早出现在上个世纪60年代,到70年代才由计算机实现部分实时处理,当时主要用于高尖端领域。
DSP英文版(精)
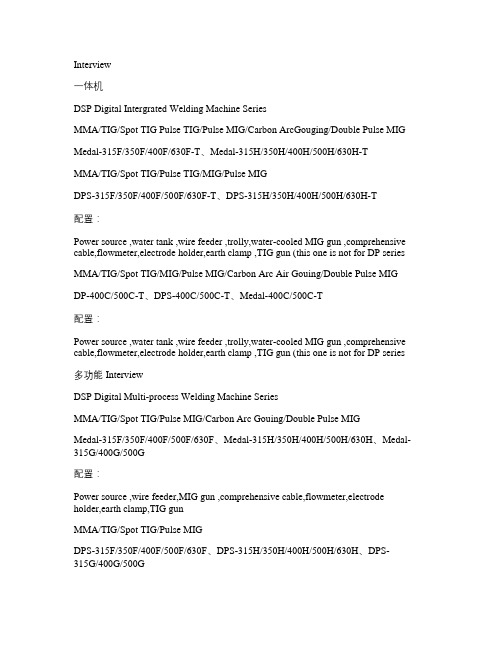
Interview一体机DSP Digital Intergrated Welding Machine SeriesMMA/TIG/Spot TIG Pulse TIG/Pulse MIG/Carbon ArcGouging/Double Pulse MIG Medal-315F/350F/400F/630F-T、Medal-315H/350H/400H/500H/630H-TMMA/TIG/Spot TIG/Pulse TIG/MIG/Pulse MIGDPS-315F/350F/400F/500F/630F-T、DPS-315H/350H/400H/500H/630H-T配置:Power source ,water tank ,wire feeder ,trolly,water-cooled MIG gun ,comprehensive cable,flowmeter,electrode holder,earth clamp ,TIG gun (this one is not for DP series MMA/TIG/Spot TIG/MIG/Pulse MIG/Carbon Arc Air Gouing/Double Pulse MIG DP-400C/500C-T、DPS-400C/500C-T、Medal-400C/500C-T配置:Power source ,water tank ,wire feeder ,trolly,water-cooled MIG gun ,comprehensive cable,flowmeter,electrode holder,earth clamp ,TIG gun (this one is not for DP series 多功能 InterviewDSP Digital Multi-process Welding Machine SeriesMMA/TIG/Spot TIG/Pulse MIG/Carbon Arc Gouing/Double Pulse MIGMedal-315F/350F/400F/500F/630F、Medal-315H/350H/400H/500H/630H、Medal-315G/400G/500G配置:Power source ,wire feeder,MIG gun ,comprehensive cable,flowmeter,electrode holder,earth clamp,TIG gunMMA/TIG/Spot TIG/Pulse MIGDPS-315F/350F/400F/500F/630F、DPS-315H/350H/400H/500H/630H、DPS-315G/400G/500GMMA/MIG/ Pulse MIGDP-315F/350F/400F/500F/630F、DP-315H/350H/400H/500H/630H、DP-315G/400G/500G、DP-350J/500J/630J配置:Power source ,wire feeder ,MIG gun ,comprehensive cable,flowmeter ,electrode holder,earth clamp手工/气保DSP Digital MMA/TIG/MIG InterviewNBT-315F/350F/400F/500F/630F、NBT-315G/400G/500G配置:Power source ,wire feeder ,MIG gun ,comprehensive cable,flowmeter,electrode holder,earth clamp,TIG gun气保焊机DSP Digital MIG Welding Machine Series InterviewMMA/MIG/MAGNB-315F/350F/400F/500F/630F、NB-315G/400G/500G、NB-350J/500J/630J 配置:Power source ,wire feeder ,MIG gun ,comprehensive cable,flowmeter,electrode holder,earth clamp,earth clamp氩弧焊机DSP Digital MIG Welding Machine SeriesMMA/TIG/Spot TIG/Pulse TIGWSM-315F/350F/400F/500F/630F、WSM-315G/400G/500G配置:Power source ,electrode holder,earth clamp,TIG gunMMA/TIGWS-315F/350F/400F/500F/630F、WS-315G/400G/500G配置:Power source ,electrode holder,earth clamp,TIG gun手工焊机DSP Digital MMA Welding Series InterviewMMAZX7-315F/350F/400F/500F/630F、ZX7-315G/400G/500G、ZX7-350J/500J/630J 配置:Power source ,electrode holder ,earth clamp。
dsp外文翻译

外文参考文献翻译英文题目 The Breadth and Depth of DSP 中文题目 DSP的广度和深度学院自动化与电气工程学院专业自动化姓名白学文学号 201108536指导教师王思明2015 年 04月 20日DSP的广度和深度数字信号处理是最强大的技术,将塑造二十一世纪的科学与工程之一。
革命性的变化已经在广泛的领域:通信,医疗成像,雷达和声纳,高保真音乐再现,石油勘探,仅举几例。
上述各领域已建立了深厚的DSP技术,用自己的算法,数学,和专门技术。
这种呼吸和深度的结合,使得它不可能为任何一个人掌握所有已开发的DSP技术。
DSP教育包含两个任务:学习一般适用于作为一个整体领域的概念,并学习您感兴趣的特定领域的专门技术。
本章开始描述DSP已在几个不同领域的戏剧性效果的数字信号处理的世界,我们的旅程。
革命已经开始。
1 DSP的根源独特的数据类型,它使用的信号,数字信号处理是区别于其他计算机科学领域。
在大多数情况下,这些信号源于感觉来自现实世界的数据:地震的震动,视觉图像,声波等DSP是数学,算法,并用来操纵这些信号的技术后,他们已被转换成数字形式。
这包括了各种目标,如:加强视觉图像识别和语音生成,存储和传输的数据压缩,等假设我们重视计算机模拟 - 数字转换器,并用它来获得一个现实世界的数据块。
DSP回答了这个问题:下一步怎么办?DSP的根是在20世纪60年代和70年代数字计算机时首次面世。
电脑是昂贵的,在这个时代,DSP是有限的,只有少数关键应用。
努力开拓,在四个关键领域:雷达和声纳,国家安全风险是石油勘探,可以大量资金;太空探索,其中的数据是不可替代的;和医疗成像,可节省生活。
20世纪80年代和90年代的个人电脑革命,引起新的应用DSP的爆炸。
而不是由军方和政府的需求动机,DSP的突然被带动的商业市场。
任何人士如认为他们可以使资金在迅速扩大的领域突然一个DSP供应商。
DSP的市民等产品达到:移动电话机,光盘播放器,电子语音邮件。
DSP外文资料43
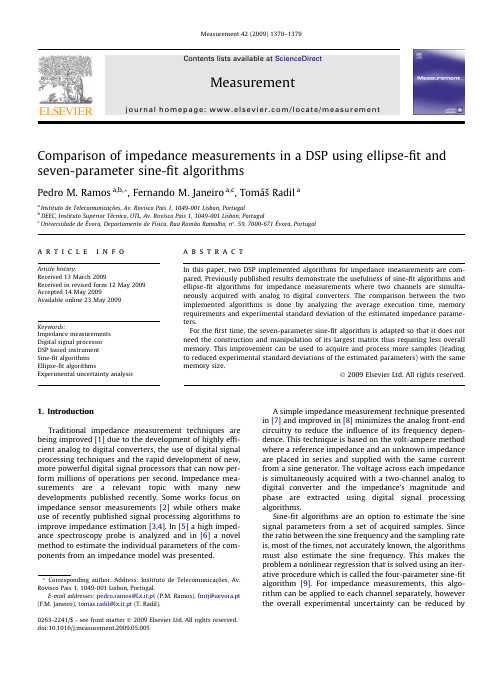
Comparison of impedance measurements in a DSP using ellipse-fit and seven-parameter sine-fit algorithmsPedro M.Ramos a,b,*,Fernando M.Janeiro a,c ,TomášRadil aaInstituto de Telecomunicações,Av.Rovisco Pais 1,1049-001Lisbon,PortugalbDEEC,Instituto Superior Técnico,UTL,Av.Rovisco Pais 1,1049-001Lisbon,Portugal cUniversidade de Évora,Departamento de Física,Rua Romão Ramalho,n °.59,7000-671Évora,Portugala r t i c l e i n f o Article history:Received 13March 2009Received in revised form 12May 2009Accepted 14May 2009Available online 23May 2009Keywords:Impedance measurements Digital signal processor DSP based instrument Sine-fit algorithms Ellipse-fit algorithmsExperimental uncertainty analysisa b s t r a c tIn this paper,two DSP implemented algorithms for impedance measurements are com-pared.Previously published results demonstrate the usefulness of sine-fit algorithms and ellipse-fit algorithms for impedance measurements where two channels are simulta-neously acquired with analog to digital converters.The comparison between the two implemented algorithms is done by analyzing the average execution time,memory requirements and experimental standard deviation of the estimated impedance parame-ters.For the first time,the seven-parameter sine-fit algorithm is adapted so that it does not need the construction and manipulation of its largest matrix thus requiring less overall memory.This improvement can be used to acquire and process more samples (leading to reduced experimental standard deviations of the estimated parameters)with the same memory size.Ó2009Elsevier Ltd.All rights reserved.1.IntroductionTraditional impedance measurement techniques are being improved [1]due to the development of highly effi-cient analog to digital converters,the use of digital signal processing techniques and the rapid development of new,more powerful digital signal processors that can now per-form millions of operations per second.Impedance mea-surements are a relevant topic with many new developments published recently.Some works focus on impedance sensor measurements [2]while others make use of recently published signal processing algorithms to improve impedance estimation [3,4].In [5]a high imped-ance spectroscopy probe is analyzed and in [6]a novel method to estimate the individual parameters of the com-ponents from an impedance model was presented.A simple impedance measurement technique presented in [7]and improved in [8]minimizes the analog front-end circuitry to reduce the influence of its frequency depen-dence.This technique is based on the volt-ampere method where a reference impedance and an unknown impedance are placed in series and supplied with the same current from a sine generator.The voltage across each impedance is simultaneously acquired with a two-channel analog to digital converter and the impedance’s magnitude and phase are extracted using digital signal processing algorithms.Sine-fit algorithms are an option to estimate the sine signal parameters from a set of acquired samples.Since the ratio between the sine frequency and the sampling rate is,most of the times,not accurately known,the algorithms must also estimate the sine frequency.This makes the problem a nonlinear regression that is solved using an iter-ative procedure which is called the four-parameter sine-fit algorithm [9].For impedance measurements,this algo-rithm can be applied to each channel separately,however the overall experimental uncertainty can be reduced by0263-2241/$-see front matter Ó2009Elsevier Ltd.All rights reserved.doi:10.1016/j.measurement.2009.05.005*Corresponding author.Address:Instituto de Telecomunicações,Av.Rovisco Pais 1,1049-001Lisbon,Portugal.E-mail addresses:pedro.ramos@Lx.it.pt (P.M.Ramos),fmtj@uevora.pt (F.M.Janeiro),tomas.radil@lx.it.pt (T.Radil).Measurement 42(2009)1370–1379Contents lists available at ScienceDirectMeasurementj ou r na l h om e pa ge :w w w.e lse vi e r.c om /lo c at e /me as u r em en tforcing the common frequency in what is called the seven-parameter sine-fit algorithm[10].Nevertheless,the itera-tive nature of the sine-fit algorithms results in a large num-ber of operations that the processor must execute.Another issue that can affect the performance of sine-fit algorithms implemented in DSP devices is the memory requirements. In fact,the seven-parameter algorithm as proposed in[10] must build a matrix with seven columns and2N rows,cor-responding to the total number of samples acquired in both channels.This large matrix and its manipulation to-gether with the limited memory available in the DSP re-stricts the number of samples that can be processed.In this paper,the algorithm proposed in[10]is shown to be applicable in a memory restricted system by bypassing the need to build the2NÂ7matrix.This modification al-lows the DSP to process more samples to estimate the sine-wave parameters with the seven-parameter sine-fit.Although the frequency must be accurately known for a correct estimation of the sine signals’amplitudes,phases and dc components by the sine-fit algorithms,in imped-ance measurements an accurate frequency value is not needed.The time information,and thus the sine signals frequency,can be removed from the problem by making an XY plot of the two waves.The result is an ellipse whose parameters can be estimated by ellipse-fit algorithms such as the one presented in[11]and then improved in[12].The sine signals’parameters can then be extracted from the el-lipse parameters as proposed in[13].This algorithm has been recently adapted and optimized for use in DSP based impedance measurements[14].In the modified ellipse-fit method published in[14]there is no limit on the number of samples that can be used since only nine values must be stored and the samples themselves can be discarded after their contribution to the nine stored values is taken into account.These characteristics make the algorithm a prime candidate for efficient implementation in a DSP based impedance measurement instrument.In this paper,the performance of the DSP implementation of the ellipse-fit algorithm and the seven-parameter sine-fit algorithm is compared through the evaluation of the memory requirements,speed of execution and experimental uncer-tainty of both algorithms.The system used for the comparison is based on a commercialfloating-point DSP kit,with few external electronics,for baseline assessment and require-ments definition.The performance tests were executed at fre-quency f=1kHz,for impedances with magnitudes from 100X to15k X and phases in the±90°range.The paper is divided into four sections including the introduction(Section1)and the conclusions(Section4). The description of the two algorithms is presented in Sec-tion2together with the measurement setup and the algo-rithms DSP implementation details.The performance comparison is performed in Section3where the experi-mental results are shown and analyzed.The conclusions are presented in Section4.2.Measurement methodThis section describes the measurement setup and method as well as the two signal processing algorithms used.The measurement method is based on measuring the voltages across two impedances placed in series and supplied with a current from a sine generator that sets the measurement frequency.This method is also com-monly called the series comparison method.The voltages are simultaneously acquired by two differential input acquisition channels and the samples are then transmitted to the DSP in which the signal processing algorithms are implemented.The two acquired sine signals are modeled byu1ðtÞ¼C1þD1cosð2p ftþ/1Þu2ðtÞ¼C2þD2cosð2p ftþ/2Þð1Þwhere C k is the dc component,D k is the sine amplitude and /k is the phase of channel k.The two algorithms compared in this paper,estimate the sine signals amplitude ratio D2/D1,their phase differ-ence D/=/2À/1and the corresponding dc components. In addition,the seven-parameter algorithm also estimates the common frequency f.2.1.Measurement circuitThe basic measurement circuit is presented in Fig.1. The use of different reference impedances is needed so that the amplitude of the acquired signals is as close as possible to the ADC input range,thus maximizing the use of the ADC dynamic range.In addition,the different reference impedances are also used to avoid ellipse degeneration [14].Two analog switches are used to select the appropri-ate reference impedance from afixed set of impedances. Thefirst switch selects the reference impedance through which the currentflows and the second switch selects where the ADC channel is connected.This switch isneededFig.1.Basic measurement circuit.FG is the function generator(Agilent 33250A).The DSP controls the two switches to select the reference impedance(Z R)in order to maximize the ADC input voltages.The ADCs included in the acquisition channels are also controlled by the DSP and sample both channels simultaneously.Z is the impedance under measurement.P.M.Ramos et al./Measurement42(2009)1370–13791371to assure that thefirst switch’s impedance is not measured together with the reference impedance.The impedance of the second switch is not measured because it is in series with the voltage circuit of the four-terminal measurement setup of the reference impedance.This setup removes the error caused by the impedance of the switches and is a modification of the four-wire impedance measurement, used especially for the measurement of low resistors by eliminating the influence of resistances of connecting wires and terminals.The switches were implemented using the Analog Devices ADG4078-Channel,high perfor-mance analog multiplexer.With channel1sampling the voltage across the refer-ence impedance and channel2sampling the voltage across the unknown impedance,the estimated impedance magni-tude isj Z j¼D2D1j Z R jð2Þwhere j Z R j is the magnitude of the reference impedance at the measurement frequency.The estimated impedance phase isuZ ¼D/þu ZRð3Þwhere u ZR is the reference impedance phase at the mea-surement frequency.The acquisition process consists in:(i)an initial acquisi-tion and quick estimation of the unknown impedance magnitude and phase;(ii)with this initial estimate,the DSP selects the reference impedance that best matches the unknown impedance magnitude and avoids ellipse degeneration;(iii)final acquisition using the selected ref-erence impedance;(iv)estimation of the sine parameters using either the ellipse-fit algorithm or the seven-parame-ter sine-fit algorithm;(v)estimation of the impedance parameters using(2)and(3).Note that,for the seven-parameter sine-fit,the step(ii)does not have to avoid ellipse degeneration.Nevertheless,to ensure comparable results between the two methods,the same procedure is done for both algorithms.2.2.Seven-parameter sine-fitSine-fit algorithms were standardized in[9]for the characterization of ADCs.Their basic objective is to deter-mine a set of parameters of thefitting model(analytical expression of a sine signal)that minimizes the sum of the squared errors between the model and the sampled data.Two sine-fit algorithms are described in[9]:the three-parameter algorithm and the four-parameter algo-rithm.Thefirst estimates the phase,amplitude and dc component when the signal frequency is known and is a multiple linear regression method that requires no itera-tions.In the four-parameter algorithm,the frequency is also estimated which makes the model nonlinear and re-quires an iterative procedure in order to obtain the best parameters.The convergence of the algorithm depends on the initial estimates of the parameters.For two-channel systems with a common frequency,as is the case of imped-ance measurements,all the information from both records should be used to obtain a better estimate of the common frequency.This is obtained with the seven-parameter sine-fit[10]which is also an iterative algorithm much like the four-parameter.The main difference is that it estimates, in each iteration,the two amplitudes,the two phases,the two dc components and the common frequency.In[15] the effectiveness of this method was demonstrated by the smaller Cramér Rao Lower Bound(CRLB)of the fre-quency and phase difference when compared with the application of two four-parameter sine-fits.In the seven-parameter sine-fit,the estimated parame-ter vector for each iteration isxðiÞ¼AðiÞ1BðiÞ1CðiÞ1D fðiÞAðiÞ2BðiÞ2CðiÞ2h i Tð4Þwhere A k and B k are the in-phase and quadrature ampli-tudes from which the sine amplitudes D k and phases/k are obtained[9].D f(i)is the frequency correction that up-dates the estimated common frequency.The iterative pro-cess ends when the relative frequency adjustment D f(i)/f(i) is below a preset threshold–currently set at5Â10À7. After the iterative part of the algorithm is completed and thefinal frequency is determined,the amplitudes A k and B k are determined with the three-parameter sine-fit.The estimated parameter vector is obtained fromxðiÞ¼½½DðiÞ T DðiÞ À1½½DðiÞ T y ð5Þwhere y is the concatenated sample vectory¼½u1;1u1;2...u1;N u2;1u2;2...u2;N Tð6Þandð7Þwith(x=2p f(i))QðiÞk¼cosðx t k;1Þsinðx t k;1Þ1cosðx t k;2Þsinðx t k;2Þ1.........cosðx t k;NÞsinðx t k;NÞ1266664377775ð8ÞandrðiÞk¼a k;1a k;2...a k;N266664377775with a k;n¼À2p AðiÞk t k;n sinðx t k;nÞþ2p BðiÞk t k;n cosðx t k;nÞ:ð9ÞThe calculation of D(i)requires2NÂ7words(in DSP imple-mentations,each word usually corresponds to a32-bit long single precisionfloat[16]).[D(i)]T D(i)requires an addi-tional7Â7words while[D(i)]T y requires7words.Overall, the method requires17N+63words(the17N part corre-sponds to2N for the samples,14N for D(i)and1N for the FFT used in the interpolated discrete Fourier transform (IpDFT)[17]to estimate the initial frequency).Due to the restricted DSP internal memory and the space occupied by the program itself and other internal variables,the number of samples N is limited to1024in case of the em-ployed DSP.Note that,although external DSP memory is1372P.M.Ramos et al./Measurement42(2009)1370–1379available and can be used,this would considerably slow down the algorithm.The proposed optimization to remove much of the memory constraints associated with the num-ber of acquired samples is based on the direct calculation of[D(i)]T D(i)and[D(i)]T y further optimized considering simultaneous acquisition(i.e.,t1,n=t2,n=t n)½DðiÞ T DðiÞ¼E1;1E1;2E1;3E1;4000E1;2E2;2E2;3E2;4000E1;3E2;3N E3;4000E1;4E2;4E3;4E4;4E4;5E4;6E4;7000E4;5E1;1E1;2E1;3000E4;6E1;2E2;2E2;3000E4;7E1;3E2;3N26666666666643777777777775ð10ÞwithE1;1¼X Nn¼1cos2ðx t nÞ;E1;2¼X Nn¼1cosðx t nÞsinðx t nÞ;E1;3¼X Nn¼1cosðx t nÞ;E1;4¼X Nn¼1cosðx t nÞa1;n;E2;2¼X Nn¼1sin2ðx t nÞ;E2;3¼X Nn¼1sinðx t nÞ;E2;4¼X Nn¼1sinðx t nÞa1;n;E3;4¼X Nn¼1a1;n;E4;4¼X Nn¼1a21;nþa22;n;E4;5¼X Nn¼1cosðx t nÞa2;n;E4;6¼X Nn¼1sinðx t nÞa2;n;E4;7¼X Nn¼1a2;n:Notice that[D(i)]T D(i)is a symmetric matrix.Finally,for[D(i)]T y½DðiÞ T y¼P Nn¼1cosðx t nÞu1;nP Nn¼1sinðx t nÞu1;nP Nn¼1u1;nP Nn¼1u1;n a1;nþu2;n a2;nP Nn¼1cosðx t nÞu2;nP Nn¼1sinðx t nÞu2;nP Nn¼1u2;n266666666666666666666666666664377777777777777777777777777775:ð11ÞWith this method,the memory usage is reduced to3N+63 (the3N part corresponds to2N for the samples and1N for the FFT used in the IpDFT).For the initial A k and B k estimates,the three-parameter sine-fit is applied to each channel using the frequency ob-tained with the IpDFT.These two algorithms are also implemented in the DSP.In Fig.2,96samples acquired with the proposed system at1kHz measurement frequency sampled at48kS/s are shown together with the reconstructed sine signals using the seven-parameter algorithm.In this case D2/D1’1.393and D/’À44.2°.2.3.Ellipse-fitThe ellipse-fit algorithm estimates the ellipse parame-ters that bestfit the XY pairs of voltages from the two channels.From the ellipse parameters,the sine amplitudes, dc components and the phase difference are determined. The ellipse-fit algorithm is a non-iterative method based on Lagrange multipliersfirst published in[11]and im-proved in[12].The refined implementation,first published in[14],requires the construction of small matrices(3Â3) instead of the NÂ3large matrix used in[12],their multi-plication and inversion and also the determination of the eigenvectors of a3Â3matrix.Through algebraic manipu-lation the common frequency can be eliminated from(1) u1ÀC1D12þu2ÀC2D22À2ðu1ÀC1Þðu2ÀC2ÞD1D2ÂcosðD/ÞÀsin2ðD/Þ¼0:ð12ÞEq.(12)corresponds to a conicFðu1;u2Þ¼au21þbu1u2þcu22þdu1þeu2þg¼0;ð13Þwhich describes an ellipse,whenb2À4ac<0:ð14ÞBy introducing a scaling constant q,this condition can be set to4ac-b2=1.For conic(12)to correspond to an ellipse three condi-tions must be verified:D1–0;D2–0and cos2(D/)<1, i.e.,(12)is either a line segment(whenever at least one of the conditions is not true)or an ellipse.From the ellipse parameters,the sine parameters are obtained throughD1¼1ffiffiffiffiffiffiqap;D2¼1ffiffiffiffiffiqcp;ð15ÞC1¼2cdÀbeb2À4ac;C2¼2aeÀdbb2À4acð16ÞP.M.Ramos et al./Measurement42(2009)1370–13791373andcosðD/Þ¼ÀsignðqÞÂb2ffiffiffiffiffiacp:ð17ÞFor impedance measurements the actual sine amplitudes are of no interest since it is the amplitude ratio D2/D1that determines the impedance magnitude.This ratio is given byD2 D1¼ffiffiffiacrð18Þtherefore the scaling constant q does not need to be deter-mined.Also,the sign of the scaling constant,required in (17),can be replaced by the sign of parameter a(due to scaling,parameters a and c can both be negative which corresponds also to q<0).The only parameter that needs further calculation is the sign of D/which is unavailable from(17)but can be re-trieved from the rotation direction of the ellipse–if the el-lipse is constructed clockwise D/>0and D/<0if it is constructed counterclockwise.The sign of the phase differ-ence between two consecutive sample pairsd n jn¼1;...;NÀ1¼sign arg u1;nþ1À1X Ni¼1u1;iþj u2;nþ1À1X Ni¼1u2;i!"# (Àarg u1;nÀ1X Ni¼1u1;iþj u2;nÀ1X Ni¼1u2;i!"#)ð19Þcan be used to determine whether the ellipse is being con-structed clockwise or counterclockwise.The ellipse center is estimated using all the acquired samples.However,due to the presence of noise,some of the consecutive samples may give the wrong rotation direction,therefore a voting system was implemented.The sign of the sum of the votes defined in(19)determines the sign of D/signðD/Þ¼ÀsignX Nn¼1d n!:ð20ÞThis system is specially designed for noisy and low ampli-tude situations.For example,for f=1kHz,f S=96kS/s and 1024samples,this voting system has never failed in simu-lations for SNR>15dB.The ellipse-fit requires2N+42words(2N for the sam-ples,four3Â3matrices and two3element vectors).With the current sine-fit implementation,the memory needed by the ellipse-fit is not a big improvement from the mem-ory needed by the seven-parameter sine-fit.The main advantage is the total number of operations–not only for the matrix construction and manipulations but also due to the fact that the sine-fit is iterative and the el-lipse-fit is not.In Fig.3,96samples acquired at48kS/s with the pro-posed system at1kHz measurement frequency are shown together with the reconstructed ellipse obtained using the ellipse-fit.This situation corresponds to the one depicted in Fig.2.Two periods are represented that correspond to two ellipse rotations.Due to low noise and nearly coherent sampling,the data points of the second period are over-lapped with the points from thefirst rotation.2.4.DSP implementationThe DSP is an Analog Devices ADSP-21369SHARC high performance32-bitfloating point processor operating at 332MHz performing2GFLOPS/664MMACS with2Mbit on-chip SRAM.The DSP is included in an evaluation kit with a multichannel Sigma-Delta ADC(AD1835-with24 bit and sampling rate of48kS/s or96kS/s)and2Mbit SPI FLASH memory.The basic block diagram of the DSP system interface to the circuit of Fig.1is shown in Fig.4.Outside the DSP kit, two instrumentation amplifiers are used since the kit ana-log inputs are referenced.The ellipse-fit and the seven-parameter sine-fit algo-rithms were implemented in C using the Analog Devices VisualDSP++to program the DSP kit.The implemented subroutines include:acquisition(communication with the AD1835),IpDFT,matrix operations(e.g.,determination of eigenvectors and eigenvalues)and simple operations for the estimation of the impedance magnitude and phase.A basic set of commands to interface the DSP with a PC through a fast serial connection(115200baud)was also implemented.The implemented commands enable the impedance measurements either with the ellipse-fit or the seven-parameter sine-fit.Also included is a command to retrieve the unprocessed acquired samples.This option enables some signal analysis at a lower level to assess the analog circuitry and the analog to digital conversion. The complete program is stored in the non volatileflashFig. 4.Block diagram of the DSP system that interfaces the basic measurement circuit.1374P.M.Ramos et al./Measurement42(2009)1370–1379memory and upon boot up or reset of the DSP kit,the pro-gram is loaded from theflash memory to the DSP and exe-cuted.It then enters a command mode waiting for instructions from the serial interface.In addition to executing the algorithms,the DSP also controls the selection of the reference impedance.3.Measurement resultsThe impedance measurement system was tested for both algorithms with the measurement of105different impedances at a frequency of1kHz with magnitudes from 100X up to15k X and phases in the±90°range.3.1.Reference impedanceIn the seven-parameter sine-fit,the reference imped-ance selection usually only depends on the unknown impedance’s magnitude.However,since the ellipse-fit algorithm cannot estimate the ellipse parameters when the signals are in phase or in opposition,i.e.,when cos2(D/)=1because the conic is not an ellipse,the selec-tion of the reference impedance must also be based on the unknown impedance’s phase.Another consequence of this is that the reference impedances must include some phases substantially different from0°.For the selected impedance range,a set of six reference impedances were used.The measured impedances together with the delimit-ing regions used to select the reference impedances are de-picted in Fig.5.The selection of the reference impedance is done as follows:(i)one period measurement of the two sine signals with a resistive reference impedance;(ii)pre-liminary estimation of the impedance magnitude and phase;if the estimated impedance magnitude is below 3.5k X then the selected reference impedance has1k X magnitude,otherwise a5k X magnitude reference imped-ance is used;(iii)if the estimated phase is between0°and 10°,a capacitive reference impedance is applied(R=100X in series with C=159nF for the lower magnitude and R=100X in series with C=31.8nF for the higher magni-tude);(iv)if the estimated phase is betweenÀ10°and 0°,an inductive reference impedance is used(R=100X in series with L=157mH for the lower magnitude and R=100X in series with L=796mH for the higher magni-tude);(v)otherwise a resistive reference impedance is cho-sen(R=1k X for the lower magnitude and R=5k X for the higher magnitude).3.2.Channel mismatch compensationTo compensate for the mismatch between the two acquisition channels,the same signal was applied to both channels and repeated acquisitions at different frequencies (from100Hz up to10kHz)were made.The seven-param-eter sine-fit was then used to obtain the amplitude and phase calibration coefficients.Their average and standard deviations are plotted in Fig.6.These calibration coeffi-cients are then used in each measurement to correct the estimated amplitude ratio and phase difference.3.3.Evaluation of measurement standard deviationsTo assess the algorithms’performance,repetitive mea-surements of the impedances were executed.Each imped-ance was measured5000times at a frequency of1kHz, with1024points per channel acquired at96kS/s.For each measured impedance,the average value of the impedance magnitude and phase and the corresponding experimental standard deviation values were registered.The experimen-tal standard deviation results obtained with the ellipse-fit algorithm are shown in Figs.7and8.From the results as a function of the measurement impedance phase(Figs.7 and8on the right side)it is clear that the algorithm is independent on the impedance phase.Note that this inde-pendence for the ellipse-fit is a result of the method used to select the reference impedance,i.e.,the ellipse-fit meth-od is phase dependant because it does not work for phase differences near0°[14].Regarding the impedance magni-tude it is also clear that the slightly worse results occur when the measured impedance magnitude is near the lim-its of the measurement range.This is justified by the re-duced number of reference impedances and their values –i.e.,near the impedance measurement range,the mis-match of the reference impedance and the unknown impedance magnitude is larger.The maximum relative standard deviation of the impedance magnitude is0.016% while the maximum standard deviation of the estimated impedance phase is0.0089°.Even in the most mismatched measurement situation of the105impedances,the signal to noise ratio(SNR)is greater than54dB.This ensures that the ellipse-fit is not biased(as shown in[14],the algorithm is slightly biased but only for SNR below30dB).In Figs.9and10the results obtained with the seven-parameter sine-fit algorithm are shown for the same situ-ations as those depicted in Figs.7and8.For the seven-parameter sine-fit algorithm,the worst results correspond to a relative standard deviation of the impedance magnitude of0.015%and0.0083°for the exper-imental standard deviation of the estimated impedance phase,occurring for the measured impedance withhighest P.M.Ramos et al./Measurement42(2009)1370–13791375。
DSP滤波器中英文对照外文翻译文献

中英文对照外文翻译文献(文档含英文原文和中文翻译)译文:GA算法优化IIR滤波器的设计摘要本文提出了运用遗传算法(GA)来优化无限脉冲响应数字滤波器(IIR)的设计。
IIR滤波器本质上是一个递归响应的数字滤波器。
由于IIR 数字滤波器的表面误差通常是非线性的和多峰的,而全局优化技术需要避免局部最小值。
本文提出了启发式方式来设计IIR滤波器。
GA是组合优化问题中一种功能强大的全局优化算法,该论文发现IIR数字滤波器的最佳系数可以通过GA 优化。
该设计提出低通和高通IIR数字滤波器的设计,以提供过渡频带的估计值。
结果发现,所计算出的值比可用于过滤器的在MATLAB设计FDA工具更优化。
举个例子,采用的仿真结果表明在过渡带和均方误差(MSE)的改善。
零极点的位置也被提出来用来描述系统的的稳定性,以便将结果与模拟退火(SA)的方法相比较。
关键词:数字滤波器;无限冲激响应(IIR);遗传算法(GA);优化1.说明在过去的几十年中的数字信号处理(DSP)领域已经成长太重要的理论和技术。
在DSP中,有两个重要的类型系统。
第一类型的系统是执行信号滤波的时域,因此它被称为数字滤波器。
第二类型的系统提供的信号表示频域,被称为频谱分析仪。
数字滤波是DSP的最有力的工具之一。
数字滤波器能够性能规格,最好的同时也是极其困难的,而且不可能的是,先用模拟滤波器实现。
另外,数字滤波器的特性,可以很容易地在软件控制下发生变化。
数字滤波器被分类为有限持续时间脉冲响应(FIR)滤波器或无限持续时间脉冲响应(IIR)滤波器,这取决于该系统的脉冲响应的形式。
在FIR系统中,脉冲响应序列是有限的持续时间,即,它具有非零项的数量有限。
数字无限脉冲响应(IIR)滤波器通常可以提供比其等效有限脉冲响应(FIR)滤波器更好的性能和更少的计算成本,并已成为越来越感兴趣的目标。
但是,由于IIR滤波器的误差表面通常是非线性的,多式联运,传统的基于梯度的设计方法可以很容易地陷入错误的表面。
基于DSP的视频采集与传输外文翻译
淮阴工学院毕业设计(论文)外文资料翻译学院:计算机工程学院专业:通信工程(多媒体)姓名:韩晓晓学号:1101312235外文出处:CollegeofInformationandCommunication Engineering,TianjinPolytechnicUniversity Tianjin 300160, CHN附件: 1.外文资料翻译译文;2.外文原文。
附件1:外文资料翻译译文基于DSP的嵌入式远程视频监控系统设计摘要:本系统提出的是一套基于TMS320DM642的嵌入式远程视频监控系统设计,利用DM642为核心的数据处理,该系统是由视频采集、视频处理和通信模块组成,提供一个实现迷你驱动模块的DSP / BIOS的集成开发环境,并在应用程序层实现一项常见的任务模块。
该系统实现整个模拟视频信号采集,H.264视频编码和网络传输的功能, 它提供了通用连接未来发展并具有良好的灵活性和可扩展性,系统采用了模块化设计和整体开发的编程方法来提高系统的效率。
关键词:DM642;远程监控系统;H.264;视频采集;网络界面1 导言随着科学技术的迅速发展,网络不仅提供了简单的文本、图片和声音文件功能,而且开始提供各种音频和视频来丰富人们的生活,与此同时,监控系统已经从传统发展成智能化,多媒体化和网络化。
传统的监控系统只提供视频监控,多媒体监控系统提供了音频监控,极大地丰富监控的内容,提供实时的网络服务和连续音频流是很有必要的,视频传输应该满足远程实时监控的要求。
TI公司在2003年提供的TMS320DM642 是一款拥有专用视频接口的性能很高的DSP芯片,它有强大的DSP内核和先进的总线结构。
它的频率范围是从480MHZ到720MHZ,在600 MH z主时钟频率数字处理能力可以达到4800 mips,DM642集成各种使视频和图片更方便于实际应用发展的外设。
可以对它进行配置三个视频端口,提供无缝的视频输入接口、视频输出和输入符号流,包括BT. 656, HDTVY/ C,RGB 和MPEG-2输入流,为了基于DM642视频编码器的发展,视频输入只需要一个视频采集芯片,不需要外部的逻辑控制电路和输入/输出缓存器,因此,硬件系统设计及其操作比其他系统更稳定。
DSP外文资料142
Available online at Behavioural Brain Research188(2008)271–280Research reportNeurotoxic effects of DSP-4on the central noradrenergicsystem in male zebrafinchesSusanna A.Waterman a,b,Cheryl F.Harding a,b,∗a Psychology Department,Hunter College,CUNY,New York,NY10016,United Statesb Biopsychology and Behavioral Neuroscience Doctoral Program,Graduate Center,CUNY,New York,NY10016,United StatesReceived25July2007;received in revised form29October2007;accepted11November2007Available online19November2007AbstractWhen administered systemically,the noradrenergic neurotoxin N-(2-chloroethyl)-N-ethyl-2-bromobenzylamine(DSP-4)appears to target the noradrenergic innervation originating in the locus coeruleus causing long-term decrements in noradrenergic function.In songbirds,DSP-4-treatment decreased female-directed singing by males and copulation solicitation responses of females to male songs.However,DSP-4treatment in songbirds did not lower measures of NE function in the brain to the same extent as it does in mammals.The current study had two goals:determining if two DSP-4treatments10days apart would cause significant decrements in noradrenergic function in male zebrafinches and determining if,as in other species,the noradrenergic innervation of midbrain and cortical areas would be profoundly affected while hypothalamic areas were spared. Dopamine--hydroxylase immunoreactivity(DBH-ir)was quantified in thirteen brain regions(five vocal control nuclei,one auditory nucleus,two hypothalamic nuclei,andfive additional areas that demonstrated high DBH labeling in controls).Within20days,DSP-4treatment profoundly reduced the number of DBH-ir cells in both the locus coeruleus and ventral subcoeruleus.Unlike a previous study,DBH labeling delineated four out offive vocal control nuclei and an auditory nucleus.As expected,DSP-4treatment significantly decreased DBH labeling in all areas examined in the mesencephalon and telencephalon without significantly affecting DBH-ir in hypothalamic areas.This double treatment regime appears to be much more effective in decreasing noradrenergic function in songbirds than the single treatment typically used.©2007Elsevier B.V.All rights reserved.Keywords:Songbird;V ocal control;Hypothalamus;Locus coeruleus;Norepinephrine;Dopaine--hydroxylase;Immunoreactivity1.IntroductionNorepinephrine(NE)appears to mediate a heightened state of arousal and attention to changes in the environment and to species-specific stimuli.In response to a novel stimulus,NE neurons in the locus coeruleus(LoC)react as a group with increased activity[56].NE has been implicated in the con-trol of behavior and reproduction[13,16].The LoC may affect reproductive behavior directly through its effects on arousal and attention,e.g.,[47]or indirectly through its modulation of hypothalamic–pituitary–gonadal function[38,52,65].Research also suggests that NE plays a role in some aspects of learn-ing,e.g.,discrimination[31],olfactory learning[18–21,62],and temporal learning[1,36].∗Corresponding author at:Psychology Department,Hunter College,695Park Avenue,New York,NY10065,United States.Tel.:+12127725047;fax:+12126503647.E-mail address:harding@(C.F.Harding).Central NE-producing cell bodies form cell groups that are located in the brainstem.The LoC is the largest of these with the remaining cell groups forming the lateral tegmental system (LT).For the most part,the target areas of the LoC and LT do not overlap.The LoC sends highly collateralized noradrener-gicfibers to the cortex/telencephalon,the cerebellum,and some brain-stem sensory nuclei[56].In both rats and pigeons,LoC projections are the primary source of NE projections to the cor-tex/telencephalon[40,43,44].In general,projections of the LT are restricted to thalamic and hypothalamic brain regions[24].The noradrenergic neurotoxin N-(2-chloroethyl)-N-ethyl-2-bromobenzylamine(DSP-4)is widely used to lower brain NE to investigate the functions of the central noradrenergic system [7,11,12,55,64].When administered systemically in rats,DSP-4 crosses the blood–brain barrier and causes rapid,profound,long-term decreases in NE and markers of noradrenergic function in the cortex but leaves hypothalamic NE function relatively unaltered[39,58].These differential effects on NE function in the cortex and hypothalamus presumably result from DSP-4’s0166-4328/$–see front matter©2007Elsevier B.V.All rights reserved. doi:10.1016/j.bbr.2007.11.004272S.A.Waterman,C.F.Harding/Behavioural Brain Research188(2008)271–280high selectivity for noradrenergic axon terminals that originate in the LoC[33,34,37,39,57,58].Singing in zebrafinches(Taenopygia guttata)is controlled by a series of hormone-sensitive interconnected brain nuclei that are located primarily in the telencephalon and are known collectively as the vocal control system(VCS)[26,51].Only male zebrafinches sing.Barclay and Harding[9,10]found high levels of NE in the male VCS.Hormone treatments which rein-stated high levels of courtship singing in castrates significantly increased levels and turnover of NE in vocal control nuclei (VCN)on the motor pathway controlling the muscles of the syrinx,the avian vocal organ.Data suggest that NE may also be involved in song learning.When we quantified NE func-tion across development in male zebrafinches,NE levels and turnover in brain areas controlling singing showed striking peaks during the sensory acquisition phase of song learning[35].Dur-ing sensory acquisition,juvenile males attend to and memorize the songs of adult tutors[15].The increase in NE function was not seen outside auditory and vocal control nuclei,suggesting that heightened NE function in these areas might be related to song learning.To determine whether NE played a significant role in con-trolling singing behavior in adults,we used DSP-4in an attempt to lower NE levels in the telencephalic vocal control nuclei but leave NE levels in the hypothalamus relatively unaffected.When DSP-4was administered systemically,it produced significant deficits in courtship singing[11].While brain NE levels were not significantly depleted by DSP-4treatment,the nonsignifi-cant decreases in NE levels in three VCN on the motor pathway (interfacial nucleus of the nidopallium—NIf,robust nucleus of the arcopallium—RA,and dorsomedial portion of the intercol-licular nucleus—DM)were positively correlated with decreased frequencies of singing.Since this systemic DSP-4treatment did not significantly lower telencephalic NE levels,in a second study we administered DSP-4centrally via the third ventricle in an attempt to cause greater depletions[12].Central adminis-tration of DSP-4also caused significant deficits in courtship singing and,in addition,significantly depleted NE levels in three VCN(Area X,lateral magnocellular nucleus of the ante-rior nidopallium—lMAN,and NIf).However,NE levels in two hypothalamic nuclei,the magnocellular portion of the paraven-tricular nucleus(PVN)and the preoptic area(POA)were also significantly lowered.In both studies[11,12],the effects on male sexual behavior appeared to be mediated by decreased attentive-ness to females.Males took a longer time before beginning to court,but once they began,their behavior appeared normal.The current study had two goals.We wanted to determine if we could significantly decrease the central NE innervation if birds were given two systemic injections of DSP-4,because a single systemic dose failed to significantly deplete central NE levels in our previous study[11].We also wanted to ver-ify that the hypothalamic NE innervation would be spared as it was previously when we administered DSP-4systemically. To make our results more comparable to work done in rats and other species,e.g.,[3,26,64],we quantified the effects of DSP-4 treatment in male zebrafinch brains using standard immuno-cytochemical procedures to visualize dopamine--hydroxylase (DBH)-containing neurons.DBH is the enzyme that catalyzes the conversion of dopamine to NE,and as such is a good marker of noradrenergic cells.2.Materials and methods2.1.SubjectsAdult zebrafinches were obtained from Canary Bird Farm(Englishtown, NJ).Males and females were treated with ivermectin to reduce parasite infes-tations and housed in separate aviaries until needed.Bird rooms were kept on a14-h light:10-h dark cycle with the temperature controlled(24±2◦C)and the humidity kept over50%to maintain optimal breeding conditions.Birds were fed a vitamin-supplemented(8in1,Pet Products)commercialfinch seed mix,grit,water and cuttlebone ad libitum,supplemented with fresh greens and oranges.During the experiment,males were housed in individual cages(56cm)3 and stimulus females were group housed until needed.All animal care,experi-mental procedures,and euthanasia were carried out in accordance with protocols approved by the Institutional Animal Care and Use Committee of Hunter College of the City University of New York.2.2.DSP-4injectionsThe two drugs used in this study were zimelidine dihydrochloride,a sero-tonergic re-uptake blocker,and DSP-4(generous gifts of Trevor Archer,Astra Pharmaceuticals,Ltd.).Males were randomly assigned to either experimental or control groups.All males received200g,i.p.zimelidine dihydrochloride to protect serotonergic neurons[58].After30min,experimental males(n=8) received500g DSP-4i.p.and controls(n=8)received saline vehicle alone i.p. Administration of DSP-4occurred within10min of drug preparation to prevent the formation of the non-toxic aziridinium derivative[42].These doses were based on the typical rat dosages which are expressed as mg/kg,e.g.,50mg/kg DSP-4[45,66].Since the average weight of ourfinches was10g,our doses were close to the typical rat dosage.This is the dose we have used withfinches in our two previous studies.To maximize noradrenergic depletion,drug treatments were repeated10days later.One hour after the second drug administration,each male was housed with a stimulus female.Our hypothesis was that the two groups would interact differently with the females and this would maximize differences in the availability of DBH between groups.We expected the control males to court the females more frequently,increasing their hormone levels.Increased gonadal steroid levels should stimulate their noradrenergic neurons and,given our prior results,increase NE levels[9,10].We hypothesized that a treatment that increased NE levels should also increase DBH-ir.Ten days later,males were anesthetized,perfused,and their brains processed for immunocytochemistry and cresyl violet staining.2.3.PerfusionMales were mildly anesthetized with a combination of xylazine:ketamine (5g each/g body weight)in0.5ml saline injected into the pectoral mus-cle.Metofane(Pitman-Moore)was administered as necessary to keep birds deeply anesthetized during the procedure.Males were transcardially perfused with0.2M phosphate buffer(PB)followed by4%paraformaldehyde in0.1M PB.Brains were quickly removed and post-fixed in4%paraformaldehyde for 2h.The post-fixing solution was replaced with cryoprotectant(300g sucrose, 10g polyvinyl-pyrrolidone,30ml ethylene glycol,2g sodium azide,volume adjusted to1000ml with0.1M PB)and stored at5◦C.The brains stayed in the cryoprotectant until they sank[14,22].2.4.ImmunocytochemistryBrains were mounted onto frozen cryostat chucks with double-distilled water.Frozen brains were equilibrated in an American Optical Cryo-cut II microtome or an IEC Minotome Plus at−15◦C for an hour,and then sliced into40-m-thick coronal sections.Three series of sections were collected into glass vials containing cryoprotectant.Sections were either stored at−70◦C untilS.A.Waterman,C.F.Harding/Behavioural Brain Research188(2008)271–280273needed or stored at5◦C for immediate immunocytochemical processing.One vial was used for immunocytochemistry.Another vial containing unprocessed tissue was rinsed,sorted,mounted onto gelatin-coated slides and stained with cresyl violet.This set of slides served as a cytoarchitectural reference for the DBH-immunolabeled slides.Sections were processed to optimize DBH staining infinch brains.Unless otherwise stated,all rinses were performed three times for5min each in Buffer A (0.05M tris-buffered saline)while sections were gently agitated.To control for variations in staining intensity,tissues from experimental and control birds were always processed in the same assay.Free-floating sections were treated accord-ing to Bamshad et al.[8]with the following modifications.After pretreatment with0.1%NaBH4for10min in Tris–NaCl,sections were incubated in the fol-lowing solutions:(1)1%H2O2in Tris–NaCl for10min;(2)Tris–Triton rinse for10min;(3)anti-DBH serum(Eugene Tech International,Inc,New York,NY; DBH TE103),1:500in Tris–Triton for24h at5◦C;(4)Tris–Triton rinse.The next steps followed the directions of the Vectastain ABC Elite kit(Vector Labs, Burlingame,CA);(5)incubation with biotinylated anti-rabbit IgG at a dilution of1:600in Tris–Triton for45min at room temperature;(6)two Tris–Triton rinses,then two Tris–NaCl rinses;(7)incubation with ABC reagent diluted in Tris–NaCl for40min;(8)rinsed and treated with DAB peroxidase substrate (SigmaFast3,3 -diaminobenzidine tablet sets)in Tris–NaCl for5min.After the final rinse with Tris–NaCl,sections were sorted and mounted onto gelatin-coated slides.Slides were dehydrated in a graded alcohol series,cleared with xylene and coverslipped with Permount.Adrenergic neurons also contain DBH;however,in rats and birds,adren-ergic neurons are restricted to the medulla[50,60].Since tissues from the medulla were not included in this study,all DBH-positive cells are presumably noradrenergic.2.4.1.Specificity checkThere were two checks for the specificity of DBH-antiserum infinch brains. In the positive control,the antiserum was preadsorbed with an excess of DBH (Sigma)and was used in an assay.In the negative control,incubation with the anti-DBH serum was omitted from the assay.Both specificity checks resulted in DBH-immunonegative tissue.2.5.Image processingSections were examined using a Nikon Optiphot microscope.Images were captured by a Dage MTI CCD72video camera interfaced via a Perceptics Pixel pipeline framegrabber to a MAC2FX computer.Quantification of the density of DBH-ir cell bodies and/orfibers in a given brain area was performed using NIH Image version1.55.Images were sharpened to focus the digitized image. The density slice feature was used for thresholding and adjusted so that only immunopositive cell bodies and/orfibers were quantified.For all measurements, all images which contained a given brain area were captured and measured and the mean per coronal section was then calculated.For each brain area,two calculations were performed.Thefirst measured the area of DBH-ir within the outlined brain area.The brain area of interest in each image was outlined with the freehand selection tool.This outline was saved also for later calculation of percent area labeled.The atlas of Stokes et al.[61]was used as a reference,but areas are designated using the updated avian nomenclature[53].The program was calibrated by measuring lines of known length so that Image could convert the area of labeled pixels in the area of interest into square microns.The second calculation divided the area of DBH-ir in the defined regions by the size of the brain area measured to determine the percentage of each brain area that was labeled(i.e.brain area with thresholding enabled divided by the same brain area without thresholding enabled).Percent area calcula-tions corrected for the possibility that DSP-4treatment altered the size of the nucleus in addition to affecting the area of DBH innervation.This measure-ment also allowed meaningful comparisons between brain areas of different sizes.2.6.Figure preparationSections were examined using a Nikon Eclipse E400microscope and dig-itized using SPOT version3.5.5for Windows(Diagnostic Instruments,Inc.).Images were autobalanced using PhotoShop6.0and labels added in CorelDraw 9.0.2.7.Data analysesDBH-ir cells were counted on a Nikon Optiphot-2microscope(10×power) equipped with a reticle.These data were collected from all sections that con-tained DBH-ir cells.Since only one third of brain sections were processed for DBH,the resulting cell counts were multiplied by three to estimate total DBH-ir cells.All data were analyzed by unpaired Student’s t-tests(GraphPad Prism version4.03for Windows,GraphPad Software,San Diego,California,USA, ).If the variances of the two groups differed significantly, the data were square-root or log transformed prior to analysis.All statisti-cal tests were one-tailed,because we predicted DSP-4would decrease DBH labeling.The LoC was divided into dorsal and ventral sections because these regions may project to different targets[63],and we wanted to determine if DSP-4 had differential effects within the LoC.Previous research in rats[63]based this division on the appearance of the DBH-labeled neurons.Infinches,DBH-labeled cells were categorized on the basis of their position relative to the fasciculus longitudinalis medialis(FLM).At the level of the fourth ventricle,cells located above FLM were classified as dorsal LoC,and cells located lateral to FLM were classified as ventral LoC.Any DBH-ir cells below FLM were classified as ventral subcoeruleus(SCv).3.Results3.1.Noradrenergic cellsIn control birds,the mean estimated total DBH-ir cell num-ber in the LoC was667±30(±S.E.M.)and in the SCv was 616±47.In the LoC,DSP-4treatment significantly decreased the total number of DBH-ir cells compared to saline controls [t(14)=8.993,p=0.0001;see Figs.1and3A].A significant loss of DBH-ir cells occurred in both dorsal LoC[t(14)=6.221, p=0.0001]and in ventral LoC[t(14)=2.169,p=0.0239,see Fig.1].DBH-ir cells in the SCv cell groups were also sig-nificantly decreased in the drug-treated group[t(14)=7.765, Fig.1.Mean(±S.E.M.)estimated DBH-ir cells in locus coeruleus(LoC),ven-tral subcoeruleus(SCv),dorsal LoC,and ventral LoC in saline-treated(SAL)and DSP-4-treated males.Significant decrease in cell numbers compared to saline group,*p<0.05,***p<0.0001.274S.A.Waterman,C.F .Harding /Behavioural Brain Research 188(2008)271–280p =0.0001;see Fig.1].The reductions in cell numbers were quite striking.DSP-4treatment decreased DBH-ir cells in the LoC by 60%,the dorsal LoC by 60%,the ventral LoC by 58%,and the SCv by 80%.DBH-ir cells in the LoC and SCv were arranged differently.Cells in the dorsal LoC were usually tightly clustered while cells in ventral LoC were diffuse,and cells in SCv were even more diffuse.In terms of their morphology,LoC cells were either round or angular while those in the SCv were predominately elongated.In finches,there were clear differences in the intensity of DBH labeling of cell bodies within the LoC and SCv of the saline-treated and drug-treated groups.In controls,some cells were intensely stained while others were very lightly stained.In the drug-treated group,no lightly stained cells were detected in the LoC,and the DBH-ir cells that remained were not tightly clustered.3.2.DBH-ir labeling across brain areasDrug treatment significantly reduced the areas of DBH-ir cells and fibers in the LoC [t (12)=2.593,p =0.0118],and DBH-ir fibers in cerebellum (Cb)[t (12)=7.76,p <0.0001],ventral tegmental area (VTA)[t (11)=2.373,p =0.0185],optic tectum (TeO)[t (12)=2.638,p =0.0108]and septum (S)[t (11)=2.566,p =0.0131;see Figs.2A and 3A–D].DSP-4treatment did not significantly affect the mean area covered by DBH-ir fibers in the two hypothalamic nuclei,PVN and POA (Figs.2A and 3E and F ).In this study,as in our previous research,POA was defined as the area under the septopalliomesencephalic tract (TSM).Other authors have included a much larger area,including this area and its posterior extension located above PVN and directly underthe anterior commissure as the medial preoptic nucleus based on aromatase labeling [6].In comparison to Mello et al.[48],POA as defined here included only the anterior extent of POM,i.e.,the area under TSM.DSP-4treatment significantly decreased DBH-ir label-ing and the mean area covered by DBH-ir fibers in two of the four VCN examined,{high vocal center (HVC)[t (12)=2.64,p =0.0108],robust nucleus of the arcopallium (RA)[t (11)=4.375,p =0.0006],and one auditory nucleus (AN)—dorsal part of the lateral mesencephalic nucleus (MLd)[t (9)=3.27,p <0.005];see Figs.2B,4C–E and 5A and B }.Data from two other VCN just missed being significantly affected by DSP-4treatment {nucleus uvaeformis (Uva)[t (11)=1.773,p =0.0520]and lateral magnocellular nucleus of the anterior nidopallium (lMAN)[t (9)=1.783,p =0.0541];see Figs.2B and 4A and B }.3.3.Percent of each brain area labeled by DBHDSP-4treatment significantly decreased the percent area of DBH-ir labeling in the LoC [t (12)=3.925,p =0.001],Cb [t (12)=7.509,p <0.0001],VTA [t (11)=2.745,p =0.0095],TeO [t (12)=4.328,p =0.0005],S [t (11)=2.636,p =0.0116],(see Fig.2C).The percent area covered by DBH-ir fibers was not significantly affected by drug treatment in the two hypothala-mic nuclei examined;PVN and POA (Fig.2C).In the VCN and AN,DSP-4treatment significantly decreased the percent area of DBH-ir labeling in all nuclei:Uva [t (11)=2.005,p =0.0351],HVC [t (12)=2.757,p =0.0087],RA [t (11)=4.289,p =0.0006],lMAN [t (9)=1.847,p =0.0489],MLd [t (9)=3.115,p =0.0062],(see Fig.2D).Fig.2.Mean area (±S.E.M.)covered by DBH-ir labeling per coronal section of (A)areas outside the vocal control system and (B)vocal control and auditory nuclei.Mean (±S.E.M.)percent of each brain area covered by DBH-ir labeling per coronal section in (C)areas outside the vocal control system and (D)in vocal control and auditory nuclei.Note broken Y axes in A and D.Scale is not linear in A.Significant change compared to saline-treated males,*p <0.05,**p <0.01,***p <0.001.See text for abbreviations.S.A.Waterman,C.F.Harding/Behavioural Brain Research188(2008)271–280275Fig.3.Photomicrographs of DBH ir in areas outside of the vocal control system in male zebrafinch brains.In each pair,the brain on the left is from a saline-treated male,that on the right from a DSP-4-treated male.(A)LoC,(B)VTA,(C)S,(D)Cb,(E)POA and(F)PVN.See text for abbreviations.4.Discussion4.1.Typical effects of DSP-4treatmentThe actions of DSP-4have been most thoroughly documented in rats.In this species,DSP-4treatment causes a rapid,dose-dependent reduction in NE levels and NE-ir which is maximal by 8–16h after treatment[3,26].NE depletion is most pronounced in brain areas innervated by the LoC,including the hippocam-pus,cortex,and olfactory bulb.NE levels in these areas are extremely low following treatment with50mg DSP-4/kg body weight,the dose of DSP-4commonly used in rats.Brain areas like the hypothalamus and basal forebrain that are innervated by the LT are much less affected.[3,26].The neural distribution of DBH-irfibers is affected in a similar fashion following DSP-4 treatment,except that significant decreases in DBH-ir are not seen until4days after treatment with profound decrements by day5[26].In rats,NE cell bodies in the LoC are not affected until several months after treatment[26,30].Typically,there is recovery of NE function over time,with surviving LoC neurons showing strong regenerative responses[30].4.2.Effects of DSP-4treatment on noradrenergic cells and projections infinchesNE levels Infinch brains are approximately ten times higher than those found in comparable brain areas in rats[9].This may account for the inability of a single systemic treatment with the standard rat dose of DSP-4to significantly deplete telen-cephalic NE levels[11].Our current results document that giving birds two systemic injections of DSP-4spaced10days apart is much more effective in decreasing noradrenergic function. This study also confirms,that when administered systemically, DSP-4does not significantly affect noradrenergic function in the hypothalamus.The double DSP-4treatment profoundly decreased the num-ber of DBH-ir cell bodies infinches-by60%in the LoC and 80%in the SCv.This dramatic cell loss occurred within20days of thefirst drug treatment.While control birds had both lightly-and intensely-labeled cells in the LoC and SCv,the DBH-ir cells remaining in DSP-4-treated males were all darkly stained, suggesting that cells showing low levels of DBH-ir are more vulnerable to the neurotoxin.As might be expected from the fact that DSP-4-treated males had fewer DBH-ir cell bodies,they also had fewer DBH-irfibers in most brain areas compared to the saline-treated controls.The differences in DBHfiber staining between the two groups were obvious and in some brain regions could be seen without the aid of a microscope.In general,the distribution of DBH-ir fibers in the saline-treatedfinches formed a clear network of fibers,though the intensity of staining varied from lightly to densely stained.DSP-4-treated males did not have thisfibrous network,and their remaining DBH-irfibers appeared turgid and fragmented.Drug treatment reduced DBH-irfibers in two of the four VCN (HVC and RA)and significantly reduced the percentage tis-sue labeled in all four VCN(HVC,RA,Uva,and lMAN).The VTA has a strong noradrenergic innervation[41],and DSP-4 treatment significantly reducedfiber staining in this area.NE is noted for its modulation of sensory inputs[23],and so it276S.A.Waterman,C.F.Harding/Behavioural Brain Research188(2008)271–280Fig.4.Photomicrographs of DBH-ir labeling in vocal control and auditory nuclei in male zebrafinch brains.In each pair,the brain on the left is from a saline-treated male,that on the right from a DSP-4-treated male.(A)Uva,(B)lMAN and X,(C)HVC,(D)RA and(E)TeO and MLd.See text for abbreviations.Note that in the saline-treated controls,the DBH-ir labeling inside the vocal control nuclei is denser than that in surrounding tissue,except in Area X.There are two issues here. First,there are more aggregations of dense punctate labeling andfibers within the vocal control nuclei compared to surrounding tissue.Second,the background of the VCN is darker than that of the surrounding tissue.This is caused by smaller,lighter puncta of DBH ir,making the vocal control areas in the DSP-4-treated birds darker than the surrounding tissue.DSP-4treatment significantly lowered,but did not eliminate DBH-ir.The VCN in DSP-4-treated birds stand out because they still have more DBH-ir than the surround.For the most part,tissue from DSP-4-treated birds lacks the densefibers and puncta seen in controls.This can be seen in higher magnification in Fig.5.The arrows in HVC and the asterisks in lMAN in thisfigure correspond to those in these areas in Fig.5.S.A.Waterman,C.F.Harding/Behavioural Brain Research188(2008)271–280277Fig.5.Higher magnification of DBH-ir labeling in the sections of HVC and lMAN shown in Fig.4.In each pair,the brain on the left is from a saline-treated male,that on the right from a DSP-4-treated male.The arrows in HVC and the asterisks in lMAN in thisfigure correspond to those in these areas in Fig.4.Note how the pattern and density of DBH-ir labeling over lMAN in the control bird is different from that outside the nucleus.This is particularly clear in comparison to the area below lMAN.If you refer back to Fig.4,you can see that the arrow in HVC in the control bird points to an area of dense labeling on the ventral border of the nucleus.It is clear at higher magnification that no labeling below the arrow matches the aggregations of high density DBH-ir labeling seen within HVC.was not surprising that DSP-4treatment significantly decreased DBH labeling in the primary visual(TeO)and auditory pro-cessing areas(MLd).Noradrenergic modulation of these brain areas may be related to birds’attentiveness to conspecifics.DSP-4treatment has been shown to decrease the responsiveness of malefinches to females placed in their home cages[11,12]and the responsiveness of female canaries to the songs of conspe-cific males[2].DSP-4treatment also decreased DBH ir in the Cb and S.In rats,both areas are innervated by and their func-tion modulated by the LoC[24].However,fiber labeling in the two hypothalamic nuclei,PVN and POA,was not significantly affected by drug treatment.4.3.Most VCN receive stronger noradrenergic innervation than surrounding tissueIn control birds,DBH labeling clearly delineated all VCN examined from surrounding tissue except for Area X.In most birds,there was a denser network of darkly stained DBH-ir inside MLd,Uva,HVC,RA and lMAN than there was in the surround-ing tissue.This striking labeling of the vocal control nuclei was not observed by Mello et al.,except in DM[48].Four method-ological differences might account for discrepancies in DBH labeling between the two studies.First,the concentration of anti-body used in our study was double that used by Mello et al.[48]. However,if the staining differences were attributable only to the stronger antibody concentration,then one would expect an over-all increase in staining intensity across all brain areas,which was not the case.Second,Mello et al.performed their assay on slide-mounted tissue,not free-floating sections.The free-floating sections used in our study provided two surfaces and increased the opportunity for the antibody to bind to available antigens.Third,Mello et ed sagittal sections to examine many brain areas.Our study used only coronal sections.The orientation offibers(cross-sections versus tracts)may also have contributed to the observed differences in bothfiber density and innervation.Finally,all males in our study were housed with females to maximize neurochemical differences between treat-ment groups.These males were given the opportunity to court and mate with females for10days prior to sacrifice.Since our prior studies suggested that high levels of singing behavior were correlated with high levels of NE in the motor pathway control-ling singing[11],we expected that housing with females would increase levels of DBH in the saline-treated males,maximizing differences between treatment groups.Although we previously found that levels of NE in NIf were higher than those in two other telencephalic vocal control nuclei, HVC and RA[10,11],NIf was not strongly labeled by DBH-ir in these brains,so we did not quantify labeling in this vocal control nucleus.4.4.Mismatch between DBH-ir labeling and other noradrenergic markers in Area XDespite the fact that we consistently found moderate to high levels of NE in Area X in previous studies[9–12,35],like Mello et al.,[48]we found few if any DBH-irfibers in Area X and the surrounding medial striatum.Area X is very large and highly vis-ible making it easy to accurately microdissect.Although DBH labeling was very limited or absent within and around Area X, significant levels of␣2-adrenergic receptors were found in Area X in both zebrafinches[54]and starlings[5].A recent study[17] documented the existence of projections from both the LoC and SCv to Area X infinches.The mismatch between the existence of these projections,high NE levels,and significant levels of␣2-adrenergic receptors yet the lack of significant levels of DBH-ir fibers remains to be explained.parison of DSP-4’s effects across speciesIn saline-treatedfinches,the estimate of total LoC DBH-ir cell numbers(667±30,mean±S.E.M.)were much lower than the1300reported in Japanese quail and in chickens[4,49] and the2900reported in albino rats[63].Our estimates were based on counting every DBH-ir cell found in every third section through the LoC.While counting cells in every section is clearly。
DSP外文资料130
Fusion Engineering and Design43(1999)401–405Multiple DSP system for real time parallel processing and feedback control on fusion experimentsA.P.Rodrigues a,*,C.M.B Correia a,C.A.F.Varandas a,F.Schneider ba Associac¸a˜o EURATOM/IST,Centro de Fusa˜o Nuclear Instituto Superior Te´cnico,1096Lisboa Codex,Portugalb Association EURATOM/IPP,Max-Planck-Institut fuer Plasmaphysik,D-85748Garching,GermanyAbstractThis paper describes a specially designed system for real time parallel processing and feedback control on fusion experiments.The system is being implemented in PCI and VME modules,based on an array of four synchronizable DSPs,with1Mbyte of global RAM,12bits resolution,four analog inputs with sampling frequency up to40MSPS, two analog or waveform generator outputs with an update rate up to100MSPS,eight digital opto-coupled inputs/outputs and one external global trigger optical input.The user interface appears as a virtual instrument from LabView for Windows.©1999Elsevier Science S.A.All rights reserved.Keywords:Synchronizable DSP;Waveform generator outputs;Virtual instrument1.IntroductionFuture plasma experiments will put even more stringent requirements on real time data process-ing than present ones do.The increased plasma duration,together with higher time resolution, require sophisticated data pre-selection and com-pression.Detailed plasma parameter control de-mands optimum feedback procedures using adaptive methods.The real time compensation for the system’s inherent noise requires feed forward control using convolution methods.The usual data acquisition process in the time domain will lead to a very large increase in the amount of data to be stored,particularly if the correlation of many MHD signals has to be stud-ied.The amount of data can be reduced in this case if,for instance,real time complex FFT is applied and only the peaks of the spectra are stored.FFT can also be applied to analyse the stability of feedback loops during the operation of the experiment.The control and data acquisition systems of the next generation fusion devices must be based on intelligent mercial DSP based systems most probably cannot be used be-cause they have been designed for audio and video processing and the plasma diagnostic and feedback control requirements are much different. The signal range,speed and number of channels have to be increased.This paper describes a specially designed system for real time parallel processing and feedback*Corresponding author.Fax:+35118417814;e-mail:cvarandas@cfn.ist.utl.pt0920-3796/99/$-see front matter©1999Elsevier Science S.A.All rights reserved. PII S0920-3796(98)00410-4A.P.Rodrigues et al./Fusion Engineering and Design43(1999)401–405 402Fig.1.The architecture.control on fusion experiments,based on an arrayof four synchronizable DSPs.Section2presentsthe main technical characteristics of the system aswell as a brief description of its architecture.Section3describes the hardware implementationand Section4suggests some applications of thissystem.2.Main characteristics and architectureThe hardware,implemented in PCI and VMEmodules,has four DSPs(TI TMS320C44)thatcan deliver up to40MIPS/80MFLOPS each,1Mbyte of global RAM,12bits resolution,four 910V analog inputs with anti-aliasingfilters and sampling frequency up to40MSPS,two910Vanalog or two waveform generator outputs withan update rate up to100MSPS,eight digitalopto-coupled inputs/outputs and one externalglobal trigger optical input.The architecture(Fig.1)is based on an array of four synchronisable DSPs,communicating among them by the global bus and the three parallel ports that link a DSP to the other three.Two DSPs are mainly dedicated to data processing. The others are mainly affected to running control algorithms.The acquisition and waveform genera-tor blocks can operate in stand-alone mode,con-trolled by high density PLD devices.The configuration of the module and communications with the host PC are performed by one DSP. The user interface appears as a virtual instru-ment from LabView for Windows,allowing easy remote operation.3.The hardwareThefirst version of the hardware is being imple-mented in a personal computer(PC)embedded module with PCI bus interface as target.All the communication between the module and the PC is made through a FIFO memory.A.P.Rodrigues et al./Fusion Engineering and Design43(1999)401–405403Fig.2.Main schematic.The overall configuration of the module as well as all the communication with the PC is per-formed by the DSP0.This component is responsi-ble for the program download for each DSP, including itself.This DSP is the only one that can access the DAC1block(Fig.2).All the DSPs can communicate[1]between them in two ways.Thefirst one is through the global bus,because they share the global RAM, and the second one is through the three parallel communication ports that link each DSP to the other three,as shown in Fig. 2.This feature enables the module to execute,if necessary,real parallel processing[2,3].Each DSP has an additional not shared128kB of SRAM for its own operation(data,program, and stack purposes,in what concerns DSP1).DSP0has an additional64kB of EPROM for start up module purposes.Each ADC channel can deliver the data in a continuous mode to a biport RAM which can be accessed simultaneously with the acquisition by a specific DSP(depending on the biport RAM, Figs.1and2).This feature gives the possibility of processing the acquired data(with digital signal processing algorithms[4])while acquiring,with-out the need of data transfer to another RAM. Between each ADC channel and the biport RAM there is a configurable PLD that enables the data to be delivered where and how needed.For in-stance,it is possible to deliver the data of ADC0 as a32bit word in the biport RAM belonging to the DSP2block,or in another way,the data of ADC0and ADC1can be delivered at the sameA.P.Rodrigues et al./Fusion Engineering and Design43(1999)401–405404Fig.3.Real time suppression of noise from thyristor power amplifiers in W7AS diagnostics.time in the biport RAM of DSP2block.The lower significant16bits belong to ADC0and the upper significant16bits belong to the ADC1. This feature is very useful when calculating FFT and cross-correlation algorithms[5]. Alternatively,each ADC channel can be read by any of the four DSPs in an asynchronous mode through the global data bus and the PLD that manages the acquisition.The direct connection to the DAC0channel enables the DSP1to run high speed feedback control algorithms[6,7].DSP0is also able to run control algorithms,because it has a direct connec-tion to the DAC1channel,but since this DSP is also the module manager it may not be able to run control algorithms as fast as the DSP1. Both DAC channels have FIFO memory so they can perform the function of complex wave-form generation,and can run in stand alone mode.There are two bi-directional external ports asso-ciated with each DSP for general purposes,for instance,to receive or send external trigger signals.There is one external optical input port to synchronise all the DSPs if needed.The global bus arbiter,the interrupt controller, the acquisition controller and the function genera-tor controller,as well all the registers that configure the module are implemented on PLD devices.4.ApplicationsThis system will befirstly tested on the real timeA.P.Rodrigues et al./Fusion Engineering and Design43(1999)401–405405suppression of noise due to thyristor power supplies in the W7AS diamagnetic loop diagnostic(Fig.3). In thefirst step the linear transfer function from the thyristor power converter-voltage or coil-cur-rent to the diamagnetic loop has to be determined by frequency response measurements(Fig.3upper part).This transfer function influenced and delayed by the magneticfield penetration into the compli-cated mechanical structure and vacuum vessel has to be analyzed in detail via the DSP circuits.The inverse Fourier-transform of the frequency re-sponse is the dirac-pulse-response which can be calculated afterwards in the PC by a high level language(LabView).In a second step(Fig.3lower part)the DSP’s can do real-time convolution of the signals Sn(t)with the related dirac-pulse-responses and add them in opposite polarity to the diagnostic signal.If this operation is applied to every thyristor power con-verter,the resulting signal D(t)is cleaned of this sort of noise.The correct operation can be tested by another DSP for cross-correlation D(t)to Sn(t), which should be zero.Other applications could be related with adaptive high speed PID control,feed forward control, controlled waveform generation,event detection with trigger generation and other real-time cross-correlation measurements.AcknowledgementsThis work has been carried out in the frame of the Contract of Association between the European Atomic Energy Community and‘Instituto Superior Te´cnico’and has also receivedfinancial support from‘Junta Nacional de Investigac¸a˜o Cientı´fica e Tecnolo´gica’(JNICT).References[1]TMS320C4X General Purpose Applications User’s Guide(Literature number from Texas Instruments SPRU159).[2]TMS320C4X Parallel Processing Development SystemTechnical Reference(Literature number from Texas In-struments SPRU075).[3]Parallel Processing with the TMS320C4X(Literature num-ber from Texas Instruments SPRU031).[4]A.V.Oppenheim,R.W.Schafer,Digital Signal Processing,Prentice-Hall,Eaglewood Cliffs,NJ,1988.[5]P.E.Papamichalis, C.S.Burrus,Conversion of digit-re-versed to bit-reversed order in FFT algorithms,Proceed-ings of ICASSO89,USA,May1989,pp.984–987. [6]I.Ahmed,Implementation of Self Tuning Regulators withTMS320Family of Digital Signal Processors,MOTOR-CON’88,September1988,pp.248–262.[7]I.Ahmed,S.Lindquist,Digital signal processors:simplify-ing high-performance control,Mach.Des.,September 1987...。
- 1、下载文档前请自行甄别文档内容的完整性,平台不提供额外的编辑、内容补充、找答案等附加服务。
- 2、"仅部分预览"的文档,不可在线预览部分如存在完整性等问题,可反馈申请退款(可完整预览的文档不适用该条件!)。
- 3、如文档侵犯您的权益,请联系客服反馈,我们会尽快为您处理(人工客服工作时间:9:00-18:30)。
DSP toxin production de novo in cultures of Dinophysis acuminata (Dinophyceae)from North AmericaJeremiah D.Hackett a,Mengmeng Tong b,c,David M.Kulis c,Elie Fux d,Philipp Hess d,Ronel Bire d,Donald M.Anderson c,*a Department of Ecology and Evolutionary Biology,University of Arizona,Tucson,AZ85719,USAb College of Environmental Science and Engineering,Nankai University,Tianjin300071,Chinac Biology Department,Woods Hole Oceanographic Institution,Woods Hole,MA02543,USAd Marine Institute,Rinville,Oranmore,Co.Galway,Ireland1.IntroductionThe dinoflagellate genus Dinophysis is interesting from bothecological and evolutionary perspectives.Some members of thisgenus are responsible for diarrhetic shellfish poisoning(DSP)—asyndrome associated with human consumption of shellfish thathave accumulated Dinophysis toxins,and less frequently,toxinsfrom Prorocentrum lima(Lawrence et al.,2000).DSP is a majorpublic health and economic problem for many countries(Lee et al.,1989;Boni et al.,1993;Giacobbe et al.,2000)and is among themost important and widely distributed of the harmful algal bloom(HAB)associated poisoning syndromes(Van Dolah,2000).Thediarrhetic shellfish toxins(DTXs)are a class of polyethercompounds with at least eight congeners and the parentcompound,okadaic acid(OA).OA,DTX1,and DTX2are theprimary toxins involved in poisonings,with others believed to beeither precursors or shellfish metabolites of the toxins.The DTXsare inhibitors of serine/threonine protein phosphatases and,wheningested by humans,cause rapid onset of gastrointestinalsymptoms(vomiting and diarrhea)lasting several days.On a global scale,DSP is widespread,documented in WesternEurope,East and Southeast Asia,South America,South Africa,NewZealand and Australia.The situation in North America isparticularly interesting since DSP toxins have only rarely beendetected in North America despite years of testing of shellfish andplankton tows by many investigators.Two events in Canada wereattributed to the benthic dinoflagellate,P.lima,found inassociation withfilamentous algae growing on raft cultures ofmussels(Quilliam et al.,1993;Lawrence et al.,2000).OA wasdetected in cultures of P.lima isolated from the Gulf of MaineHarmful Algae8(2009)873–879A R T I C L E I N F OArticle history:Received7January2009Received in revised form14April2009Accepted14April2009Keywords:DinophysisDiarrhetic shellfish poisioning(DSP)Okadaic acidA B S T R A C TFor decades,many aspects of Dinophysis biology have remained intractable due to our inability tomaintain these organisms in laboratory cultures.Recent breakthroughs in culture methods have openedthe door for detailed investigations of these important algae.Here,for thefirst time,we demonstratetoxin production in cultures of North American Dinophysis acuminata,isolated from Woods Hole,MA.Thesefindings show that,despite the rarity of Dinophysis-related DSP events in North America,D.acuminata from this area has the ability to produce DSP toxins just as it does in other parts of the worldwhere this species is a major cause of DSP toxicity.In our cultures,D.acuminata cells were observedfeeding on Myrionecta rubra using a peduncle.Culture extracts were analyzed using LC–MS/MS,providing unequivocal evidence for the toxin DTX1in the Dinophysis cultures.In addition,a significantamount of an okadaic acid diol ester,OA-D8,was detected.These results suggest that this Dinophysisisolate stores much of its OA as a diol ester.Also,toxin PTX-2and a hydroxylated PTX-2with identicalfragmentation mass spectrum to that of PTX-11,but with a different retention time,were detected in thisD.acuminata culture.This demonstration of toxin production in cultured North American Dinophysis setsthe stage for more detailed studies investigating the causes of geographic differences in toxicity.It is nowclear that North American Dinophysis have the ability to produce DSP toxins even though they only rarelycause toxic DSP events in nature.This may reflect environmental conditions that might induce or represstoxin production,genetic differences that cause modifications in toxin gene expression,or physiologicaland biochemical differences in prey species.ß2009Elsevier B.V.All rights reserved.*Corresponding author at:Biology Department,Woods Hole OceanographicInstitution,Redfield3-32,MS#32,Woods Hole,MA02543,USA.Tel.:+15082892351;fax:+15084572134.E-mail address:danderson@(D.M.Anderson).Contents lists available at ScienceDirectHarmful Algaej o u r n a l h om e pa g e:w w w.e l s e v i e r.c o m/l o ca t e/ha l1568-9883/$–see front matterß2009Elsevier B.V.All rights reserved.doi:10.1016/j.hal.2009.04.004(Morton et al.,1999;Maranda et al.,2007),and in2002,LC–MS analysis for OA revealed low concentrations of the toxin in plankton net tow material during an extremely dense bloom of Dinophysis acuminata in the Chesapeake Bay(Tango et al.,2002). Dickey et al.(1992)detected okadaic acid in oysters in the northern Gulf of Mexico in1990.The most significant DSP event attributed to Dinophysis sp.in North American shellfish occurred in2008in Southern Texas(Texas Department of State Heath Services news release,March7th2008).This very low level of DSP toxin in North America is noteworthy even though the Dinophysis species known to be toxic elsewhere (e.g.,D.fortii,D.acuminata,D.caudata,D.norvegica,and D.acuta), have all been observed in high abundance in US and Canadian waters(Marshall,1996;Rehnstam-Holm et al.,2002).The reasons for this remarkable geographic disparity in toxicity remain unresolved,but could reflect genotypic heterogeneity among strains of Dinophysis,or,given recentfindings about feeding and culturing(Park et al.,2006),differential toxin synthesis might be due to the variability in cryptophyte and ciliate prey.We have isolated D.acuminata from Eel Pond in Woods Hole, MA and established cultures grown on Myrionecta rubra and its cryptophyte prey to investigate toxin production in North American Dinophysis species.Here we report thefirst description of toxin production in a North American culture of Dinophysis.2.Materials and methods2.1.Culture methodsA unialgal(but not clonal)culture of D.acuminata was established from Eel Pond,Woods Hole,MA in September of2006 by isolating cells from a water sample into individual wells of a 48well tissue culture plate.These cells were cultured using a two-step feeding system described by Park et al.(2006)where the cryptophyte,Geminigera cryophyla(CCMP2564),is fed to the ciliate,M.rubra(CCMP2563),which is in turn fed to D.acuminata (DAEP01).All three cultures were maintained in modified f/2-Si medium(Anderson et al.,1994)at38C on a14:10h L:D cycle(ca.100m mol photons mÀ2sÀ1irradiance provided by cool whitefluorescent bulbs).Borosilicate glass culture tubes (25mmÂ150mm)containing25mL medium were used.When the cell density of the cryptophyte exceeded500,000cells mLÀ1it was used as food for M.rubra by combining2mL of G.cryophyla with 3mL M.rubra in20mL f/2medium.Following complete consump-tion of the cryptophyte cells by M.rubra,the ciliate was fed to D. acuminata by adding3mL M.rubra($14,000cells mLÀ1)with2mL D.acuminata($1800cells mLÀ1)in20mL f/2medium.Weekly cell counts and observations on D.acuminata DAEP01were conducted on samples preserved in Utermo¨hls solution(Utermo¨hl,1958)and examined microscopically at100Âusing a Sedgwick Rafter counting chamber.Additional Myrionecta culture was added to the D. acuminata cultures when the Myrionecta/Dinophysis cell ratio fell to less than1:1.Cultures of D.acuminata were transferred when the cell density exceeded1800cells mLÀ1and maximum cell densities greater than7000cells mLÀ1could be easily achieved by these techniques.The SSU rDNA gene was amplified by PCR from D.acuminata DAEP01using primers CrN1f and BR as previously described(Hoef-Emden et al.,2002).The PCR products were sequenced on both strands using an ABI3730sequencer and deposited in GenBank (accession FJ869120).The D.acuminata SSU rDNA sequence was aligned with homologues from other dinoflagellates using BioEdit (/BioEdit/bioedit.html).The alignment was used to construct a minimum evolution tree using the Kimura 2-parameter correction with500bootstrap replicates in Phylip (Felsenstein,2004,Fig.1B).The D.acuminata culture for toxin analysis was grown under high light(300m mol photons mÀ2sÀ1)in a Fernbachflask containing1300mL of f/2-Si medium at48C.The initial cell density of M.rubra,CCMP2563,and D.acuminata,DAEP01,was calculated to be2000and100cells mLÀ1,respectively.A sample for toxin analysis was collected from this culture during the late exponential/early stationary phase where120mL of culture was passed through a20m m Nitex sieve to collect the Dinophysis cells. At this point in the growth cycle,all of the Myrionecta cells had been eaten,thus,none were contained in the harvested aliquot. The material caught on the sieve was backwashed into a pre-weighed15mL centrifuge tube and duplicate,200m L aliquots for cell counts were dispensed from the well-mixed sample into separate microcentrifuge tubes containing1mL volumes of filtered seawater and5%formalin.The15mL tube was weighed again and centrifuged at3000Âg for5min.The medium overlying the resulting cell pellet was carefully aspirated so that a minimal volume(<250m L)was remaining above the cell pellets. The samples wereflash frozen and stored in liquid nitrogen,and later shipped on dry ice for toxin analysis.There were approximately236,000cells in the cell pellet as determined by averaging the toxin cell counts and multiplying this value by the total volume within the15mL centrifuge tube.Control cultures of M.rubra and G.cryophyla were grown as described above, harvested via centrifugation(3000Âg,5min),and assayed for toxins as well.The M.rubra cell pellets contained256,800cells while1,000,000cells were concentrated for the G.cryophyla cellpellets.Fig.1.(A)Light micrograph of D.acuminata(DAEP01)cells(scale bar=10m m).(B) Minimum evolution tree of Dinophysis sp.Numbers above the branches are the results of500bootstrap replicates.J.D.Hackett et al./Harmful Algae8(2009)873–879 8742.2.Toxin extractionAt the Irish Marine Institute in Galway(MI),the cell pellet was thawed at room temperature and200m L of methanol was added. The sample was sonicated(Ultrasonic Bath,Branson5510,The Netherlands)for15min and then centrifuged at4200Âg for 5min.The supernatant was transferred to a spinfilter(0.2m m) and centrifuged at13,000Âg for5min using a microcentrifuge.A high recovery LC vial was used to collect thefiltrate and this extraction procedure was repeated another three times to ensurecomplete extraction efficiency.The extracts were evaporated to dryness on a heating block at408C under a stream of nitrogen and the residues were resuspended in1mL of methanol for LC–MS/MS analysis.2.3.Analyses using LC–MS/MS hybrid Quadrupole:Time ofFlight Mass SpectrometerThe LC–MS/MS analyses were conducted using a2795Waters HPLC coupled to a Micromass Ultima(Waters Micromass) quadrupole–time offlight hybrid(QTOF)equipped with a z-spray ESI source.The QTOF was used in TOF-MS/MS mode,where the molecular ion(for OA toxins)and ammonium adduct(PTXs)were isolated in the quadrupole and where after collision in the collision cell,the whole fragmentation spectrum was obtained in the TOF. OA,DTX1and DTX2were analyzed in negative ionization(ESÀ). Accurate mass data was acquired on the instrument operated in W-mode.Glu-Fib(or Leucin)solution(accurate mass: 785.8426Da)was infused into a dual-lockspray source for in situ calibration of the instrument.Fragment ions of Glu-Fib(m/z 684.3579and333.1881)were used for the calibration of the entire mass range for fragment ion analysis.This system used a binary mobile phase,with both A and B each containing2mM ammonium formate and50mM formic acid. Phase A was100%aqueous while phase B consisted of95%aqueous acetonitrile.A volume of50m L was injected using a switching valve that allowed the injection of large volumes.The chromato-graphic method was adapted from Hardstaff et al.(2006)and was reported in detail for the analysis of azaspiracids in shellfish extracts(Vale et al.,2008).The toxins werefirst concentrated on an OASIS HLB column(20mmÂ2.1mm;5m m)and subsequently backwashed and separated on a BDS Hypersil C8(150mmÂ1mm;3m m)using the gradient described in Table1.Accurate mass of DTX1was measured on a standard(not certified)obtained from Bluebiotek(Germany).2.4.LC–MS/MS analysis using triple quadrupole mass spectrometer: OA and DTX analysisLC–MS/MS analyses were performed using a2695Waters HPLC coupled to a Quattro Ultima triple quadrupole(TQ)(Waters Micromass)with separation being achieved on a C8Hypersil column(50mmÂ2.1mm;3.5m m particle size)maintained at 258C.Theflow rate was set at0.25mL/min and a volume of5m L was injected.Binary mobile phase was used,with phase A(100% aqueous)and phase B(95%aqueous acetonitrile),both containing 2mM ammonium formate and50mM formic acid.A gradient elution was employed,starting with30%B,rising to90%B over 8min,held for0.5min,then decreased to30%B in0.5min and held for3min to equilibrate at initial conditions before the next run started.Quantitation was performed by LC–MS/MS using the molecular ion or the ammonium adduct as precursor ions(Table2). The diol ester derivative of OA,OA-D8,was not quantified but a reference solution kindly provided by M.Quilliam was used to confirm the presence of the toxin.A set of OA standards(7levels) were used for the quantification of OA and DTX1and were prepared using the NRC OA certified reference material(CRM-OA-b).An internal laboratory reference material prepared from mussels Mytilus edulis and containing OA,DTX1and DTX2was extracted with MeOH(2g extracted in25mL)and used for the comparison of the retention times.2.5.PTX analysisAn Ultra Performance Liquid Chromatography(UPLC)method was used for the quantification of PTXs.UPLC–MS/MS analyses were performed using a Waters Acquity system coupled to a Quattro Ultima TQ(Waters Micromass).Separation was achieved on a C8BEH Acquity column(50mmÂ2.0mm;1.7m m particle size)maintained at308C.Theflow rate was set at0.4mL/min and a volume of5m L was injected.Binary mobile phase was used,with phase A(100%aqueous)and phase B(95%aqueous acetonitrile), both containing2mM ammonium formate and50mM formic acid.A gradient elution was employed,starting with30%B,rising to90%B over10min,held for0.5min,then decreased to30%B in0.1min and held for2.4min to equilibrate at initial conditions before the next run started.Quantitation of PTX-2,PTX-11and PTX-2sa was performed by LC–MS/MS using the ammonium adduct as precursor ions(Table2)as described previously(Fux et al., 2007).A reference solution of PTX-11was kindly obtained from C. Miles.PTX-11and PTX-2sa were quantified against certified standard of PTX-2from the NRC,Canada.3.ResultsCells isolated from Eel Pond(DAEP01)were identified as D. acuminata using morphology and SSU rDNA sequence similarity (Fig.1).The SSU rDNA sequence from our strain is identical to the SSU rDNA sequence from D.acuminata isolated from Norway (Genbank accession AJ506972)and had one nucleotide difference with a D.acuminata isolate from Narragansett Bay,RI,USA (EU130569).Our sequence was different at nine nucleotides compared to the SSU sequence of a Japanese isolate.In phylogenetic analyses,our strain was included in a highly supported clade with other D.acuminata isolates(Fig.1B).We were unable to isolate co-occurring Myrionecta sp.or Geminigera sp.,so cultures isolated from the Ross Sea(Gustafson et al.,2000)were purchased from the Provasoli-Guillard Culture Collection for Marine Phytoplankton(CCMP)and used as theTable1Gradient conditions used for the LC–MS/MS analysis of the cell extract.Time(min)A%B%Flow(mL/min)0.0090100.2002.0090100.2002.0190100.0202.0590100.0752.5070300.07512.5001000.07530.5001000.07531.0070300.07540.0070300.075Table2Transitions used for LC–MS/MS analysis.Precursor ion Precursor mass Fragment massOA[M–H]À803.5255.5DTX1[M–H]À817.5255.5OA-D8[M+NH4]+946.5751.5PTX-2[M+NH4]+876.5823.5PTX-11[M+NH4]+892.5839.5PTX-2sa[M+NH4]+894.5823.5J.D.Hackett et al./Harmful Algae8(2009)873–879875Dinophysis food source.The Eel Pond D.acuminata cells are able to tolerate the low temperatures (38C)required to maintain these strains of Myrionecta and Geminigera while growing at rates of $0.1divisions day À1.At 108C,Dinophysis achieves a growth rate of $0.34divisions day À1,however,at this temperature,most Myr-ionecta appear to die before being consumed by D.acuminata .At either temperature,cell densities >7000mL À1can be routinely obtained using the feeding regimen described above.D.acuminata cells were observed feeding on M.rubra using a peduncle as described in Park et al.(2006).Chemical analyses of the DSP toxins were initially performed using a large-volume injection system.OA and DTX1were detected (retention times 19.03and 20.43min,respectively)and their QTOF fragmentation spectra matched the standards and reference compounds of DTX1(Fig.2)and OA (data not shown).The ion ratio in the Dinophysis sample was compared for parent and fragment ion,817.8and 255.2,respectively,and found to be within 2.5%of the ratio of the DTX1standard.Additionally,the molecular ion masses of DTX1in the standard and DTX1in the sample werecompared and found to be within acceptance criteria for accurate mass measurement (less than 5ppm difference,Fig.3).The retention time and the fragmentation spectrum of OA contained in the cells were identical to those of the OA standard.However,the low concentration of OA in the sample did not allow for accurate mass measurement to be performed.LC–MS/MS analyses of the cell extract using the TQ showed the presence of a peak of OA (8.77min)and DTX1(10.27min,Fig.4).The concentration of OA detected in our samples was 18.0fg cell À1whereas DTX1concentration was 203.3fg cell À1.Additionally,the presence of a diol ester of OA,OA-D8,was confirmed by comparison to a reference standard.The amount of OA-D8was not quantified because no standards were available for this compound.However,the signal intensity revealed that a significant amount of OA-D8was present in the cells.The polyether-lactone,PTX-2,was found at a concentration of 20.40pg cell À1.The degradation product of PTX-2,PTX-2seco-acid (PTX-2sa)was quantified at 76.88fg cell À1and its more thermodynamically stable epimeric confirmation,7-epi-PTX seco-acid was witnessed but not quantified.PTX-11was not detected in the D.acuminata cells.However,the PTX-11transition trace (Table 2)that was set on the UPLC–MS/MS method allowed for the detection of one compound in the sample that eluted before PTX-11from the reference solution.Quantitation of the analog performed against PTX-2standards indicated a concentration of 731.6fg cell À1.Analysis on the QTOF system allowed for the comparison of the fragmentation of PTX-11and the compound detected in D.acuminata (data not shown).It appeared that the compound observed in the culture of D.acuminata is an isomer of PTX-11likely to be a previously unreported hydroxylated PTX-2analog.More detailed information on this will be reported separately.Cultures of Geminigera and Myrionecta were analyzed for OA and PTX compounds.No toxins were detected in the control cultures confirming that the toxin is clearly produced by Dinophysis .4.DiscussionWe report here the first description and unequivocal evidence of diarrhetic shellfish poisoning toxin production in cultured North American Dinophysis .These findings indicate that this suite of cultures can now be used to study toxin production intheseFig.2.Example of chromatogram obtained by large-volume injection with Hybrid Quadrupole:Time of Flight Mass Spectrometer:(A)Laboratory Reference Material Chromatogram and (B)chromatogram of cultured Dinophysis cells,strain,DAEP01.Fig.3.High resolution fragmentation spectrum of the molecular ion of DTX1[M ÀH]À(817.5)obtained by LC–MS/MS Quadrupole/Time of Flight Mass Spectrometer from (A)the DTX1standard (BlueBiotech)and (B)the cell extract DAEP011-4with a collision energy of 50V.J.D.Hackett et al./Harmful Algae 8(2009)873–879876organisms,and in particular,the reasons behind the dramatic differences in toxicity between geographically separated strains of Dinophysis .Initial trials on the chemical analysis of the cultured Dinophysis were carried out in order to establish if the culture is capable of producing DSP toxins.Confirmation of DTX1and OA production in the Dinophysis sample is based on the comparison of the corresponding spectra with those of the OA and DTX1standards.Additional evidences for DTX1were obtained by LC–MS/MS using a QTOF instrument equipped with a switching valve and included:(1)retention time in 2-dimensional chromatography (<0.05min shift);(2)mass spectral comparison through ion ratios (<2.5%difference);and (3)mass spectral comparison through mass accuracy (<5ppm).The exact mass of OA in the Dinophysis sample was not measured due to its low concentration.Quantitation of the samples was then performed by LC–MS/MS using the TQ system,which allowed for the analyses with higher sensitivity,wider linearity range and the capabilities of monitoring compounds in positive (OA-D8)and negative (OA and DTX1)in a single analytical run.The DTX1and OA concentrations in the Woods Hole D.acuminata were approximately 203and 18fg cell À1,respectively.These are at the low end of toxin content measure-ments for D.acuminata ,which range from 100fg cell À1(Yasumoto,1985)to 158pg cell À1(Marcaillou et al.,2005)for DTX1and 0.1–2.7pg cell À1for OA (MacKenzie et al.,2005).In the only other documented account of DSP toxins in cultured Dinophysis ,Kamiyama and Suzuki (2008)found that their D.acuminata isolated from Kesennuma Bay,Japan produced 2.5–4.8pg cell À1of DTX1,14.7–14.8pg cell À1of PTX-2and undetectable amount of OA.These cultures were grown in a manner similar to the culture described here,however,they utilized prey and Dinophysis species isolated from Japanese waters and the cultures were incubated at 158C.Suzuki et al.(2009)found similar DTX1per cell concentra-tions in wild D.acuminata from Hokkaido Bay,Japan.Those cells also had amounts of PTX-2comparable to those found in our culture,as mentioned below.In addition to DTX1and OA,the Woods Hole Dinophysis culture produced the diol ester of OA,OA-D8.Although no standard solution was available,pronounced signals indicated that a significant amount of the toxin was present.The relative concentration of OA and OA-D8suggests that there is little free OA in the cell—i.e.,that most of it is stored in the ester form in the Woods Hole Dinophysis .This is in agreement with toxin profiles for P.lima and D.acuta samples from New Zealand (Suzuki et al.,2004;Quilliam et al.,1996).The diol ester forms of OA are rapidly converted into free toxins in culture media as well as in shellfish and,therefore,have the potential to cause DSP.Quantitation of PTXs was performed by UPLC–MS/MS with TQ detection because separation on the Hypersil C8did not allow for the separation of the isomer of PTX-11and PTX-2sa.Separation of these compounds was required because the isomer of PTX-11was detected in the PTX-2sa trace due to the detection of its isotopes which have their molecular mass increased by 2mass units (894.5m.u.instead of 892.5m.u.).PTX-2was present in the cell extracts at a concentration of 20.40pg cell À1and the isomer of PTX-11at 400fg cell À1.The concentrations of PTX-2are consistent with some published values for D.acuminata (e.g.,Miles et al.,2004b;MacKenzie et al.,2005;Kamiyama and Suzuki,2008),however,they are lower than those reported by Blanco et al.(2007)who found PTX concentrations of 180pg cell À1in D.acuminata cells isolated during a bloom.PTX-2can quickly degrade through hydrolysis in shellfish (Suzuki et al.,2001;Miles et al.,2004a )and by the release of algal enzymes during sample processing (MacKenzie et al.,2002)into PTX-2seco-acid which epimerizes into its more thermodynamically stable confirmation,7-epi-PTX seco-acid (Miles et al.,2004a ).The hydroxylated PTX-2exhibited identical fragmentation pattern as PTX-11and eluted earlier than the latter.This suggests that oxidation of PTX-2may have occurred at a different position than for PTX-11and MS evidence has indicated that this new hydroxylated PTX is different to PTX-1and to PTX-13.Further work is required to assign the structure of this compound.The role of PTX compounds in DSP is unclear and their toxic manifestations are not well understood;in mice PTX-2and PTX-11are toxic when injected intraperitoneally,however,these compounds along with 7-epi-PTX seco-acid are much less toxic when given orally to mice (Miles et al.,2004a;Suzuki et al.,2006).Presently PTX-1and PTX-2are included in shellfish safety regulations in the European Union.This demonstration of toxin production in cultured Dinophysis sets the stage for more detailed studies investigating the causes of geographic differences in toxin content.It is now clear that North American Dinophysis have the ability to produce DSP toxins,but appear to only rarely cause toxic DSP events.Although Dickey et al.(1992)detected OA in oysters in the northern Gulf of MexicoinFig.4.Example of chromatogram obtained from DAEP01obtained by LC–MS/MS triple quadrupole using the gradient method on a Hypersil C8column.OA and DTX1analyses were performed in negative ionization mode and OA-D8in positive mode.J.D.Hackett et al./Harmful Algae 8(2009)873–8798771990and Tango et al.(2002)reported trace levels of OA in shellfish in the Chesapeake Bay,thefirst significant episode in North America whereby shellfish became highly toxic during a Dinophysis bloom occurred only recently(2008)along the Texas coast,and most efforts tofind DSP toxins during previous Dinophysis blooms have failed.There are several possible causes for the regional differences in toxin content.Thefirst are environmental conditions such as temperature,light,nutrient availability,or other physical factors that might induce or repress toxin production.Production of toxins in other dinoflagellates is influenced by some of these conditions.For example,cellular concentrations of saxitoxin in Alexandrium sp.increase under phosphorus stress and decrease under nitrogen stress(Boyer et al.,1987;Anderson et al.,1990). Likewise,individual cultures of the diatom Pseudo-nitzschia show considerable variability in toxin content under different growth conditions(Bates et al.,1998).The second are genetic differences that cause modifications in toxin gene expression.In Dinophysis, these could be changes in promoters or transcription factors that regulate toxin gene expression.These alterations could cause an overall decrease in toxin production,or change how toxin production is regulated in response to environmental conditions.A third explanation invokes differences in species or strains of M. rubra or G.cryophila,the prey and plastid source of Dinophysis.This possibility is particularly intriguing given that DSP toxins have been localized to the plastid and PAS-bodies in Prorocentrum species(Zhou and Fritz,1994;Lawrence and Cembella,1999; Barbier et al.,1999).This distribution of DSP toxins in the cell has been suggested to be a sequestration strategy to prevent the toxin from affecting the cells own protein phosphatases(Barbier et al., 1999).Prorocentrum sp.have typical dinoflagellate plastids containing peridinin,not cryptophyte kleptoplasts like those found in Dinophysis sp.It is possible that some cryptophyte plastids are better than others for toxin production or sequestra-tion.If North American Dinophysis are not able to effectively sequester toxins,they may respond by reducing toxin production, or shifting the relative proportion of the different congeners.OA and DTX1have been shown to have an inhibitory effect on the growth of non-DSP producing algae(Windust et al.,1996;Sugg and VanDolah,1999),indicating that poor control of toxin localization could have adverse effects on Dinophysis cells.It is currently unknown what role the plastid may play in toxin production, however we now have the tools to test if local M.rubra or G. cryophila strain availability influences toxin production. AcknowledgementsThis work was partially funded by a Cooperative Institute for Climate and Ocean Research postdoctoral scholarship and research funds provided by the BIO5Institute at the University of Arizona to JDH.Analyses carried out at the Marine Institute were funded through the EU-FP7project BIOTOX(STREP FOOD-CT-2004-514074).Support for M.Tong provided by the China Scholarship Council(CSC)2007and Nankai University.Research was also supported by grants(to DMA)from the Woods Hole Center for Oceans and Human Health through grants NIEHS P50ES012742 and NSF OCE-043072.Support to DMA also provided by NSF OCE-0402707and OCE-0850421,and by the Ocean Life Institute at the Woods Hole Oceanographic Institution.The authors would like to acknowledge Dr.M.Quilliam and es for providing the reference solutions of OA-D8and PTX-11.[SS]ReferencesAnderson,D.M.,Kulis,D.M.,Sullivan,J.J.,Hall,S.,Lee,C.,1990.Dynamics and physiology of saxitoxin production by the dinoflagellates Alexandrium spp.Mar.Biol.104,511–524.Anderson,D.M.,Kulis,D.M.,Doucette,G.J.,Gallager,J.C.,Balech,E.,1994.Biogeo-graphy of toxic dinoflagellates in the genus Alexandrium from the northeast United States and Canada as determined by morphology,bioluminescence, toxin composition,and mating compatibility.Mar.Biol.120,467–478. Barbier,M.,Amzil,Z.,Mondeguer,F.,Bhaud,Y.,Soyer-Gobillard,M.-O.,Lassus,P., 1999.Okadaic acid and PP2A cellular immunolocalization in Prorocentrum lima (Dinophyceae).Phycologia38,41–46.Bates,S.S.,Garrison,D.L.,Horner,R.A.,1998.Bloom dynamics and physiology of domoic-acid-producing pseudo-nitzschia species.In:Anderson, D.M.,Cem-bella, A.D.,Hallegraeff,G.M.(Eds.),Physiological Ecology of Harmful Algal Blooms.Springer-Verlag,pp.267–292.Blanco,J.,A´lvarez,G.,Uribe,E.,2007.Identification of pectenotoxins in plankton,filter feeders,and isolated cells of a Dinophysis acuminata with an atypical toxin profile,from Chile.Toxicon49,710–716.Boni,L.,Milandri,A.,Poletti,R.,Pompei,M.,1993.DSP cases along the coasts of Emilia-Romanga(Northwest Adriatic Sea).In:Smayda,T.J.,Shimizu,Y.(Eds.), Toxic Phytoplankton Blooms in the Sea.Elsevier,Amsterdam,pp.475–481.Boyer,G.L.,Sullivan,J.J.,Andersen,R.J.,Harrison,P.J.,Taylor,F.J.R.,1987.Effects of nutrient limitation on toxin production and composition in the marine dino-flagellate Protogonyaulax tamarensis.Mar.Biol.96,123–128.Dickey,R.W.,Fryxell,G.A.,Granade,H.R.,Roelke,D.,1992.Detection of the marine toxins okadaic acid and domoic acid in shellfish and phytoplankton in the Gulf of Mexico.Toxicon30,355–359.Felsenstein,J.,2004.PHYLIP(Phylogeny Inference Package)version3.6.Distributed by the author.Department of Genome Sciences,University of Washington, Seattle,WA,USA.Fux,E.,McMillan,D.,Bire,R.,Hess,P.,2007.Development of an ultra-performance liquid chromatography–mass spectrometry method for the detection of lipo-philic marine toxins.J.Chromatogr.A1157,273–280.Giacobbe,M.G.,Penna,A.,Ceredi,A.,Milandri,A.,Poletti,R.,Yang,X.,2000.Toxicity and ribosomal DNA of the dinoflagellate Dinophysis sacculus(Dinophyta).Phycologia39,177–182.Gustafson,D.E.,Stoecker,D.K.,Johnson,M.D.,Van Heukelem,W.F.,Sneider,K.,2000.Cryptophyte algae are robbed of their organelles by the marine ciliate Meso-dinium rubrum.Nature405:1049–1052.Hardstaff,W.R.,Lewis,N.I.,Aasen,J.,Quilliam,M.A.,2006.Analysis of phycotoxins in hand-picked plankton cells by micro-column liquid chromatography–tandem mass spectrometry.In:Poster Presented at the XIIth Harmful Algal Bloom Conference,Copenhagen,Denmark,4–8September.Hoef-Emden,K.,Marin,B.,Melkonian,M.,2002.Nuclear and nucleomorph SSU rDNA phylogeny in the Cryptophyta and the evolution of cryptophyte diversity.J.Mol.Evol.55,161–179.Kamiyama,T.,Suzuki,T.,2008.Production of dinophysistoxin-1and pectenotoxin-2 by a culture of Dinophysis acuminata(Dinophyceae).Harmful Algae8,312–317.Lawrence,J.E.,Grant,J.,Quilliam,M.A.,Bauder,A.G.,Cembella,A.D.,2000.Coloniza-tion and growth of the toxic dinoflagellate Prorocentrum lima and associated fouling macroalgae on mussels in suspended culture.Mar.Ecol.Prog.Ser.201, 147–154.Lawrence,J.E.,Cembella,A.D.,1999.An immunolabelling technique for the detec-tion of diarrhetic shellfish toxins in individual dinoflagellate cells.Phycologia 38,60–65.Lee,J.S.,Igarashi,T.,Fraga,S.,Dahl,E.,Hovgaard,P.,Yamamoto,T.,1989.Determi-nation of diarrhetic shellfish toxins in various dinoflagellate species.J.Appl.Phycol.1,147–152.MacKenzie,L.,Beuzenberg,V.,Holland,P.,McNabb,P.,Suzuki,T.S.A.,2005.Pecte-notoxin and okadaic acid-based toxin profiles in Dinophysis acuta and Dino-physis acuminata from New Zealand.Harmful Algae4,75–85.MacKenzie,L.,Holland,P.,McNabb,P.,Beuzenberg,V.,Selwood,A.,Suzuki,T.,2002.Complex toxin profiles in phytoplankton and Greenshell mussels(Perna cana-liculus),revealed by LC–MS/MS analysis.Toxicon40,1321–1330.Maranda,L.,Corwin,S.,Dover,S.,Morton,S.L.,2007.Prorocentrum lima(Dinophy-ceae)in northeastern USA coastal waters.II.Toxicity in the epibiota and in shellfish.Harmful Algae6,632–641.Marcaillou,C.,Mondeguer,F.,Gentien,P.,2005.Contribution to toxicity assessment of Dinophysis acuminata(Dinophyceae).J.Appl.Phycol.17,155–160. Marshall,H.G.,1996.Toxin producing phytoplankton in Chesapeake Bay.Vac.J.Sci.47,29–37.Miles,C.O.,Wilkins,A.L.,Munday,R.,Dines,M.H.,Hawkes,A.D.,Briggs,L.R.,Sandvik, M.,Jensen,D.J.,Cooney,J.M.,Holland,P.T.,2004a.Isolation of pectenotoxin-2 from Dinophysis acuta and its conversion to pectenotoxin-2seco acid,and preliminary assessment of their acute toxicities.Toxicon43,1–9.Miles,C.O.,Wilkins,A.L.,Samdal,I.A.,Sandvik,M.,Petersen,D.,Quilliam,M.A., Naustvoll,L.J.,Rundberget,T.,Torgersen,T.,Hovgaard,P.,Jensen,D.J.,Cooney, J.M.,2004b.A novel pectenotoxin,PTX-12,in Dinophysis spp.and shellfish from Norway.Chem.Res.Toxicol.17,1423–1433.Morton,S.L.,Leighfield,T.A.,Hayes,B.L.,Petitpain,D.L.,Busman,M.A.,Moeller, P.D.R.,Bean,L.,McGowan,J.,Hurst Jr.,J.W.,Van Dolah,F.M.,1999.Evidence of diarrhetic shellfish poisoning along the coast of Maine.J.Shellfish Res.18,681–686.Park,M.G.,Kim,S.,Kim,H.S.,Myung,G.,Kang,Y.G.,Yih,W.,2006.First successful culture of the marine dinoflagellate Dinophysis acuminata.Aquat.Microb.Ecol.45,101–106.Quilliam,M.A.,Hardstaff,W.R.,Ishida,N.,McLachlan,J.L.,Reeves,A.R.,Rose,N.W., Windust,A.J.,1996.Production of diarrhetic shellfish poisoning(DSP)toxins byJ.D.Hackett et al./Harmful Algae8(2009)873–879 878。