英语图表作文常用句型表
如何用英语进行图表描述

写作模板——图表式作文It is obvious in the graph/table that the rate/number/amount of Y has undergone dramatic changes. It has gone up/grown/fallen/dropped considerably in recent years (as X varies). At the point of (接近)X1, Y reaches its peak value of …(多少).What is the reason for this change? Mainly there are … (多少) reasons behind the situation reflected in the graphic/table. First of all, …(第一个原因). More importantly, …(第二个原因). Most important of all, …(第三个原因).From the above discussions, we have enough reason to predict what will happen in the near future. The trend described in the graph/table will continue for quite a long time (if necessary measures are not taken括号里的使用于那些不太好的变化趋势).图表经典句型总结图表作文要求考生用文字材料把图表中所提供的信息准确、完整地表达出来。
在写作图表作文时,首先要仔细观察并分析图表,以及题中所给出的有关信息,。
在分析图表时,要抓住与主题有关的信息,要发现数据呈现的规律,要充分利用图表中的图形、数据等来说明主题。
但是注意不要过多地引用数据,以免造成滥用数据的后果。
英语作文 图标数据类基础写作
几种现象或观点对比 (一)相同对比 1. 男女生喜欢喜欢新潮衣服的数量都在增加/减少。 The number of the boys liking fashion clothes enjoys/suffers the same increase as it does for girls./ which holds true with regard to girls. 2. 喜欢周董的男生比例和喜欢周董的女生比例相同。 The percentage of the boys admiring Mr Zhou is the same as that of the girls. 3.调查显示 50% 的美国人在学习汉语,仅有10%的英 国人也在学习汉语。 According to the survey, 50% of Americans are leaning Chinese, compared with only 10% of the British.
重点注意: 1. 并不是图表中所有的数字都有用; 上周,我们以“谁是你的偶像”为题,在2600名学生 中 进行了一次调查(survey)。以下是调查数据: 偶像(idol) 女生 男生 伟人 18% 18% 父母 25% 11% 影视明星 50% 14% 体育明星 6% 48% 没有偶像 1% 9%
(二)不同对比 1. 大约百分之三十的人反对,同时百分之三十的赞同。 About 30% of the people are against it, which is the opposite to the people who are for it. 2. 80%中国人认为应该养成存钱的习惯,而超过90% 的美国人认为应该学会花钱。 80% of Chinese hold the belief that we should from the habit of paying money away, while more than 90% of Americans are against it./ disapprove of it.
高考英语作文图表数据句子

【导语】英语作⽂写作是英语学习的重要内容,也是英语学习的最终⽬标。
以下是由精⼼收集了⾼考英语作⽂图表数据句⼦,供⼤家欣赏学习!【篇⼀】⾼考英语作⽂图表数据句⼦ 1. 篇⾸ As we can see from the chart/ As is shown in the table/ According to the table, the price of oil increased dramatically. The figures in the chart reflect that/ The statistics show that/The numbers in the graph reveal that people’s income has been increasing steadily. The graph suggests/shows/indicates/illustrates that there has been a sharp decline/rise in the population in this region. It’s clear/apparent that the output of this type of products is rising/dropping. 2. 数据变化常⽤句型 数据的增长 The number of ….has grown steadily /has risen from / climbed / went sharply up /soared/ tends to go up / tends to increase…. There was a rapid/sharp /dramatic/gradual/slow increase/rise in the number of students. The number of students is on the rise/on the increase. 数据的降低 The number of … dropped steadily from / declined suddenly / fell/ tends to go down/ shows a tendency to decrease…. There is a sharp fall/ gradual decrease/ sudden reduction / slow decline / drop ..in the number of ..in 2006. 数据的持平 In 2006, the number of … remain the same /steady /stable / constant /level. There was little change/hardly any change in the number of between …and …/ There was a slight fluctuation in the number of .. from … to… 表⽰⽐较级、倍数、⽐例关系 be in direct ratio to/with 成正⽐ be in inverse ratio to/with 成反⽐ have the largest percentage /proportion of 占⽐例 the number of .. makes up /takes up / accounts for fifty percent of the total. 占总量的50% Compared with…, … has a higher / lower percentage 与。
英语饼图作文万能模板
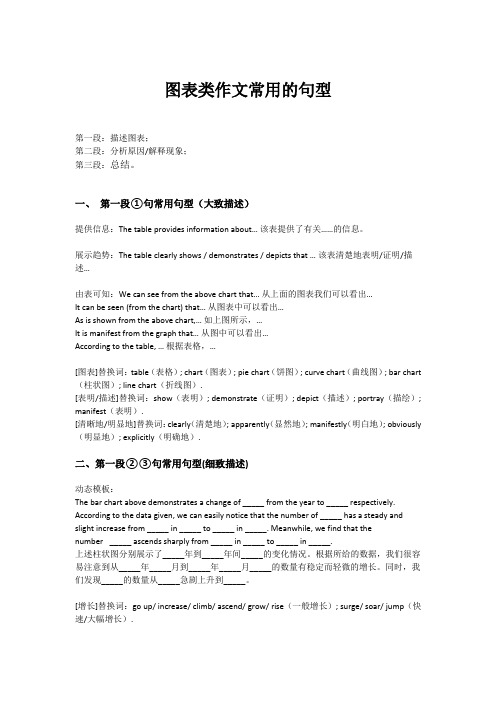
图表类作文常用的句型第一段:描述图表;第二段:分析原因/解释现象;第三段:总结。
一、第一段①句常用句型(大致描述)提供信息:The table provides information about…该表提供了有关……的信息。
展示趋势:The table clearly shows / demonstrates / depicts that …该表清楚地表明/证明/描述…由表可知:We can see from the above chart that…从上面的图表我们可以看出…It can be seen (from the chart) that…从图表中可以看出…As is shown from the above chart,…如上图所示,…It is manifest from the graph that…从图中可以看出…According to the table, …根据表格,…[图表]替换词:table(表格); chart(图表); pie chart(饼图); curve chart(曲线图); bar chart (柱状图); line chart(折线图).[表明/描述]替换词:show(表明); demonstrate(证明); depict(描述); portray(描绘); manifest(表明).[清晰地/明显地]替换词:clearly(清楚地); apparently(显然地); manifestly(明白地); obviously (明显地); explicitly(明确地).二、第一段②③句常用句型(细致描述)动态模板:The bar chart above demonstrates a change of _____ from the year to _____ respectively. According to the data given, we can easily notice that the number of _____ has a steady and slight increase from _____ in _____ to _____ in _____. Meanwhile, we find that thenumber _____ ascends sharply from _____ in _____ to _____ in _____.上述柱状图分别展示了_____年到_____年间_____的变化情况。
图表类英语四级作文常用句型

图表类英语四级作文常用句型开篇句式1)According to the figures given in the table,+ 主题句(the world population is increasing rapidly.2The table(pie chart, line graph, bar graph shows( indicates, illustrates, makes it clear that +主题句(One’s income is closely linked to one’s age and education)3 It can be seen from (It is clear from, It is evident from, It is illustrated from the table that + 主题句(the better one is educated , the higher his income is)4 As the bar chart shows, the number of people below poverty line decreased dramatically during the years of 1978 to 1998.图表式作文模板写作模板——图表式作文It is obvious in the graphic/table that the rate/number/amount of Y has undergone dramatic changes. It has gone up/grown/fallen/dropped considerably in recent years (as X varies. At the point of X1, Y reaches its peak value of …(多少.What is the reason for this change? Mainly there are … (多少reasons behind the situation reflected in the graphic/table. First of all, …(第一个原因. More importantly, …(第二个原因. Most important of all, …(第三个原因.From the above discussions, we have enough reason to predict what will happen in the near future. The trend described in the graphic/table will continue for quite a long time (if necessary measures are not taken括号里的使用于那些不太好的变化趋势.1.the table shows the change s in the number of……over the period from……to……该表格描述了在……年之……年间……数量的变化。
英语四级-cet4-图表类作文
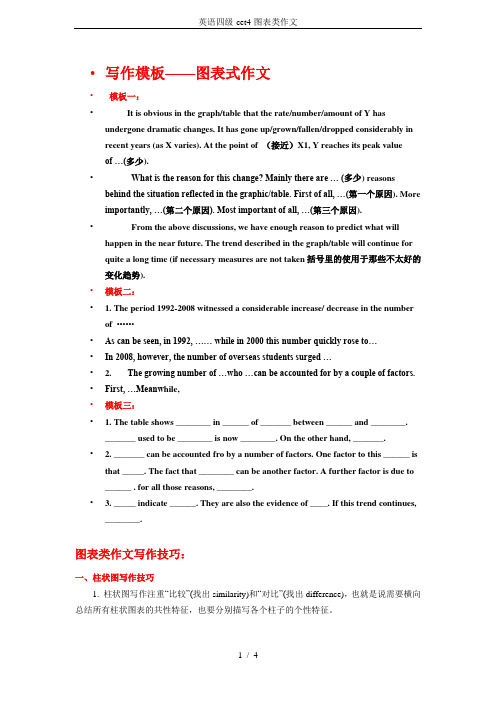
•写作模板——图表式作文•模板一:•It is obvious in the graph/table that the rate/number/amount of Y has undergone dramatic changes. It has gone up/grown/fallen/dropped considerably inrecent years (as X varies). At the point of (接近)X1, Y reaches its peak valueof …(多少).•What is the reason for this change? Mainly there are … (多少) reasons behind the situation reflected in the graphic/table. First of all, …(第一个原因). More importantly, …(第二个原因). Most important of all, …(第三个原因).•From the above discussions, we have enough reason to predict what will happen in the near future. The trend described in the graph/table will continue forquite a long time (if necessary measures are not taken括号里的使用于那些不太好的变化趋势).•模板二:• 1. The period 1992-2008 witnessed a considerable increase/ decrease in the number of ……•As can be seen, in 1992, …… while in 2000 this number quickly rose to…•In 2008, however, the number of overseas students surged …• 2. The growing number of …who …can be accounted for by a couple of factors.•First, …Meanw hile,•模板三:• 1. The table shows ________ in ______ of _______ between ______ and ________._______ used to be ________ is now ________. On the other hand, _______.• 2. _______ can be accounted fro by a number of factors. One factor to this ______ is that _____. The fact that ________ can be another factor. A further factor is due to______ . for all those reasons, ________.• 3. _____ indicate ______. They are also the evidence of ____. If this trend continues, ________.图表类作文写作技巧:一、柱状图写作技巧1. 柱状图写作注重“比较”(找出similarity)和“对比”(找出difference),也就是说需要横向总结所有柱状图表的共性特征,也要分别描写各个柱子的个性特征。
关于英语图表作文万能句子
【导语】⾼中⽣的英语写作⽔平整体偏低,⾼考作⽂情况不容乐观。
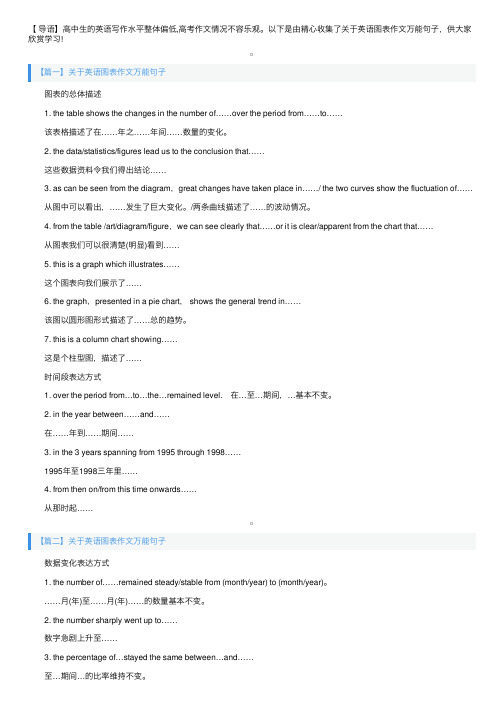
以下是由精⼼收集了关于英语图表作⽂万能句⼦,供⼤家欣赏学习!【篇⼀】关于英语图表作⽂万能句⼦ 图表的总体描述 1. the table shows the changes in the number of……over the period from……to…… 该表格描述了在……年之……年间……数量的变化。
2. the data/statistics/figures lead us to the conclusion that…… 这些数据资料令我们得出结论…… 3. as can be seen from the diagram,great changes have taken place in……/ the two curves show the fluctuation of…… 从图中可以看出,……发⽣了巨⼤变化。
/两条曲线描述了……的波动情况。
4. from the table /art/diagram/figure,we can see clearly that……or it is clear/apparent from the chart that…… 从图表我们可以很清楚(明显)看到…… 5. this is a graph which illustrates…… 这个图表向我们展⽰了…… 6. the graph,presented in a pie chart, shows the general trend in…… 该图以圆形图形式描述了……总的趋势。
7. this is a column chart showing…… 这是个柱型图,描述了…… 时间段表达⽅式 1. over the period from…to…the…remained level. 在…⾄…期间,…基本不变。
2. in the year between……and…… 在……年到……期间…… 3. in the 3 years spanning from 1995 through 1998…… 1995年⾄1998三年⾥…… 4. from then on/from this time onwards…… 从那时起……【篇⼆】关于英语图表作⽂万能句⼦ 数据变化表达⽅式 1. the number of……remained steady/stable from (month/year) to (month/year)。
高考英语图表作文详解+万能必背模板

(万能模板+模板句型+详细指导+举例范文+满分范文)
目录
一.万能模板 .............................................................................................................................................. 2 二.模板表述方法 .............................................................................................................................能模板
As is shown/ indicated/illustrated by the figure/percentage in the table (graph/picture/pie/chart), __作文题目的议题__has been on rise/ decrease (goes up/increases/drops/decreases), significantly/ dramatically /steadily rising/decreasing from__ in __ to __ in __. From the sharp/marked decline/ rise in the chart, it goes without saying that (毫无疑 问的看出) _________________________. There are at least two good reasons accounting for (这里至少有两个原因可以对 X X 作出解释) ______________________. On the one hand(一方面), ______. On the other hand(另一方面), ______ is due to the fact that ________(原因是). In addition(而且), _______ is responsible for _______. Maybe there are some other reasons to show (也许有其他原因要展示)_______. But it is generally believed that the above mentioned reasons are commonly convincing. As far as I am concerned, I hold the point of view that _______. I am sure my opinion is both sound and well-grounded.