sdarticle21
WEARING ARTICLE AND METHOD OF MANUFACTURING THE SA

专利名称:WEARING ARTICLE AND METHOD OFMANUFACTURING THE SAME发明人:OTSUBO, Toshifumi申请号:EP08873083.3申请日:20081216公开号:EP2260815A1公开日:20101215专利内容由知识产权出版社提供专利附图:摘要:The present invention aims to provide an improved wearing article allowing the dimension of the leg-openings to be adequately large without causing leakage of urine. A chassis (2) is formed in a crotch region (6) with an opening (15) extending through innerand outer sheets (12, 13) in the thickness direction. The opening (15) extends across the crotch region (6) in a longitudinal direction (Y) partially into front and rear waist regions (4, 5) and also extends through parts of respective waist region elastic sheets (14) in the thickness direction. An absorbent panel (16) functioning as a liquid-absorbent structure (3) is attached to the skin-facing surface of the chassis (2) to cover the opening (15). The liquid-absorbent panel (16) is joined along both side edges (17, 18) thereof to the inner sheet (12) and the waist region elastic sheets (14) by bonding or sealing technique and along front and rear ends (19, 20) thereof to the waist region elastic sheets (14) by bonding or sealing technique.申请人:Uni-charm Corporation地址:182 Shimobun Kinsei-cho Shikokuchuo-shi Ehime 799-0111 JP国籍:JP代理机构:Fitchett, Stuart Paul更多信息请下载全文后查看。
英文作文article

英文作文articleTitle: The Impact of Technology on Education。
In today's rapidly evolving world, technology plays an increasingly significant role in every aspect of our lives, including education. The integration of technology into education has brought about both positive and negative impacts, shaping the way students learn and educators teach. This article explores the various ways in which technology influences education and discusses its implications for the future.First and foremost, technology has revolutionized the way information is accessed and disseminated. With the internet and digital devices, students now have access to a vast amount of information at their fingertips. They can easily conduct research, explore diverse perspectives, and engage with multimedia resources to enhance their learning experience. This accessibility to information has democratized education, breaking down barriers to learningand empowering students from all backgrounds to pursue knowledge.Moreover, technology has transformed the traditional classroom environment. Interactive whiteboards, educational apps, and online platforms have become commonplace, providing educators with tools to create dynamic and engaging lessons. These digital resources cater todifferent learning styles and allow for personalized instruction, enabling students to learn at their own pace and according to their individual needs. Additionally, technology facilitates collaboration among students through online forums, video conferencing, and shared documents, fostering a sense of community and enhancing communication skills.Furthermore, technology has opened up new avenues for creativity and innovation in education. Students can now utilize multimedia tools to express their ideas, create multimedia presentations, and develop digital projects. Virtual reality (VR) and augmented reality (AR) technologies offer immersive learning experiences, allowingstudents to explore virtual environments and simulate real-world scenarios. These innovative approaches not only make learning more engaging but also cultivate critical thinking, problem-solving, and digital literacy skills essential for success in the 21st century.However, despite its numerous benefits, the widespread use of technology in education also poses challenges and concerns. One major issue is the digital divide, whichrefers to the gap between those who have access to technology and those who do not. Socioeconomic disparities and inadequate infrastructure can hinder access to digital devices and high-speed internet, depriving certain students of the opportunities afforded by technology. Bridging this divide requires concerted efforts from policymakers, educators, and technology providers to ensure equitable access to technology for all students.Additionally, the overreliance on technology in education raises concerns about its potential drawbacks. Excessive screen time and digital distractions can impede students' focus and concentration, leading to decreasedacademic performance and impaired social skills. Moreover, the proliferation of online resources raises questions about the quality and credibility of information available to students. Educators must teach students how tocritically evaluate sources and discern fact from fiction in an age of information overload.In conclusion, technology has undoubtedly reshaped the landscape of education, offering unprecedentedopportunities for learning and innovation. From enhancing access to information to fostering collaboration and creativity, technology has the potential to revolutionize education for the better. However, realizing this potential requires addressing challenges such as the digital divide and mitigating the risks associated with overreliance on technology. By harnessing the power of technology responsibly, educators can empower students to thrive in a digital age and prepare them for the challenges of the future.。
WEARING ARTICLE

专利名称:WEARING ARTICLE发明人:SUZUKI, Maiko,MIZUTANI, Katsumi 申请号:JP2009006217申请日:20091119公开号:WO10/067521P1公开日:20100617专利内容由知识产权出版社提供摘要:A wearing article configured in such a manner that a bodily liquid does not stay at the base side edge of a leakage prevention cuff to suppress a skin trouble such as a rash. A chassis (20) forming a diaper (10) comprises an inner surface sheet (21) located on the human body side and an outer surface sheet (22) located on the clothes side, and a liquid absorbing structure (40) is formed between the inner and outer surface sheets (21, 22). A high absorption region is formed in the liquid absorbing structure (40), and the high absorption region is adapted to have a higher liquid absorbing capacity than the remaining region of the liquid absorbing structure (40). The high absorption region has a front region (43) located on the front edge (14) side and a rear region (44) located on the rear edge (15) side and is formed by layering liquid absorptive core materials (41) in the thickness direction. Leakage prevention cuffs (30) are formed on the inner surface sheet (21) on the human body side thereof. The base side edge (31) of each leakage prevention cuff (30) is joined to the inner surface sheet (21) through an adhesion means (34), and portions of the adhesion means (34) are arranged so as to be superposed on the front and rear regions (43, 44) of the liquid absorbing structure (40).申请人:SUZUKI, Maiko,MIZUTANI, Katsumi地址:JP,JP,JP国籍:JP,JP,JP代理人:SHIRAHAMA, Yoshiharu 更多信息请下载全文后查看。
东北大学博士研究生英语考试真题

东北大学博士研究生英语考试真题Northeastern University Doctoral Graduate English ExamPart I: Reading ComprehensionDirections: Read the following passage and answer the questions.Passage 1:There has been an ongoing debate regarding the effectiveness of homework in improving student performance. Proponents argue that homework helps reinforce what students learn in class and fosters good study habits. On the other hand, critics claim that homework can be overwhelming for students, leading to stress and burnout.Question 1: According to the passage, what is one argument made by proponents of homework?Question 2: What is one argument made by critics of homework?Passage 2:Social media platforms have significantly impacted how people communicate and interact with each other. While some argue that social media enhances connectivity and allows foreasy sharing of information, others raise concerns about privacy and the spread of misinformation.Question 3: What is one benefit of social media mentioned in the passage?Question 4: What is one concern raised about social media?Part II: WritingDirections: Write an essay in response to the following prompt.Prompt: Some people believe that technology has improved communication between individuals, while others argue that it has led to a decline in face-to-face interactions. What is your opinion on this issue? Use specific examples to support your argument.Part III: Listening ComprehensionDirections: Listen to the following recording and answer the questions.Recording:You will hear a conversation between two students discussing their upcoming research projects.Question 1: What is one topic the students are researching?Question 2: How do the students plan to conduct their research?Part IV: SpeakingDirections: Respond to the following questions in your own words.Question 1: What is an important quality a successful graduate student should possess?Question 2: How do you plan to apply your research in your field of study?Prepare for the exam by reviewing the reading passages, practicing writing essays, listening to English recordings, and engaging in speaking exercises. Good luck on your English exam at Northeastern University!。
sdarticle11

annual volatilities of spot prices were 163.91% for copper, 119.05% for chromium, 168.24% for uranium, 153.87% for zinc, and 44.46% for lead. These data show that increasingly more companies are being exposed to high risks in natural resources prices, implying that the stable supply of natural resources is very important for the national economy and for the survival of a company.
1216
C. Won / Energy 34 (2009) 1215–1224
pricing model which is both easy to apply and realistic in order to help firms’ investment decision-making.
There are two major competing procedures for evaluating risky projects in natural resources developments: one is decision analytic, based on traditional discounted cash flow and stochastic dynamic programming (Fleten et al. [11], Smith and McCardle [27], Szklo et al. [28]) and the other is option pricing model (OPM) or contingent claims analysis, based on the no-arbitrage theory of financial markets (Brennan and Schwartz [3], Ekern [9], Emhjellen and Alaouze [10], Laughton [18], Paddock et al. [22], Schwartz [25], Sezgen et al. [26]). In this paper, we develop a new pricing model of natural resources projects by applying contingent claim analysis in order to help firms evaluate the projects more accurately and easily. Our model is different from previous models in several respects. First, our model uses different assumptions about underlying variables and different methodology. For example, we treat both output prices and development costs as stochastic and derive a closed-form solution through Martingale framework. While most of the previous literature treats only output prices as stochastic (Brennan and Schwartz [3], Dixit [6], Gibson and Schwartz [14], Laughton [18], Paddock et al. [22], Pindyck [23], Schwartz [24, 25], Sezgen et al. [26]) and does costs as uncertain, we make our model more realistic by treating both output prices and development costs as stochastic processes, because development costs change over time depending upon the fluctuations in materials and labor costs necessary for the developments. In addition, whereas we utilize Martingale principle to derive the pricing equation, other authors use different methods, such as an arbitrage argument through self-financing (Brennan and Schwartz [3]), a dynamic decision tree (Smith and McCardle [27]), and a real option framework by considering various managerial flexibility in the process of developments (Cortazar and Casassus [5], Fleten et al. [11], Laughton [18], Olsen and Stensland [21], Paddock et al. [22], Sezgen et al. [26], Szklo et al. [28]).
How to Write a Critical Review of a Journal Article

How to Write a Critical Review of a Journal ArticleWhat is a Critical Review of a Journal Article?A critical review of a journal article evaluates the strengths and weaknesses of an article's ideas and content. It provides description, analysis and interpretation that allow readers to assess the article's value.Before You Read the Article∙What does the title lead you to expect about the article?∙Study any sub-headings to understand how the author organized the content.∙Read the abstract for a summary of the author's arguments.∙Study the list of references to determine what research contributed to the author's arguments. Are the references recent? Do they represent important work in the field?∙If possible, read about the author to learn what authority he or she has to write about the subject.∙Consult Web of Science to see if other writers have cited the author's work. (Please see 'How to use E-Indexes'.) Has the author made an important contribution to the field of study?Reading the Article: Points to ConsiderRead the article carefully. Record your impressions and note sections suitable for quoting.∙Who is the intended audience?∙What is the author's purpose? To survey and summarize research on a topic? To present an argument that builds on past research? To refute another writer's argument?∙Does the author define important terms?∙Is the information in the article fact or opinion? (Facts can be verified, while opinions arise from interpretations of facts.) Does the information seem well-researched or is it unsupported?∙What are the author's central arguments or conclusions? Are they clearly stated? Are they supported by evidence and analysis?∙If the article reports on an experiment or study, does the author clearly outline methodology and the expected result?∙Is the article lacking information or argumentation that you expected to find?∙Is the article organized logically and easy to follow?∙Does the writer's style suit the intended audience? Is the style stilted or unnecessarily complicated?∙Is the author's language objective or charged with emotion and bias?∙If illustrations or charts are used, are they effective in presenting information?Prepare an OutlineRead over your notes. Choose a statement that expresses the central purpose or thesis of your review. When thinking of a thesis, consider the author's intentions and whether or not you think those intentions were successfully realized. Eliminate all notes that do not relate to your thesis. Organize your remaining points into separate groups such as points about structure, style, or argument. Devise a logical sequence for presenting these ideas. Remember that all of your ideas must support your central thesis.Write the First DraftThe review should begin with a complete citation of the article. For example:Platt, Kevin M. F. "History and Despotism, or: Hayden White vs. Ivan the Terrible and Peter the Great." Rethinking History 3:3 (1999) : 247-269.NOTE: Use the same bibliographic citation format as you would for any bibliography, works cited or reference list. It will follow a standard documentation style such as MLA or APA.Be sure to ask your instructor which citation style to use. For frequently used style guides consult Queen's Library's Citation and Style Guides.The first paragraph may contain:∙ a statement of your thesis∙the author's purpose in writing the article∙comments on how the article relates to other work on the same subject∙information about the author's reputation or authority in the fieldThe body of the review should:∙state your arguments in support of your thesis∙follow the logical development of ideas that you mapped out in your outline∙include quotations from the article which illustrate your main ideasThe concluding paragraph may:∙summarize your review∙restate your thesisRevise the First DraftIdeally, you should leave your first draft for a day or two before revising. This allows you to gain a more objective perspective on your ideas. Check for the following when revising:∙grammar and punctuation errors∙organization, logical development and solid support of your thesis∙errors in quotations or in referencesYou may make major revisions in the organization or content of your review during the revision process. Revising can even lead to a radical change in your central thesis.NOTE: Prepared by University of Toronto Mississauga Library, Hazel McCallion Academic Learning Centre。
高中英语Unit 1 The mass media Reading1 课件(16张)

sotrograynmizeayalclotYmhoiesu ifanrloofomnrem(a2ar)eti_roe_ns_pcd_ol_one_aszir_ebl_nyle_stf_ooo_rfg_ri_ev_ael_iaz_(i_nng)so(y3uo)ruc_re_gs_r.e_Ga_ato_cpo_cod_ute_rjnoa_tuti_ear_ln._a_li_s_ts_naececdoutont
The blog post below is about how to be a good journalist. B1 Complete the blog post with the correct forms of the words and
phrases in the box below.
2 A British writer and journalist once said, “A community needs news, for the same reason that a man needs eyes. It has to see where it is going.” How do you understand it?
So, you are interested in becoming a good journalist but don’t know where to start?
Well, there are a couple of things you should put on your list of (1) __p_r_i_o_ri_t_ie_s___.
sdarticle11
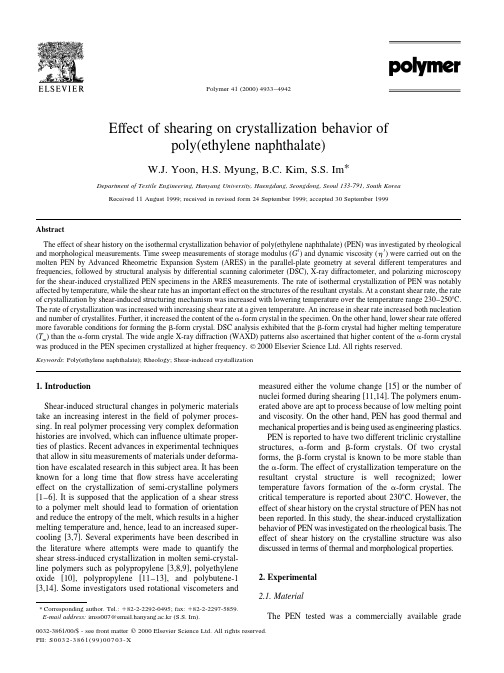
Effect of shearing on crystallization behavior ofpoly(ethylene naphthalate)W.J.Yoon,H.S.Myung,B.C.Kim,S.S.Im *Department of Textile Engineering,Hanyang University,Haengdang,Seongdong,Seoul 133-791,South KoreaReceived 11August 1999;received in revised form 24September 1999;accepted 30September 1999AbstractThe effect of shear history on the isothermal crystallization behavior of poly(ethylene naphthalate)(PEN)was investigated by rheological and morphological measurements.Time sweep measurements of storage modulus (G H )and dynamic viscosity (h H )were carried out on the molten PEN by Advanced Rheometric Expansion System (ARES)in the parallel-plate geometry at several different temperatures and frequencies,followed by structural analysis by differential scanning calorimeter (DSC),X-ray diffractometer,and polarizing microscopy for the shear-induced crystallized PEN specimens in the ARES measurements.The rate of isothermal crystallization of PEN was notably affected by temperature,while the shear rate has an important effect on the structures of the resultant crystals.At a constant shear rate,the rate of crystallization by shear-induced structuring mechanism was increased with lowering temperature over the temperature range 230–250ЊC.The rate of crystallization was increased with increasing shear rate at a given temperature.An increase in shear rate increased both nucleation and number of crystallites.Further,it increased the content of the a -form crystal in the specimen.On the other hand,lower shear rate offered more favorable conditions for forming the b -form crystal.DSC analysis exhibited that the b -form crystal had higher melting temperature (T m )than the a -form crystal.The wide angle X-ray diffraction (WAXD)patterns also ascertained that higher content of the a -form crystal was produced in the PEN specimen crystallized at higher frequency.᭧2000Elsevier Science Ltd.All rights reserved.Keywords :Poly(ethylene naphthalate);Rheology;Shear-induced crystallization1.IntroductionShear-induced structural changes in polymeric materials take an increasing interest in the field of polymer proces-sing.In real polymer processing very complex deformation histories are involved,which can influence ultimate proper-ties of plastics.Recent advances in experimental techniques that allow in situ measurements of materials under deforma-tion have escalated research in this subject area.It has been known for a long time that flow stress have accelerating effect on the crystallization of semi-crystalline polymers [1–6].It is supposed that the application of a shear stress to a polymer melt should lead to formation of orientation and reduce the entropy of the melt,which results in a higher melting temperature and,hence,lead to an increased super-cooling [3,7].Several experiments have been described in the literature where attempts were made to quantify the shear stress-induced crystallization in molten semi-crystal-line polymers such as polypropylene [3,8,9],polyethylene oxide [10],polypropylene [11–13],and polybutene-1[3,14].Some investigators used rotational viscometers andmeasured either the volume change [15]or the number of nuclei formed during shearing [11,14].The polymers enum-erated above are apt to process because of low melting point and viscosity.On the other hand,PEN has good thermal and mechanical properties and is being used as engineering plastics.PEN is reported to have two different triclinic crystalline structures,a -form and b -form crystals.Of two crystal forms,the b -form crystal is known to be more stable than the a -form.The effect of crystallization temperature on the resultant crystal structure is well recognized;lower temperature favors formation of the a -form crystal.The critical temperature is reported about 230ЊC.However,the effect of shear history on the crystal structure of PEN has not been reported.In this study,the shear-induced crystallization behavior of PEN was investigated on the rheological basis.The effect of shear history on the crystalline structure was also discussed in terms of thermal and morphological properties.2.Experimental 2.1.MaterialThe PEN tested was a commercially available gradePolymer 41(2000)4933–49420032-3861/00/$-see front matter ᭧2000Elsevier Science Ltd.All rights reserved.PII:S0032-3861(99)00703-X*Corresponding author.Tel.:ϩ82-2-2292-0495;fax:ϩ82-2-2297-5859.E-mail address:imss007@email.hanyang.ac.kr (S.S.Im).supplied by Kolon Group in South Korea.The inherent viscosity,0.344dl/g was determined in a mixture of trifluoroacetic acid and chloroform (1/3v/v%)with an Ubbelohde viscometer at 25^0:1ЊC :The polymer was dried in a vacuum oven at 120ЊC for 24h prior to use.2.2.Measurement of physical propertiesThe dynamic rheological properties were measured by ARES (Rheometric Scientifics)in the parallel plate geome-try.The plate diameter was 12.5mm,strain level was 5%,and gap between the plates was 1mm.The PEN chips were melted at 300ЊC.The initial gap was set to a value equiva-lent to final gap plus 50m m.The excess sample squeezed out by reducing the gap was carefully trimmed off.The value was reset to the final gap value,1mm.To remove the residual stress the newly set PEN specimen was relaxed for about 5min at the temperature in nitrogen atmosphere,then cooled to the predetermined temperature for rheologi-cal measurements.A time-sweep experiment was continued for the specimen till the G H reached the ceiling value of the apparatus.After ARES measurement,the molten PEN sample was detached from the plates for measuring other properties such as thermal and morphological properties by DSC,X-ray diffractometer and polarizing optical micro-scopy.Thermal properties were measured by Perkin–Elmer DSC-7over the temperature 50–300ЊC at the heating rate of 10ЊC/min under nitrogen purge.The isothermalcrystallization experiment was performed by two different methods.Firstly,the PEN sample was heated to 300ЊC at the heating rate of 200ЊC/min,and held for about 5min,then they were cooled to the preset temperature to bring about the isothermal crystallization for same time required in ARES experiment.Secondly,the PEN chips were melted at 300ЊC between two slide glasses for 5min on the hot stage.They were moved to an oil bath very quickly and isothermally crystallized at 230,240,and 250ЊC for 4,10,and 24h,respectively.Wide angle X-ray diffraction patterns of the isothermally crystallized PEN specimen in the oil bath and ARES were obtained by X-ray diffractometer (Rigaku Denki)with Ni-filtered CuK a radiation at 35kV and 35mA.Morphology of quiescent and shear-induced crystallized PEN specimen was observed by polarized microscopy (Nikon HFX-IIA).The spherulite structure was observed by microtoming the specimen.3.Results and discussionIn the plot of G H and h H versus time at a given frequency for a polymer,the two parameters may give information on the change in physicochemical properties of the polymer.For thermally sensitive polymer melts,an irreversible decrease of viscosity with time at a constant shear rate suggests the possibility of thermal degradation of polymer molecules,whereas an irreversible increase of viscosityW.J.Yoon et al./Polymer 41(2000)4933–49424934Fig.1.Variation of G H with time for PEN melt at 240ЊC at three different frequencies.with time indicates the possibility of chemical crosslinkingbetween polymer molecules.Both thermal degradation andchemical crosslinking show irreversibility in the rheologicalresponses.On the other hand,a reversible change in G H and h H with time at a constant frequency may be caused by changing in the physical state of the polymer melts.A typi-cal example of the physical change is the isothermal crystal-lization.As the crystallites grow to larger sized spheruliteswithin the PEN melt through nucleation and growth,thehomogeneous melt system changes to the heterogeneoussystem.Thus the G H and h H increase with the crystallization time.Figs.1and2show the variation of the G H and h H of PEN melt with time at240ЊC at three different shear rates(1,3, and5rad/s).At the early stage of experiment,both G H and h H are increased slowly,indicating an induction time for crystallization.The induction period is the stage when randomly entangled polymer chains transform to the regular aligned lattice.Because of topological obstruction of such entanglements,the polymer crystallization is extremely slow[16].However,an abrupt increase of both parameters follows in some minutes.This phenomenon can be ascribed to the formation of tiny crystals so-called crystallites prob-ably due to shear-induced crystallization.It can be easily imagined that the homogeneous PEN melt changes to a suspension system with proceeding crystallization,in which numerous crystallites are dispersed in the homo-geneous molten polymer matrix.The viscosity increases due to increasing the volume fraction of dispersed crystal-lites with progressing crystallization,which is also reportedby others[7,9,11,14,17].The ceiling value of G H is the same regardless of frequen-cies and temperatures whenfinishing crystallization asshown in Fig.1.On the other hand,the ceiling value of h H is gradually decreased with increasing the applied frequency as shown in Fig.2.This is attributable to pseudo-plasticity.That is,the heterogeneous system is expected toshow yield behavior[18].At low shear rates the hetero-geneous systems exhibit very high viscosity,and almostunbounded viscosity at zero shear rate.The viscosity,however,is rapidly decreased if the shear rate exceeds acritical value.Consequently,the ceiling viscosity at1rad/sis greater than at5rad/s.In addition,the ceiling value of h H shows a gradual decrease with time after having reached maximum as shown in Fig.2,which is more noticeable at the higher frequency.The gradual decrease of h H seems to result from the restructuring of the heterogeneous systems. That is,the viscosity is decreased with shearing on account of destruction of the orderedfiller particle structure.The destruction of the pseudostructure offiller particles is increased as shear rate is increased.Fig.2reflects this.It is also noted in Figs.1and2that the induction time forcrystallization is decreased as frequency is increased.Anapplication of shear stress to a polymer melt would giverise to two characteristic responses,orientation and slippageof polymer molecules.They are associated with theW.J.Yoon et al./Polymer41(2000)4933–49424935Fig.2.Variation of h H with time for PEN melt at240ЊC at three different frequencies.W.J.Yoon et al./Polymer41(2000)4933–49424936Fig.3.Variation of G H(A)and h H(B)for PEN melt at3rad/s at three different temperatures.W.J.Yoon et al./Polymer41(2000)4933–49424937Fig.4.DSC thermograms of PEN isothermally crystallized at(A)230ЊC,(B)240ЊC and(C)250ЊC at various frequencies.macroscopic phenomena of elasticity and flow,respectively.That is,the oriented polymer molecule has fewer possible conformations than the unoriented one,which results in lower entropy.At the melting temperature,the free energy of the crystal equals the free energy of the melt as written by [3]T mD H f D S f H m ϪH cS m ϪS c1Hence,for an oriented melt,the ensuing reduction in entropy raises T m .Further,it increases the degree of super-cooling,accelerating the rate of crystallization.In general,higher shear rate gives better chance for orientation.Con-sequently,the induction time for cystallization is decreased with increasing shear rate.In Fig.3(A)and (B)shows that the annealing temperaturehas a profound effect on the nucleation and crystallization mechanism of PEN melts.The increase of G H and h H with annealing time represents the extent of crystallization of the melts with annealing time.Fig.3suggests that the number and growth rate of the nucleated crystallites is greater at 230ЊC than at 250ЊC.That is,both nucleation density and growth rate of crystallites are diminished with raising the annealing temperature.This stands to reason because the maximum rate of the homogeneous crystallization of PEN melts is observed in the vicinity of 215ЊC.The viscosity behavior of the PEN melt with crystalliza-tion in Fig.3may be accounted for by adopting the Mooney equation in a qualitative manner [19].ln h =h 1K E F 21ϪF 2=F m2W.J.Yoon et al./Polymer 41(2000)4933–49424938Fig.4.(continued )Table 1The values of T m H and T m HH of PEN with frequency (230,240and 250indicate temperature.(a)and (b)indicate v 0 a and v 0 b ;respectively (see Fig.6).1,3and 5indicate frequencyT m HT m HH T m HT m HH T m HT m HH PEN230(a)259.2272.1PEN240(a)266.7PEN250(a)270.1PEN230(b)264.1270.9PEN240(b)272.1PEN250(b)280.1PEN2301255.6270.3PEN2401259.3269.3PEN2501269.1PEN2303256.0270.0PEN2403261.9268.7PEN2503270.4PEN2305256.2269.7PEN2405263.6268.0PEN2505270.7F m true volume of fillerapparent volume occupied by the filler3 in which h is the viscosity of the suspension,h l is the viscosity of the suspending medium,f2is the volume frac-tion of thefiller,f m is the maximum volume fraction that thefiller can have,and K E is the Einstein coefficient,whose value is known to be2.5for the dispersed sphericalfiller.W.J.Yoon et al./Polymer41(2000)4933–49424939Fig.5.WAXD patterns of PEN isothermally crystallized at(A)230ЊC,(B)240ЊC and(C)250ЊC at various frequencies.Referring to the Mooney equation,the crystallization patterns of PEN melts at 230ЊC and at 250ЊC are distinc-tively different from each other.The Mooney equation predicts that the degree of increasing the suspension visc-osity with increasing f 2is greatly increased if the spheres form aggregates because the aggregation of spheres (spheru-litic crystallites or crystals in this study)increases the appar-ent filler volume fraction.That is,the immobile portions (homogeneous molten PEN matrix in this study)caged by aggregated spheres also act as filler portion.On this assump-tion,it may be suggested that an application of higher shear rate during isothermal crystallization tends to increase the heterogeneous crystallization characteristics.Hence,the higher nucleation density and higher growth rate of the nucleated crystallites is obtained at higher frequency,and the resultant is more abundant with less stable a -form crys-tals (this will be discussed later in detail).The melt endotherms of quiescently and shear-induced crystallized PEN were shown in Fig.4and the correspond-ing peak temperatures are listed in Table 1.The double melting endotherm behavior is displayed during heating the PEN sample in the DSC cell.In the melting process of the shear-induced crystallized PEN sample,three endother-mic peaks are identified;a broad endotherm,a low endotherm (T m H ),and a high endotherm (T m HH )as shown in Fig.4.The broad endotherm might be due to the thermal history during cooling and reheating,and both low and high endotherms are due to the melting of original lamella and recrystallized one,respectively.These results well coincide with the results of Zachman et al.[20]:(1)no change of crystal modification is observed during DSC scanning;(2)the double melting behavior of PEN is due to the mechan-ism based on melting and recrystallization;(3)the b -form crystal has the T m higher than the a -form crystal by 2ЊC;and (4)the peaks of two forms of crystal are not separated in DSC thermogramsIn Fig.4(A)–(C)v 0rad =s indicates quiescent crystal-lization.(A)indicates that the PEN sample was crystallized at 230,240,and 250ЊC for the same time that required in the ARES experiments,and (B)expresses the PEN sample crys-tallized in an oil bath at the same temperature as in (A)for the time long enough to fully crystallize.Since the crystal-lization time in (A)is much shorter than in (B),an exother-mic peak is observed in the thermogram (A)at around 205ЊC.The v 0rad =s (b)curves in Fig.4(B)show a single melting peak.The T m shifts to higher temperature and peak width gets narrower as the crystallization time and tempera-ture are increased.This is attributable to the increased perfectness of the resultant crystal structure,which is observed more clearly when the sample is crystallized at higher temperature as can be seen in Fig.4(C).Only the b -form crystal exists when the sample is isothermally crys-tallized at 250ЊC after having melted at 300ЊC.This result matches well with the X-ray data.As mentioned the T m of the b -form crystal is higher than the a -form crystal by 2–4ЊC.It has been known that PEN has two different triclinic crystal structures.Buchner et al.reported that crystalW.J.Yoon et al./Polymer 41(2000)4933–49424940Fig.5.(continued )structures are influenced by both melting and isothermal crystallization temperature.They observed that the b -form crystal appeared mainly when PEN was isothermally crys-tallized above 230ЊC quiescently and the a -form crystal did below 230ЊC after having melted at 300ЊC [20].Fig.5presents WAXD patterns of PEN specimens shear-inducedcrystallized at (A)230ЊC,(B)240ЊC,(C)250ЊC at several frequencies.In Fig.5(A)the WAXD patterns for v 0rad =s shows diffraction peaks at 15.6and 23.3Њwhich correspond to (010)and (100)plane of the a -form crystal,respectively.The intensity of these peaks has a tendency to increase with increasing frequency.It means that the appli-cation of shear promotes the formation of the a -form crystal and the increase of frequency increases the content of the a -form crystal.In Fig.5(B)the (010)plane peak of the a -form crystal is smaller than that of the sample crystallized at 230ЊC in Fig.5(A)for v 0rad =s :However,the plane peak is increased with increasing frequency.In the case of the (100)plane peak,a shoulder appears at v 0rad =s :As frequency increases,the intensity of the plane peak standing for the a -form crystal shows tendency to increase.Particu-larly,for v 0rad =s in Fig.5(C)any plane peak of the a -form crystal is not observed,which is consistent with the results reported by Buchner et al.[20].The (010)and (100)plane peaks appear simultaneously,and keep on growing with increasing frequency.In addition,all diffraction peaks of Fig.5shift to lower angle when frequency is increased.This suggests that there is deformation in the crystal struc-tures as well.Thus,this X-ray trace of the sample is similar to those of Fig.5(A)and (B),suggesting similarity in the crystallization behavior at 230–250ЊC.In general,the b -form crystal is thermodynamically more stable but more difficult to nucleate than the a -form crystal and the form of the crystal is largely determined by kinetic factors during crystallization such as the rate of nucleation and spherulite growth [21].In the case of the a -form crystal,one chain passes through the unit cell and the chains in the crystal are extended.In the case of the b -form crystal,however,four chains pass through the unit cell and the chains in the crystal are not completely extended.When the polymer is sheared,the number of crystallites increases with shear rate,representing faster nucleation.Wolkowicz [14]mentioned that the number of crystallites increased exponentially with time at all shear rates.Also,this can be confirmed in Fig.6,which indicates that nuclea-tion becomes increasingly profuse with increasing frequency until the crystalline structure formed is no longer distinguishable with a microscope [3,22].Hence,the content of the a -form crystal in the speci-men increases with frequency because the a -form crys-tal is apt to nucleate due to fast nucleation.Consequently,the resultant a -form crystal is thermody-namically less stable than the b -form crystal because of much reduced entropy by molecular orientation under high shear force.References[1]Hill MJ,Keller A.J Macromol Sci (Phys)1969;B3(1):153.[2]Andrews EH.J Polym Sci 1966;A-2(4):663.[3]Haas TW,Maxwell B.Polym Eng Sci 1969;9:226.W.J.Yoon et al./Polymer 41(2000)4933–49424941(B)(A)(C)Fig.6.Polarizing optical micrographs of PEN crystallized at 240ЊC (A)v 0;(B)v 1;and (C)v 5:[4]Pennings AJ,van der Mark JMAA,Booj HC.kolloid Z v Z Polym1970;236:99.[5]Mackley MR,Keller A.Polymer1973;14:16.[6]Peterlin A.Polym Eng Sci1976;16:126.[7]Kobayashi K,Nagasawa T.J Macromol Sci(Phys)1970;B4:331.[8]Lagasse RR,Maxwell B.Polym Eng Sci1976;16:189.[9]Titomanlio G,Brucato V.Plastics Processing Society,The TenthAnnual Meeting,Akron,OH,1965,p.93.[10]Ulrich RD,Price FP.J Appl Polym Sci1976;14:401.[11]Eder G,Janeschizt-Kriehl H,Liedauer S.Progr Polym Sci1989;15:629.[12]Liedauer S,et al.Int Polym Proc VIII1993;3:236–44.[13]Moitzi J,Skallcky P.Polymer1993;34:3168.[14]Wolkowicz MD.J Polym Sci:Polym Symp1978;63:365.[15]Sherwood CH,Price FP,Stein RS.J Polym Sci;Polym Symp1977;63:77.[16]Imai M,et al.Phys.Rev.1995;B52:12696.[17]Kim JG,Park HJ,Lee JW.Korean J Rheol1997;4:174.[18]Carreau PJ,De Kee DCR,Chhabra RP.Rheology of polymericsystems,New York:Hanser,1997.[19]Nielsen LE.Polymer rheology,New York:Marcel Dekker,1977.[20]Buchner S,Wiswe D,Zachman HG.Polymer1989;30:480.[21]Zachman HG,Wiswe D,Riekel C.Macromol Chem Suppl1985;12:175.[22]Kim SP,Kim SC.Polym Eng Sci1993;33:83.W.J.Yoon et al./Polymer41(2000)4933–4942 4942。
- 1、下载文档前请自行甄别文档内容的完整性,平台不提供额外的编辑、内容补充、找答案等附加服务。
- 2、"仅部分预览"的文档,不可在线预览部分如存在完整性等问题,可反馈申请退款(可完整预览的文档不适用该条件!)。
- 3、如文档侵犯您的权益,请联系客服反馈,我们会尽快为您处理(人工客服工作时间:9:00-18:30)。
Journal of Neuroscience Methods95(2000)65–73Quantification of GABA A receptor subunit mRNAs bynon-radioisotopic competitive RT-PCR utilizing plate-basedEIA methodologyMikko Uusi-Oukari a,Raymonde Kleinz c,Riikka Ma¨kela¨b,Hartmut Lu¨ddens c,Esa R.Korpi a,*a Department of Pharmacology and Clinical Pharmacology,Uni6ersity of Turku,Kiinamyllynkatu10,FIN-20520Turku,Finlandb Department of Mental Health and Alcohol Research,National Public Health Institute,Helsinki,Finlandc Department of Psychiatry,Clinical Research Group,Uni6ersity of Mainz,Mainz,GermanyReceived21June1999;received in revised form29September1999;accepted10October1999AbstractWe developed a non-radioisotopic quantitative competitive RT-PCR method for the measurement of g-aminobutyric acid (GABA)type A receptor subunit mRNA levels.The specificity of the method was optimized by the use of four subunit-specific oligonucleotides in the sequential steps:reverse transcription,polymerase chain reaction(PCR),and detection.The biotinylated PCR products were bound on streptavidin-coated microtiter plates allowing detection of the products using dinitrophenyl (DNP)-labeled probes and anti-DNP alkaline phosphatase conjugate.The method was set up for the six major cerebellar GABA A receptor subunits:a1;a6;b2;b3;g2and d.The method is quantitative and rapid.With a large dynamic range from10fg to1 ng of subunit mRNA,the accuracy was12and19%(intra-and interassay coefficients of variation,respectively),which might be improved by using a smaller range of standards.The use of a double logarithmic standard curve[log(standard to competitor signal)vs.log(standard mRNA originally present)]requires only one reaction from each sample,allowing the analysis of a large number of samples in one experiment.©2000Elsevier Science B.V.All rights reserved.Keywords:Quantitative RT-PCR;Competitive PCR;Non-radioisotopic;mRNA;GABA A receptor subunits/locate/jneumeth1.IntroductionDuring the last decade the development of quantita-tive reverse transcription polymerase chain reaction (qRT-PCR)has made it possible to accurately quantify low concentrations of specific mRNA species.As com-pared with other methods(i.e.Northern blot,dot blot, hybridization protection assays and in situ hybridiza-tion)the sensitivity of qRT-PCR is many orders of magnitude higher,allowing the quantification of only a few copies of a specific mRNA species in a sample;e.g.a sample constituting a single cell(Zimmerman and Mannhalter,1996;Freeman et al.,1999).Three basic RT-PCR quantification strategies have been developed [competitive,noncompetitive and kinetic(real-time)], each of them having different advantages and draw-backs(Freeman et al.,1999).The expression of subunit mRNAs for g-aminobu-tyric acid A(GABA A)receptor,the main inhibitory re-ceptor family in the central nervous system(CNS),is differentially affected by chronic administration of drugs modulating the receptor function,like benzodi-azepines,barbiturates and ethanol(Morrow,1995).The receptor subunits are encoded by at least17genes belonging to the following classes:a;b;g;d;o and r (Whiting et al.,1995;Barnard et al.,1998).The follow-ing mammalian subunit variants have been cloned: a1–6;b1–3;g1–3;d;o and r1–3(Whiting et al.,1995;Abbre6iations:RT,reverse transcription;PCR,polymerase chainreaction;qRT-PCR,quantitative RT-PCR;GABA,g-aminobutyricacid;EIA,enzyme immunoassay;ANT,alcohol-nontolerant(alcohol-sensitive);AT,alcohol-tolerant(alcohol-insensitive);DNP,dinitro-phenyl;std,standard;comp,competitor.*Corresponding author.Tel.:+358-2-3337542;fax:+358-2-3337216.E-mail address:esa.korpi@utu.fi(E.R.Korpi)0165-0270/00/$-see front matter©2000Elsevier Science B.V.All rights reserved. PII:S0165-0270(99)00158-2M.Uusi-Oukari et al./Journal of Neuroscience Methods95(2000)65–73 66Barnard et al.,1998).The receptor subunit composition largely determines a pharmacological profile for a re-ceptor.To study the effects of chronic treatments on GABA A receptor expression at transcriptional level,the use of qRT-PCR would be the method of choice for quantification of absolute amounts of subunit mRNAs. Thus far,only one method for quantification of abso-lute amounts of rodent GABA A receptor subunit mRNAs has been published(Grayson et al.,1993).The method has been used by several groups(Bovolin et al., 1992;Devaud et al.,1995).Here we describe the development of a competitive qRT-PCR method for the quantification of rat and mouse GABA A receptor subunit mRNAs.The principle of the method is outlined in Fig.1.Biotin–streptavidin interaction was used to enable quantification on micro titer plates.The use of radioisotopes is avoided by using hapten-labeled detection probes and an enzyme immunoassay methodology.We use a standard curve derived from RT-PCR amplification of a dilution seriesof wild-type RNA in the presence of afixed amount ofmodified competitor RNA(Tsai and Wiltbank,1996).By that approach only a single RT-PCR reaction isneeded from each sample.In order to measure GABA A receptor subunitmRNA levels in the cerebral cortex and cerebellum oftwo rat lines,alcohol non-tolerant(ANT)and alcoholtolerant(AT),which are selectively outbred for highand low sensitivity for ethanol-induced motor-impair-ment,respectively(Eriksson and Rusi,1981),we set upthe method with the major cerebellar subunits a1,a6, b2,b3,g2and d.As the GABA A receptor pharmacol-ogy is altered in the cerebellum of ANT rats(Uusi-Oukari and Korpi,1990;Korpi et al.,1993),we studiedwhether the alterations could be due to an alteredsubunit mRNA expression causing an altered receptorsubunit composition and thus deviant pharmacologicalfeatures.2.Materials and methods2.1.MaterialsThe cDNAs encoding for rat GABA A receptor sub-units a1,a6,b2,b3,g2S,g2L and d(accession numbersL08490,L08495,X15467,X15468,L08497and L08496,respectively)were under the cytomegaloviruspromoter in the pRK5plasmid(Shivers et al.,1989;Ymer et al.,1989;Lu¨ddens et al.,1990).RiboMAXRNA synthesis kit,Access RT-PCR kit,RNasin ri-bonuclease inhibitor and DNase I were from Promega(Madison,WI).Streptavidin-coated microtiter plateswere from Labsystems(Helsinki,Finland).All oligonu-cleotides were synthesized in the Institute ofBiotechnology,Helsinki,Finland.Dinitrophenyl(DNP)-modified oligonucleotides were synthesized us-ing DNP–phosphoramidite according to manufactur-er’s instructions(Cruachem,Glasgow,Scotland).Anti-DNP–alkaline phosphatase conjugate was pur-chased from Vector Laboratories(Burlingame,CA).DNA modifying enzymes were purchased fromPromega and New England Biolabs(Beverly,MA).p-Nitrophenyl phosphate(p NPP)and glycogen werefrom Boehringer Mannheim(Mannheim,Germany).2.2.AnimalsAdult male ANT and AT rats,developed by selectiveoutbreeding for high and low sensitivity to motor-im-pairing effects of a moderate dose of ethanol(2g/kg,intraperitoneally)(Eriksson and Rusi,1981),from theF56generation were maintained in groups of four to sixanimals in stainless steel wire cages under a12/12-hFig.1.Principle of the qRT-PCR assay.Total RNA samples and subunit-specific standard RNAs are reverse transcribed(RT)in the presence of subunit-specific competitor RNA to single-stranded cDNAs.The cDNAs are amplified by PCR.Biotinylated(B-)PCR products are bound to streptavidin(SA)-coated microtiter plates. Double-stranded DNA is made single-stranded by alkaline denatura-tion.Subunit-specific wild-type and competitor(black areas)se-quences are probed with selective dinitrophenyl(DNP)-modified probes.These hybrids are detected by anti-DNP alkaline phosphatase (AP)conjugate and quantified using p-nitrophenyl phosphate as a color-forming substrate for the enzyme.M.Uusi-Oukari et al./Journal of Neuroscience Methods95(2000)65–7367light/dark cycle(lights on at06:00h)at an ambienttemperature of2292°C and a relative humidity of5595%.The rats had free access to RM1E rodentfeed(SDS,Witham,UK)and tap water.The ratswere killed by decapitation,and cerebral cortices andcerebella were rapidly dissected out,frozen on dry iceand stored at−80°C.2.3.Criteria used for choosing subunit-specificsequences to be amplifiedSpecific PCR primers for each subunit identical inmouse and rat sequences were chosen to make themethod applicable for quantification of mRNAs ofboth species.Initial comparison of the cDNA se-quences was made using DNASIS6.0program(HitachiSoftware Engineering,Brisbane,CA)and a word pro-cessor(Boswell,1987).The specificity of the prelimi-nary primers were assessed by the OLIGSCAN program(Montpetit et al.,1992)and further analysed by the OLIGO 5.0program(Rychlik and Rhoads,1989)to prevent cross-reaction(3%dimer formation)of theprimers.Melting temperatures[T d,determined accord-ing to the nearest-neighbor method,see Rychlik andRhoads(1989)]of the primers were adjusted to simi-lar values for multiplex PCR, e.g.for single-cells.Primer sequences,T d values and length of the PCRproducts are listed in Table 1.Each5%primer was5%-biotinylated to allow the binding of PCR productson streptavidin-coated microtiter plates.2.4.Construction of subunit-specific competitors forcompetiti6e PCROverlapping PCR primers were used to generate amodified sequence in the wild-type subunit cDNAs(Ho et al.,1989).The modified sequence was intro-duced in the middle of the PCR product to be am-plified by RT-PCR.It replaced the sequence which isused for detection of wild-type sequence of the sub-unit(Table1).The sequence5%-CTC TTA AGAATG TTC AGT TTT AAA was used for competitorsof all subunits.Wild-type cDNAs of the subunitswere cut out from pRK5vectors and replaced by thecorresponding competitor cDNAs.This ensures theidentity of these two constructs with the exception ofthe modified24nucleotide fragment and minimizesvariability in PCR efficiency.2.5.Synthesis of standard and competitor RNAstandardsStandard(std)and competitor(comp)RNA foreach subunit were synthesized from linearized pRK5plasmids with SP6RNA polymerase using Promega’sRiboMAX kit according to manufacturer’s instruc-tions.After purification,the synthesized RNAs were DNase I digested,phenol/chloroform extracted,pre-cipitated with isopropanol,washed with70%ethanol, and resuspended in nuclease-free water containing RNasin(0.5U/m l).RNA concentrations were deter-mined spectrophotometrically at A260and the integrity of the RNA standards was verified by formaldehyde gel electrophoresis and ethidium bromide staining. The synthesized RNAs were diluted in nuclease-free water containing RNasin(0.1U/m l)and glycogen(0.1 m g/m l)to afinal concentration of0.1m g/m l,aliquotted and stored at−80°C.2.6.Purification of total RNATotal RNA from rat and mouse brain regions was purified using the acid guanidinium thiocyanate/phe-nol/chloroform extraction method(Chomczynski and Sacchi,1987).The purified samples were treated with DNase I for1h at37°C,phenol/chloroform ex-tracted,precipitated with isopropanol,washed with 70%ethanol and resuspended in nuclease-free water containing RNasin(0.5U/m l)and glycogen(0.1m g/ m l).Total RNA concentrations were determined spec-trophotometrically at A260and adjusted to0.5m g/m l. Samples that were purified without DNase I diges-tion and PCR-amplified without RT reaction gave signals over background indicating the presence of contaminating genomic DNA.DNase I digestion abolished these signals and was thus used in the purification procedure.2.7.Re6erse transcriptionReverse transcription(RT)was performed using Promega’s Access RT-PCR kit essentially according to manufacturer’s instructions except that RT and PCR reactions were performed separately.RT reac-tions were carried out in a total volume of20m l containing1×reaction buffer,0.1m M subunit spe-cific RT-primer(see Table1),1pg of subunit-specific competitor,5U AMV reverse transcriptase (Promega),2.5–8.75mM Mg2+depending on the op-timal Mg2+concentration of the subunit in PCR, and0.5mM dNTPs in the absence or presence of sample total RNA(1m g in most experiments).Vari-ous amounts of subunit-specific standard RNA(10–106fg at1log intervals)were RT-PCR amplified in the presence of1pg of competitor in parallel to pro-duce a standard curve.The tubes were incubated in a Perkin–Elmer9600thermal cycler for45min at 48°C.AMV reverse transcriptase was then inactivated by a2-min incubation at94°C followed by cooling the samples to4°C.M .Uusi -Oukari et al ./Journal of Neuroscience Methods 95(2000)65–7368Table 1Primers used for reverse transcription and PCR amplification of GABA A receptor subunit mRNAsT d (°C)Position in cDNA PCR product length (bp)RT primers58.61218–1237a 1RT 5%TAAAGGTTTTCTTGGGTTCT 56.91215–12325%ATGGCTGGTAAGAGCAAT a 6RT 5%GGATGGTGATTTTCAGTT b 2RT 53.51303–132052.71308–13255%AGATCAGGGATTTTGATT b 3RT 5%TGCCATCCAAACACTCAT g 2RT 58.31214–1231d RT 58.85%TGTCGATGGTGTCTGCAT1259–1276PCR primers 5%a 171.25%GCAACCAGCTATACCCCTAACTTAGC 1111–1136893%a 171.45%TTGACTTCTTTCGGTTCTATGGTCG 1175–119968.7997–10215%GCTGTCAACTACTTCACCAATCTCC 1685%a 65%GCTGGCCTCAGAAGATGGAACG 3%a 673.01143–116471.91167–11895%b 21175%CAGGAGCACAATGCTTGCCTATG 69.71261–12835%CGACTTTTCTTTTGTGCCACATG 3%b 25%GAATGAGGTTGCAGGCAGCG 5%b 371.01134–11531403%b 372.05%TCTTGTGCGGGATGCTTCTGTC 1252–127371.01084–11075%CGGAAACCAAGCAAGGATAAAGAC 125(g 2S)5%g 25%TATTCTTCATCCCTCTCTTGAAGGTG 3%g 269.91183–1208149(g 2L)5%d 69.85%GGAAAGCCAAGGTCAAGGTCAC 1022–104317670.41236–12575%GATGGGTTTGAGTCTGGAACGG 3%d DNP –labeled detection probes a 15%GCCAAGCCGGGGTCACC 1141–11571075–10885%TGCACAACAATCTC a 65%AAAACTATGCCTAGGCA b 21223–12395%TTTCCTATACTGGATTCCTGAGTT b 31189–12121114–11375%AATGGTAGGGGCAGGGTTTTTCTT g 2S 24nt exon between 5%CTTGAAGGAAAACATCCGAAGAAG g 2L 1125and1126in g 2S 1135–1152d 5%AGGGACCCGGCCTTGACGcomp a5%TTTAAAACTGAACATTCTTAAGAG Position of modified sequence in subunit -specific competitors 1144–1167a 1a 61063–1086b 21213–12361189–1212b 3g 21114–1137d1129–1152aThe detection sequence of subunit-specific competitors (comp)is the same for all subunits.Therefore,comp probe was used to detect subunit-specific competitors of all subunits.2.8.PCR amplification of the cDNAsAfter the RT reaction the subunit-specific PCR primers and 5U TflDNA polymerase (Promega)were added in 1×reaction buffer in a total volume of 30m l.The final concentrations in the 50m l incubation volume were:0.1m M PCR primers,0.2mM dNTPs and 1.0–3.5mM Mg 2+depending on the optimal Mg 2+concentration for each subunit.PCR was performed in Perkin Elmer 9600thermal cycler.Following an initial 2-min denaturation at 94°C the cycling conditions were set as follows:94°C for 30s (denaturation),65°C for 30s (annealing)and 68°C for 30s (extension).A total of 25cycles was performed followed by a final extension at 68°C for 10min and cooling to 4°C.2.9.Detection of amplified sequencesAfter PCR,45m l of each PCR sample were diluted with 200m l of binding buffer (BB;20mM Tris–HCl,pH 7.5,containing 5mM EDTA,250mM NaCl,0.2%polyvinyl pyrrolidone,0.2%Ficoll 400and 0.05%Tween 20).Four 50-m l aliquots of the diluted sample were applied into four separate streptavidin-coated mi-crotiter plate wells:two wells to be hybridized with DNP-labeled wild-type subunit-specific detection probe and two wells to be hybridized with DNP-labeled detec-tion probe specific for the competitor sequence.The plates were incubated at room temperature for 30min with shaking,followed by addition of 100m l of denaturation solution (0.1M NaOH /0.3M NaCl).The plates were shaken for 1min and washed three timesM.Uusi-Oukari et al./Journal of Neuroscience Methods95(2000)65–7369with washing buffer(WB;20mM Tris–HCl,pH7.5, containing150mM NaCl and0.05%Tween20)using an automated Wallac1296–024Delfia Platewash plate washer.As the g2S and g2L splice variants were quantified separately,each PCR sample was diluted with300m l of BB.Six50-m l aliquots of each diluted PCR sample were bound to microtiter plates wells,two wells to be hybridized with each of the three detection probes:g2S; g2L and competitor.The wild-type subunit-and competitor-specific detection probe diluted in BB was added at30nM in a total volume of50m l/well and the plates were incubated for1h at room temperature with shaking.Some of the wild-type probes exhibited cross-reactivity either to the corresponding amplified competitor sequence or to the biotinylated5%PCR primer.Therefore,various incubation temperatures were tested to eliminate this nonspecific hybridization.Following hybridization,the plates were always washed at the hybridization temperature.After hybridization,the plates were washed six times with WB.Then50m l anti-DNP alkaline phosphatase conjugate diluted1:3000in conjugate buffer(CB;20 mM Tris–HCl,pH7.5,containing150mM NaCl,2 mM MgCl2,0.05%Tween20,1%BSA)was added.The plates were incubated at room temperature for1h and subsequently washed six times with WB.p-Nitrophenyl phosphate in substrate buffer(1M diethanolamine,pH 9.8,containing0.5mM MgCl2)was then added to each well(4mg/ml,100m l/well).The plates were incubated at room temperature with shaking and the OD405was read at various time points using a Multiscan Plus plate reader(Labsystems,Helsinki,Finland).2.10.Data analysisThe standard curves were produced by competitive coamplification of various amounts(10–106fg)of wild-type standard RNA with afixed amount of competitor RNA(1pg).Values for log(signal of standard/signal of competitor)were calculated and plotted against log (initial amount of standard RNA).The PRISM2.0pro-gram(GRAPHPAD Software,San Diego,CA)was used to generate the standard curve by linear regression and to calculate the amount of subunit mRNAs in the samples.Statistical differences between two groups were assessed using Student’s t-test,the P values smaller than0.05were regarded statistically significant.3.Results3.1.Optimization of PCR conditionsInitial RT-PCR experiments using1m g of cerebral cortical or cerebellar total RNA and40PCR cyclesyielded only one band of the expected size for allsubunits when analyzed in agarose gel electrophoresis.Therefore,the annealing temperature of65°C was highenough for specific amplification of the subunits.Optimal Mg2+concentrations for the subunit/primercombinations in PCR were assessed in Mg2+concen-tration range of1.0–3.5mM.One pg of each standardor competitor RNA was used as a template.The opti-mal Mg2+concentrations(in mM)were2.0–3.0(a1),2.5–3.5(a1comp),2.0–3.5(a6),3.0(b2),1.5–3.5(b3),2.5–3.0(g2S and g2L)and1.0–3.0(d).The optimalrange for Mg2+concentration was the same for thestandard and competitor for subunits other than a1.3.2.Optimization of hybridization conditionsInitial hybridization experiments were done at roomtemperature.PCR primers for a given subunit(1pmolof primers/well)or RT-PCR products from the corre-sponding standard or competitor template(productsfrom two50-m l RT-PCR reactions with100pg templatewere pooled and divided in three wells)were bound tomicrotiter plate wells.Nonbiotinylated DNA strandswere eluted and the corresponding probes added at30nM concentration.The subsequent washings and incu-bations were performed as described in Section2.Thewild-type probes for a1,a6,b2,b3and g2L subunitsgave no background and did not hybridize to biotiny-lated PCR primer or to the corresponding competitorRT-PCR products.The competitor probe did not cross-hybridize with any of the biotinylated PCR primers orstandard-specific RT-PCR products from any subunit.The probes for g2S and d showed cross-hybridizationto other targets than their complementary sequences inRT-PCR products from standard RNAs.Hybridizationof the d probe with primers and RT-PCR productsfrom the d competitor template gave40and10%of thesignals,respectively,as compared with the signal fromhybridization with standard RT-PCR products,indicat-ing significant cross-hybridization of the probe.Elevating the hybridization and subsequent wash tem-peratures to45°C reduced the cross-reactions to back-ground level without affecting hybridization to thestandard RT-PCR product.The24nt probe used for the detection of the g2Ssubunit is complementary to12nt of both5%and3%sequencesflanking the24nt sequences that are used fordetection of g2L and g2competitor.As expected,the g2S probe cross-reacted with the g2L-and g2competi-tor RT-PCR products at room temperature.Incubationand subsequent washing at60°C was needed to reducethese signals to background level.This temperature didnot affect the level of g2S probe hybridization to RT-PCR product derived from g2S template.M .Uusi -Oukari et al ./Journal of Neuroscience Methods 95(2000)65–7370amplification efficiencies of a 1standard and a 1com-petitor templates were evaluated by amplifying 1pg of both targets for various number of cycles.The slopes for the signal intensities plotted against the number of cycles did not differ between the two targets (Fig.2).Furthermore,the a 1standard /a 1competitor signal ra-tio after different number of PCR cycles did not differ from each other (cycles 18–25,mean 9S.E.M.=0.96990.005),indicating identical amplification effi-ciencies of the two templates.3.4.Effect of total RNA on amplification efficiencyThe expression of the a 6subunit is restricted to the cerebellar granule cells and cochlear nuclear granule cells (Lu ¨ddens et al.,1990;Varecka et al.,1994).There-fore,we used cerebral cortical total RNA and a 6RNA standards to assess whether the presence of total RNA might affect the amplification efficiency of RNA stan-dards differently or affect the slope of log(std /comp)to log(initial amount of std RNA before RT-PCR)stan-dard curve.The standard curves in the absence and presence of cerebral cortical total RNA were very simi-lar (Fig.3):the slopes of the curves were 5.690.3(no RNA)and 5.490.3(with RNA).Therefore,non-spe-cific RNA does not alter the standard curve indicating its suitability in evaluating the amount of mRNA cod-ing for a subunit in total RNA sample to be quantified.The linearity of the method was further evaluated by measuring the amount of endogenous a 1mRNA in cerebral cortical total RNA serially diluted in DEPC-treated water (Fig.4).The slope values for a 1standard curve (4.890.5)and endogenous a 1mRNA in serially diluted cortical total RNA (4.790.3)did not signifi-cantly differ from each other.Therefore,the standard and sample a 1RNA are amplified with the same effi-ciency,and the non-specific RNA has no effect on the amplification.The linearity in serially diluted cerebellar total RNA was demonstrated for a 6and b 2as well (data not shown).3.5.Reproducibility of the assayThe coefficient of variation (CV)was calculated within and between assays for quantification of a 1mRNA from cortical total RNA.The intra-and in-terassay CVs were 12%(n =10)and 19%(n =4),respectively.3.6.Quantification of subunit mRNAs in brain total RNA samples of AT and ANT ratsGABA A receptor subunit mRNAs were quantified in cerebral cortical and cerebellar total RNA from ANT and AT rats.The mRNA levels of a 1,b 2and b 3Fig.2.Amplification rates of a 1standard and a 1competitor.Sam-ples containing 1pg of a 1standard ( )and 1pg ( )a 1competitor were reverse transcribed and amplified for the number of cycles indicated.After the PCR,the products were quantified as described in Section 2.The values represent mean 9S.E.M.of three reactions.Fig.3.Effect of cortical total RNA on the RT-PCR amplification of the a 6standard.Various amounts (10fg–1ng)of a 6standard were amplified with 1pg of a 6competitor in the absence ( )and presence ( )of cerebral cortical total RNA (1m g /tube).Log (a 6std /a 6comp)was plotted against the log (amount of initial std RNA added to the RT-PCR).The values represent means of three PCR reactions.3.3.Validation of the method3.3.1.Amplification efficiencyThe optimal Mg 2+concentration for amplification of each standard and competitor template by RT-PCR was the same for both variants of the subunit.To further characterize the behavior of the templates,theM.Uusi-Oukari et al./Journal of Neuroscience Methods95(2000)65–7371Fig.4.Quantification of a1mRNA from serially diluted cerebral cortical RNA.The undiluted sample contained2m g of total RNA, and a serial1:10dilution was made in DEPC-treated water.These samples( )were RT-PCR amplified in parallel with the samples for the a1standard curve( ).The values represent means of three PCR reactions.statistically significant differences between the rat lines in mRNA levels of the subunits quantified in these two brain regions(Table2).4.DiscussionWe describe here the procedure and validation of a competitive qRT-PCR method for GABA A receptor subunit mRNAs,starting with the major cerebellar subunits.The method is strictly subunit-specific at each step:subunit-specific primers in the RT reaction,the amplification performed with subunit-specific primers, and the PCR productsfinally detected with subunit-specific detection probes.The method was shown to be highly specific for the subunit to be quantified;all primers amplified only one band of the correct size from total brain RNA samples.Furthermore,the cere-bellar granule-cell specific a6mRNA was not detected from cerebral cortex.Nonspecific RNA was without an effect on quantitative RT-amplification.The method offers many advantages as compared with‘conventional’qRT-PCR,where samples are am-plified in the presence of various amounts of competitor RNA,and the products quantified following restriction enzyme digestion and separation using agarose gel elec-trophoresis:(1)only one RT-PCR reaction is needed for each sample,and therefore less RNA sample is needed allowing the analysis of large number of sam-ples;(2)no hazardous and expensive radioisotopes are used;(3)heteroduplex formation is not a problem (Henley et al.,1996),as single-stranded PCR-products are detected;(4)the quantification of PCR products on microtiter plates is rapid,making it possible to quantify several hundred samples during1working day. Twenty-five cycles were sufficient to amplify all sub-units.If a more sensitive method is needed,for example in single-cell RT-PCR,it is possible to use lower stan-dard and competitor concentrations and higher cycle number to quantitate lower mRNA concentrations. The relative amounts of different GABA A receptor subunits in the cerebral cortex and cerebellum are in accordance with earlier qRT-PCR studies(Bovolin et al.,1992;Devaud et al.,1995,1996).Of the subunits studied,the concentrations of a1and b3in cerebral cortex were the highest,while that of g2variants and d were the lowest(Table2,Devaud et al.,1995,1996). However,in the present study the concentrations were five to tenfold lower than those found by Devaud et al. (1995,1996).The reason for this difference remains unresolved:differences in spectrophotometrical quan-tification of the RNA standards would cause a differ-ence in the levels,but are unlikely to cause such a large difference between the two methods.The use of a double log scale for quantification by competitive RT-PCR may also reduce the quantitative realibility of theTable2Quantification of subunit mRNAs from cerebral cortical and cerebel-lar samples of ANT and AT rats aRat strainSubunit mRNA concentration(pg/m g of total RNA)Cerebral cortex Cerebellum ANTa18.7790.607.1490.58 AT7.6590.329.4090.87ANTa6090 3.0890.30 AT090 3.5790.88ANT7.8690.59b28.1190.669.3091.008.7090.89ATANT10.990.64b3 6.7690.38 AT11.790.83 5.7390.460.4990.040.8090.05g2S ANTAT0.8090.070.5690.031.5890.13g2L ANT 2.2890.18AT 2.9890.18 1.7090.13d 1.7790.261.3290.08ANT1.2190.04AT 1.7190.20a The subunit mRNA levels in total RNA purified from cerebral cortex and cerebellum were quantified as described in Section2.The values represent mean9S.E.M.of seven(ANT)and six(AT)ani-mals.subunits were the highest in both cerebral cortex and cerebellum(Table2).No a6mRNA was detected in cerebral cortex from either rat line.There were no。