Genetic Drift Analysis of Recombination
体外研究人脐带血间充质干细胞诱导大鼠枯否细胞M2极化的开题报告

体外研究人脐带血间充质干细胞诱导大鼠枯否细胞M2极化的
开题报告
一、研究背景和意义
枯否细胞(M1)是机体对病原微生物和受损组织的免疫反应产生的效应细胞,有调节免疫应答作用。
但是过度M1极化会产生过度炎症反应,引起组织损伤。
M2极化是枯否细胞分化的另外一个方向,能够缓解炎症反应,所以M2调节因子的应用有望治疗众多炎症性疾病。
目前,体外研究证明了间充质干细胞(MSCs),即包括人脐带血间充质干细胞(UCMSCs)在内的MSCs,可以通过调节免疫反应来治疗多种疾病,包括炎症性疾病。
同时,UCMSCs 自身也具有M2极化的能力。
因此,本研究将重点研究UCMSCs对大鼠枯否细胞M2极化的作用。
二、研究内容和方法
本研究将采用体外实验,主要研究UCMSCs诱导大鼠枯否细胞M2极化的作用,并探讨其机制。
具体步骤如下:
1. 体外培养大鼠枯否细胞
2. 将UCMSCs和大鼠枯否细胞以不同的比例和时间共同培养
3. 分别检测UCMSCs和大鼠枯否细胞的表达谱,以及免疫学特征
4. 检测UCMSCs对大鼠枯否细胞M2极化的影响,并进一步研究其机制
5. 对比加入其他细胞因子对UCMSCs M2极化的影响
三、预期结果和意义
预计本实验可以探究UCMSCs对大鼠枯否细胞M2极化的作用,为今后更好的诊断和治疗炎症性疾病提供新思路。
此外,本研究能够加深对MSCs的免疫学特征、细胞因子激活和分子机制的认识,为深入研究MSCs的临床应用和产品开发提供理论基础。
Analysis of Genetic Diversity and Population Structure
Agricultural Sciences in China2010, 9(9): 1251-1262September 2010Received 30 October, 2009 Accepted 16 April, 2010Analysis of Genetic Diversity and Population Structure of Maize Landraces from the South Maize Region of ChinaLIU Zhi-zhai 1, 2, GUO Rong-hua 2, 3, ZHAO Jiu-ran 4, CAI Yi-lin 1, W ANG Feng-ge 4, CAO Mo-ju 3, W ANG Rong-huan 2, 4, SHI Yun-su 2, SONG Yan-chun 2, WANG Tian-yu 2 and LI Y u 21Maize Research Institute, Southwest University, Chongqing 400716, P.R.China2Institue of Crop Sciences/National Key Facility for Gene Resources and Genetic Improvement, Chinese Academy of Agricultural Sciences,Beijing 100081, P.R.China3Maize Research Institute, Sichuan Agricultural University, Ya’an 625014, P.R.China4Maize Research Center, Beijing Academy of Agricultural and Forestry Sciences, Beijing 100089, P.R.ChinaAbstractUnderstanding genetic diversity and population structure of landraces is important in utilization of these germplasm in breeding programs. In the present study, a total of 143 core maize landraces from the South Maize Region (SR) of China,which can represent the general profile of the genetic diversity in the landraces germplasm of SR, were genotyped by 54DNA microsatellite markers. Totally, 517 alleles (ranging from 4 to 22) were detected among these landraces, with an average of 9.57 alleles per locus. The total gene diversity of these core landraces was 0.61, suggesting a rather higher level of genetic diversity. Analysis of population structure based on Bayesian method obtained the samilar result as the phylogeny neighbor-joining (NJ) method. The results indicated that the whole set of 143 core landraces could be clustered into two distinct groups. All landraces from Guangdong, Hainan, and 15 landraces from Jiangxi were clustered into group 1, while those from the other regions of SR formed the group 2. The results from the analysis of genetic diversity showed that both of groups possessed a similar gene diversity, but group 1 possessed relatively lower mean alleles per locus (6.63) and distinct alleles (91) than group 2 (7.94 and 110, respectively). The relatively high richness of total alleles and distinct alleles preserved in the core landraces from SR suggested that all these germplasm could be useful resources in germplasm enhancement and maize breeding in China.Key words :maize, core landraces, genetic diversity, population structureINTRODUCTIONMaize has been grown in China for nearly 500 years since its first introduction into this second biggest pro-duction country in the world. Currently, there are six different maize growing regions throughout the coun-try according to the ecological conditions and farming systems, including three major production regions,i.e., the North Spring Maize Region, the Huang-Huai-Hai Summer Maize Region, and the Southwest MaizeRegion, and three minor regions, i.e., the South Maize Region, the Northwest Maize Region, and the Qingzang Plateau Maize Region. The South Maize Region (SR)is specific because of its importance in origin of Chi-nese maize. It is hypothesized that Chinese maize is introduced mainly from two routes. One is called the land way in which maize was first brought to Tibet from India, then to Sichuan Province in southwestern China. The other way is that maize dispersed via the oceans, first shipped to the coastal areas of southeast China by boats, and then spread all round the country1252LIU Zhi-zhai et al.(Xu 2001; Zhou 2000). SR contains all of the coastal provinces and regions lie in southeastern China.In the long-term cultivation history of maize in south-ern China, numerous landraces have been formed, in which a great amount of genetic variation was observed (Li 1998). Similar to the hybrid swapping in Europe (Reif et al. 2005a), the maize landraces have been al-most replaced by hybrids since the 1950s in China (Li 1998). However, some landraces with good adapta-tions and yield performances are still grown in a few mountainous areas of this region (Liu et al.1999). Through a great effort of collection since the 1950s, 13521 accessions of maize landraces have been cur-rently preserved in China National Genebank (CNG), and a core collection of these landraces was established (Li et al. 2004). In this core collection, a total of 143 maize landrace accessions were collected from the South Maize Region (SR) (Table 1).Since simple sequence repeat ( SSR ) markers were firstly used in human genetics (Litt and Luty 1989), it now has become one of the most widely used markers in the related researches in crops (Melchinger et al. 1998; Enoki et al. 2005), especially in the molecular characterization of genetic resources, e.g., soybean [Glycine max (L.) Merr] (Xie et al. 2005), rice (Orya sativa L.) (Garris et al. 2005), and wheat (Triticum aestivum) (Chao et al. 2007). In maize (Zea mays L.), numerous studies focusing on the genetic diversity and population structure of landraces and inbred lines in many countries and regions worldwide have been pub-lished (Liu et al. 2003; Vegouroux et al. 2005; Reif et al. 2006; Wang et al. 2008). These activities of documenting genetic diversity and population structure of maize genetic resources have facilitated the under-standing of genetic bases of maize landraces, the utili-zation of these resources, and the mining of favorable alleles from landraces. Although some studies on ge-netic diversity of Chinese maize inbred lines were con-ducted (Yu et al. 2007; Wang et al. 2008), the general profile of genetic diversity in Chinese maize landraces is scarce. Especially, there are not any reports on ge-netic diversity of the maize landraces collected from SR, a possibly earliest maize growing area in China. In this paper, a total of 143 landraces from SR listed in the core collection of CNG were genotyped by using SSR markers, with the aim of revealing genetic diver-sity of the landraces from SR (Table 2) of China and examining genetic relationships and population struc-ture of these landraces.MATERIALS AND METHODSPlant materials and DNA extractionTotally, 143 landraces from SR which are listed in the core collection of CNG established by sequential strati-fication method (Liu et al. 2004) were used in the present study. Detailed information of all these landrace accessions is listed in Table 1. For each landrace, DNA sample was extracted by a CTAB method (Saghi-Maroof et al. 1984) from a bulk pool constructed by an equal-amount of leaves materials sampled from 15 random-chosen plants of each landrace according to the proce-dure of Reif et al. (2005b).SSR genotypingA total of 54 simple sequence repeat (SSR) markers covering the entire maize genome were screened to fin-gerprint all of the 143 core landrace accessions (Table 3). 5´ end of the left primer of each locus was tailed by an M13 sequence of 5´-CACGACGTTGTAAAACGAC-3´. PCR amplification was performed in a 15 L reac-tion containing 80 ng of template DNA, 7.5 mmol L-1 of each of the four dNTPs, 1×Taq polymerase buffer, 1.5 mmol L-1 MgCl2, 1 U Taq polymerase (Tiangen Biotech Co. Ltd., Beijing, China), 1.2 mol L-1 of forward primer and universal fluorescent labeled M13 primer, and 0.3 mol L-1 of M13 sequence tailed reverse primer (Schuelke 2000). The amplification was carried out in a 96-well DNA thermal cycler (GeneAmp PCR System 9700, Applied Biosystem, USA). PCR products were size-separated on an ABI Prism 3730XL DNA sequencer (HitachiHigh-Technologies Corporation, Tokyo, Japan) via the software packages of GENEMAPPER and GeneMarker ver. 6 (SoftGenetics, USA).Data analysesAverage number of alleles per locus and average num-ber of group-specific alleles per locus were identifiedAnalysis of Genetic Diversity and Population Structure of Maize Landraces from the South Maize Region of China 1253Table 1 The detailed information about the landraces used in the present studyPGS revealed by Structure1) NJ dendragram revealed Group 1 Group 2 by phylogenetic analysis140-150tian 00120005AnH-06Jingde Anhui 0.0060.994Group 2170tian00120006AnH-07Jingde Anhui 0.0050.995Group 2Zixihuangyumi00120007AnH-08Zixi Anhui 0.0020.998Group 2Zixibaihuangzayumi 00120008AnH-09Zixi Anhui 0.0030.997Group 2Baiyulu 00120020AnH-10Yuexi Anhui 0.0060.994Group 2Wuhuazi 00120021AnH-11Yuexi Anhui 0.0030.997Group 2Tongbai 00120035AnH-12Tongling Anhui 0.0060.994Group 2Yangyulu 00120036AnH-13Yuexi Anhui 0.0040.996Group 2Huangli 00120037AnH-14Tunxi Anhui 0.0410.959Group 2Baiyumi 00120038AnH-15Tunxi Anhui 0.0030.997Group 2Dapigu00120039AnH-16Tunxi Anhui 0.0350.965Group 2150tianbaiyumi 00120040AnH-17Xiuning Anhui 0.0020.998Group 2Xiuning60tian 00120042AnH-18Xiuning Anhui 0.0040.996Group 2Wubaogu 00120044AnH-19ShitaiAnhui 0.0020.998Group 2Kuyumi00130001FuJ-01Shanghang Fujian 0.0050.995Group 2Zhongdouyumi 00130003FuJ-02Shanghang Fujian 0.0380.962Group 2Baixinyumi 00130004FuJ-03Liancheng Fujian 0.0040.996Group 2Hongxinyumi 00130005FuJ-04Liancheng Fujian 0.0340.966Group 2Baibaogu 00130008FuJ-05Changding Fujian 0.0030.997Group 2Huangyumi 00130011FuJ-06Jiangyang Fujian 0.0020.998Group 2Huabaomi 00130013FuJ-07Shaowu Fujian 0.0020.998Group 2Huangbaomi 00130014FuJ-08Songxi Fujian 0.0020.998Group 2Huangyumi 00130016FuJ-09Wuyishan Fujian 0.0460.954Group 2Huabaogu 00130019FuJ-10Jian’ou Fujian 0.0060.994Group 2Huangyumi 00130024FuJ-11Guangze Fujian 0.0010.999Group 2Huayumi 00130025FuJ-12Nanping Fujian 0.0040.996Group 2Huangyumi 00130026FuJ-13Nanping Fujian 0.0110.989Group 2Hongbaosu 00130027FuJ-14Longyan Fujian 0.0160.984Group 2Huangfansu 00130029FuJ-15Loangyan Fujian 0.0020.998Group 2Huangbaosu 00130031FuJ-16Zhangping Fujian 0.0060.994Group 2Huangfansu 00130033FuJ-17Zhangping Fujian0.0040.996Group 2Baolieyumi 00190001GuangD-01Guangzhou Guangdong 0.9890.011Group 1Nuomibao (I)00190005GuangD-02Shixing Guangdong 0.9740.026Group 1Nuomibao (II)00190006GuangD-03Shixing Guangdong 0.9790.021Group 1Zasehuabao 00190010GuangD-04Lechang Guangdong 0.9970.003Group 1Zihongmi 00190013GuangD-05Lechang Guangdong 0.9880.012Group 1Jiufengyumi 00190015GuangD-06Lechang Guangdong 0.9950.005Group 1Huangbaosu 00190029GuangD-07MeiGuangdong 0.9970.003Group 1Bailibao 00190032GuangD-08Xingning Guangdong 0.9980.002Group 1Nuobao00190038GuangD-09Xingning Guangdong 0.9980.002Group 1Jinlanghuang 00190048GuangD-10Jiangcheng Guangdong 0.9960.004Group 1Baimizhenzhusu 00190050GuangD-11Yangdong Guangdong 0.9940.006Group 1Huangmizhenzhusu 00190052GuangD-12Yangdong Guangdong 0.9930.007Group 1Baizhenzhu 00190061GuangD-13Yangdong Guangdong 0.9970.003Group 1Baiyumi 00190066GuangD-14Wuchuan Guangdong 0.9880.012Group 1Bendibai 00190067GuangD-15Suixi Guangdong 0.9980.002Group 1Shigubaisu 00190068GuangD-16Gaozhou Guangdong 0.9960.004Group 1Zhenzhusu 00190069GuangD-17Xinyi Guangdong 0.9960.004Group 1Nianyaxixinbai 00190070GuangD-18Huazhou Guangdong 0.9960.004Group 1Huangbaosu 00190074GuangD-19Xinxing Guangdong 0.9950.005Group 1Huangmisu 00190076GuangD-20Luoding Guangdong 0.940.060Group 1Huangmi’ai 00190078GuangD-21Luoding Guangdong 0.9980.002Group 1Bayuemai 00190084GuangD-22Liannan Guangdong 0.9910.009Group 1Baiyumi 00300001HaiN-01Haikou Hainan 0.9960.004Group 1Baiyumi 00300003HaiN-02Sanya Hainan 0.9970.003Group 1Hongyumi 00300004HaiN-03Sanya Hainan 0.9980.002Group 1Baiyumi00300011HaiN-04Tongshi Hainan 0.9990.001Group 1Zhenzhuyumi 00300013HaiN-05Tongshi Hainan 0.9980.002Group 1Zhenzhuyumi 00300015HaiN-06Qiongshan Hainan 0.9960.004Group 1Aiyumi 00300016HaiN-07Qiongshan Hainan 0.9960.004Group 1Huangyumi 00300021HaiN-08Qionghai Hainan 0.9970.003Group 1Y umi 00300025HaiN-09Qionghai Hainan 0.9870.013Group 1Accession name Entry code Analyzing code Origin (county/city)Province/Region1254LIU Zhi-zhai et al .Baiyumi00300032HaiN-10Tunchang Hainan 0.9960.004Group 1Huangyumi 00300051HaiN-11Baisha Hainan 0.9980.002Group 1Baihuangyumi 00300055HaiN-12BaishaHainan 0.9970.003Group 1Machihuangyumi 00300069HaiN-13Changjiang Hainan 0.9900.010Group 1Hongyumi00300073HaiN-14Dongfang Hainan 0.9980.002Group 1Xiaohonghuayumi 00300087HaiN-15Lingshui Hainan 0.9980.002Group 1Baiyumi00300095HaiN-16Qiongzhong Hainan 0.9950.005Group 1Y umi (Baimai)00300101HaiN-17Qiongzhong Hainan 0.9980.002Group 1Y umi (Xuemai)00300103HaiN-18Qiongzhong Hainan 0.9990.001Group 1Huangmaya 00100008JiangS-10Rugao Jiangsu 0.0040.996Group 2Bainian00100012JiangS-11Rugao Jiangsu 0.0080.992Group 2Bayebaiyumi 00100016JiangS-12Rudong Jiangsu 0.0040.996Group 2Chengtuohuang 00100021JiangS-13Qidong Jiangsu 0.0050.995Group 2Xuehuanuo 00100024JiangS-14Qidong Jiangsu 0.0020.998Group 2Laobaiyumi 00100032JiangS-15Qidong Jiangsu 0.0050.995Group 2Laobaiyumi 00100033JiangS-16Qidong Jiangsu 0.0010.999Group 2Huangwuye’er 00100035JiangS-17Hai’an Jiangsu 0.0030.997Group 2Xiangchuanhuang 00100047JiangS-18Nantong Jiangsu 0.0060.994Group 2Huangyingzi 00100094JiangS-19Xinghua Jiangsu 0.0040.996Group 2Xiaojinhuang 00100096JiangS-20Yangzhou Jiangsu 0.0010.999Group 2Liushizi00100106JiangS-21Dongtai Jiangsu 0.0030.997Group 2Kangnandabaizi 00100108JiangS-22Dongtai Jiangsu 0.0020.998Group 2Shanyumi 00140020JiangX-01Dexing Jiangxi 0.9970.003Group 1Y umi00140024JiangX-02Dexing Jiangxi 0.9970.003Group 1Tianhongyumi 00140027JiangX-03Yushan Jiangxi 0.9910.009Group 1Hongganshanyumi 00140028JiangX-04Yushan Jiangxi 0.9980.002Group 1Zaoshuyumi 00140032JiangX-05Qianshan Jiangxi 0.9970.003Group 1Y umi 00140034JiangX-06Wannian Jiangxi 0.9970.003Group 1Y umi 00140038JiangX-07De’an Jiangxi 0.9940.006Group 1Y umi00140045JiangX-08Wuning Jiangxi 0.9740.026Group 1Chihongyumi 00140049JiangX-09Wanzai Jiangxi 0.9920.008Group 1Y umi 00140052JiangX-10Wanzai Jiangxi 0.9930.007Group 1Huayumi 00140060JiangX-11Jing’an Jiangxi 0.9970.003Group 1Baiyumi 00140065JiangX-12Pingxiang Jiangxi 0.9940.006Group 1Huangyumi00140066JiangX-13Pingxiang Jiangxi 0.9680.032Group 1Nuobaosuhuang 00140068JiangX-14Ruijin Jiangxi 0.9950.005Group 1Huangyumi 00140072JiangX-15Xinfeng Jiangxi 0.9960.004Group 1Wuningyumi 00140002JiangX-16Jiujiang Jiangxi 0.0590.941Group 2Tianyumi 00140005JiangX-17Shangrao Jiangxi 0.0020.998Group 2Y umi 00140006JiangX-18Shangrao Jiangxi 0.0310.969Group 2Baiyiumi 00140012JiangX-19Maoyuan Jiangxi 0.0060.994Group 260riyumi 00140016JiangX-20Maoyuan Jiangxi 0.0020.998Group 2Shanyumi 00140019JiangX-21Dexing Jiangxi 0.0050.995Group 2Laorenya 00090002ShangH-01Chongming Shanghai 0.0050.995Group 2Jinmeihuang 00090004ShangH-02Chongming Shanghai 0.0020.998Group 2Zaobaiyumi 00090006ShangH-03Chongming Shanghai 0.0020.998Group 2Chengtuohuang 00090007ShangH-04Chongming Shanghai 0.0780.922Group 2Benyumi (Huang)00090008ShangH-05Shangshi Shanghai 0.0020.998Group 2Bendiyumi 00090010ShangH-06Shangshi Shanghai 0.0040.996Group 2Baigengyumi 00090011ShangH-07Jiading Shanghai 0.0020.998Group 2Huangnuoyumi 00090012ShangH-08Jiading Shanghai 0.0040.996Group 2Huangdubaiyumi 00090013ShangH-09Jiading Shanghai 0.0440.956Group 2Bainuoyumi 00090014ShangH-10Chuansha Shanghai 0.0010.999Group 2Laorenya 00090015ShangH-11Shangshi Shanghai 0.0100.990Group 2Xiaojinhuang 00090016ShangH-12Shangshi Shanghai 0.0050.995Group 2Gengbaidayumi 00090017ShangH-13Shangshi Shanghai 0.0020.998Group 2Nongmeiyihao 00090018ShangH-14Shangshi Shanghai 0.0540.946Group 2Chuanshazinuo 00090020ShangH-15Chuansha Shanghai 0.0550.945Group 2Baoanshanyumi 00110004ZheJ-01Jiangshan Zhejiang 0.0130.987Group 2Changtaixizi 00110005ZheJ-02Jiangshan Zhejiang 0.0020.998Group 2Shanyumibaizi 00110007ZheJ-03Jiangshan Zhejiang 0.0020.998Group 2Kaihuajinyinbao 00110017ZheJ-04Kaihua Zhejiang 0.0100.990Group 2Table 1 (Continued from the preceding page)PGS revealed by Structure 1) NJ dendragram revealed Group1 Group2 by phylogenetic analysisAccession name Entry code Analyzing code Origin (county/city)Province/RegoinAnalysis of Genetic Diversity and Population Structure of Maize Landraces from the South Maize Region of China 1255Liputianzi00110038ZheJ-05Jinhua Zhejiang 0.0020.998Group 2Jinhuaqiuyumi 00110040ZheJ-06Jinhua Zhejiang 0.0050.995Group 2Pujiang80ri 00110069ZheJ-07Pujiang Zhejiang 0.0210.979Group 2Dalihuang 00110076ZheJ-08Yongkang Zhejiang 0.0140.986Group 2Ziyumi00110077ZheJ-09Yongkang Zhejiang 0.0020.998Group 2Baiyanhandipinzhong 00110078ZheJ-10Yongkang Zhejiang 0.0030.997Group 2Duosuiyumi00110081ZheJ-11Wuyi Zhejiang 0.0020.998Group 2Chun’an80huang 00110084ZheJ-12Chun’an Zhejiang 0.0020.998Group 2120ribaiyumi 00110090ZheJ-13Chun’an Zhejiang 0.0020.998Group 2Lin’anliugu 00110111ZheJ-14Lin’an Zhejiang 0.0030.997Group 2Qianhuangyumi00110114ZheJ-15Lin’an Zhejiang 0.0030.997Group 2Fenshuishuitianyumi 00110118ZheJ-16Tonglu Zhejiang 0.0410.959Group 2Kuihualiugu 00110119ZheJ-17Tonglu Zhejiang 0.0030.997Group 2Danbaihuang 00110122ZheJ-18Tonglu Zhejiang 0.0020.998Group 2Hongxinma 00110124ZheJ-19Jiande Zhejiang 0.0030.997Group 2Shanyumi 00110136ZheJ-20Suichang Zhejiang 0.0030.997Group 2Bai60ri 00110143ZheJ-21Lishui Zhejiang 0.0050.995Group 2Zeibutou 00110195ZheJ-22Xianju Zhejiang 0.0020.998Group 2Kelilao00110197ZheJ-23Pan’an Zhejiang 0.0600.940Group 21)The figures refered to the proportion of membership that each landrace possessed.Table 1 (Continued from the preceding page)PGS revealed by Structure 1) NJ dendragram revealed Group 1 Group 2 by phylogenetic analysisAccession name Entry code Analyzing code Origin (county/city)Province/Regoin Table 2 Construction of two phylogenetic groups (SSR-clustered groups) and their correlation with geographical locationsGeographical location SSR-clustered groupChi-square testGroup 1Group 2Total Guangdong 2222 χ2 = 124.89Hainan 1818P < 0.0001Jiangxi 15621Anhui 1414Fujian 1717Jiangsu 1313Shanghai 1515Zhejiang 2323Total5588143by the software of Excel MicroSatellite toolkit (Park 2001). Average number of alleles per locus was calcu-lated by the formula rAA rj j¦1, with the standarddeviation of1)()(12¦ r A AA rj jV , where A j was thenumber of distinct alleles at locus j , and r was the num-ber of loci (Park 2001).Unbiased gene diversity also known as expected heterozygosity, observed heterozygosity for each lo-cus and average gene diversity across the 54 SSR loci,as well as model-based groupings inferred by Struc-ture ver. 2.2, were calculated by the softwarePowerMarker ver.3.25 (Liu et al . 2005). Unbiased gene diversity for each locus was calculated by˅˄¦ 2ˆ1122ˆi x n n h , where 2ˆˆ2ˆ2¦¦z ji ijij i X X x ,and ij X ˆwas the frequency of genotype A i A jin the sample, and n was the number of individuals sampled.The average gene diversity across 54 loci was cal-culated as described by Nei (1987) as follows:rh H rj j ¦1ˆ, with the variance ,whereThe average observed heterozygosity across the en-tire loci was calculated as described by (Hedrick 1983)as follows: r jrj obsobs n h h ¦1, with the standard deviationrn h obs obsobs 1V1256LIU Zhi-zhai et al.Phylogenetic analysis and population genetic structureRelationships among all of the 143 accessions collected from SR were evaluated by using the unweighted pair group method with neighbor-joining (NJ) based on the log transformation of the proportion of shared alleles distance (InSPAD) via PowerMarker ver. 3.25 (FukunagaTable 3 The PIC of each locus and the number of alleles detected by 54 SSRsLocus Bin Repeat motif PIC No. of alleles Description 2)bnlg1007y51) 1.02AG0.7815Probe siteumc1122 1.06GGT0.639Probe siteumc1147y41) 1.07CA0.2615Probe sitephi961001) 2.00ACCT0.298Probe siteumc1185 2.03GC0.7215ole1 (oleosin 1)phi127 2.08AGAC0.577Probe siteumc1736y21) 2.09GCA T0.677Probe sitephi453121 3.01ACC0.7111Probe sitephi374118 3.03ACC0.477Probe sitephi053k21) 3.05A TAC0.7910Probe sitenc004 4.03AG0.4812adh2 (alcohol dehydrogenase 2)bnlg490y41) 4.04T A0.5217Probe sitephi079 4.05AGATG0.495gpc1(glyceraldehyde-3-phosphate dehydrogenase 1) bnlg1784 4.07AG0.6210Probe siteumc1574 4.09GCC0.719sbp2 (SBP-domain protein 2)umc1940y51) 4.09GCA0.4713Probe siteumc1050 4.11AA T0.7810cat3 (catalase 3)nc130 5.00AGC0.5610Probe siteumc2112y31) 5.02GA0.7014Probe sitephi109188 5.03AAAG0.719Probe siteumc1860 5.04A T0.325Probe sitephi085 5.07AACGC0.537gln4 (glutamine synthetase 4)phi331888 5.07AAG0.5811Probe siteumc1153 5.09TCA0.7310Probe sitephi075 6.00CT0.758fdx1 (ferredoxin 1)bnlg249k21) 6.01AG0.7314Probe sitephi389203 6.03AGC0.416Probe sitephi299852y21) 6.07AGC0.7112Probe siteumc1545y21)7.00AAGA0.7610hsp3(heat shock protein 3)phi1127.01AG0.5310o2 (opaque endosperm 2)phi4207018.00CCG0.469Probe siteumc13598.00TC0.7814Probe siteumc11398.01GAC0.479Probe siteumc13048.02TCGA0.335Probe sitephi1158.03A TAC0.465act1(actin1)umc22128.05ACG0.455Probe siteumc11218.05AGAT0.484Probe sitephi0808.08AGGAG0.646gst1 (glutathione-S-transferase 1)phi233376y11)8.09CCG0.598Probe sitebnlg12729.00AG0.8922Probe siteumc20849.01CTAG0.498Probe sitebnlg1520k11)9.01AG0.5913Probe sitephi0659.03CACCT0.519pep1(phosphoenolpyruvate carboxylase 1)umc1492y131)9.04GCT0.2514Probe siteumc1231k41)9.05GA0.2210Probe sitephi1084119.06AGCT0.495Probe sitephi4488809.06AAG0.7610Probe siteumc16759.07CGCC0.677Probe sitephi041y61)10.00AGCC0.417Probe siteumc1432y61)10.02AG0.7512Probe siteumc136710.03CGA0.6410Probe siteumc201610.03ACAT0.517pao1 (polyamine oxidase 1)phi06210.04ACG0.337mgs1 (male-gametophyte specific 1)phi07110.04GGA0.515hsp90 (heat shock protein, 90 kDa)1) These primers were provided by Beijing Academy of Agricultural and Forestry Sciences (Beijing, China).2) Searched from Analysis of Genetic Diversity and Population Structure of Maize Landraces from the South Maize Region of China1257et al. 2005). The unrooted phylogenetic tree was finally schematized with the software MEGA (molecular evolu-tionary genetics analysis) ver. 3.1 (Kumar et al. 2004). Additionally, a chi-square test was used to reveal the correlation between the geographical origins and SSR-clustered groups through FREQ procedure implemented in SAS ver. 9.0 (2002, SAS Institute, Inc.).In order to reveal the population genetic structure (PGS) of 143 landrace accessions, a Bayesian approach was firstly applied to determine the number of groups (K) that these materials should be assigned by the soft-ware BAPS (Bayesian Analysis of Population Structure) ver.5.1. By using BAPS, a fixed-K clustering proce-dure was applied, and with each separate K, the num-ber of runs was set to 100, and the value of log (mL) was averaged to determine the appropriate K value (Corander et al. 2003; Corander and Tang 2007). Since the number of groups were determined, a model-based clustering analysis was used to assign all of the acces-sions into the corresponding groups by an admixture model and a correlated allele frequency via software Structure ver.2.2 (Pritchard et al. 2000; Falush et al. 2007), and for the given K value determined by BAPS, three independent runs were carried out by setting both the burn-in period and replication number 100000. The threshold probability assigned individuals into groupswas set by 0.8 (Liu et al. 2003). The PGS result carried out by Structure was visualized via Distruct program ver. 1.1 (Rosenberg 2004).RESULTSGenetic diversityA total of 517 alleles were detected by the whole set of54 SSRs covering the entire maize genome through all of the 143 maize landraces, with an average of 9.57 alleles per locus and ranged from 4 (umc1121) to 22 (bnlg1272) (Table 3). Among all the alleles detected, the number of distinct alleles accounted for 132 (25.53%), with an av-erage of 2.44 alleles per locus. The distinct alleles dif-fered significantly among the landraces from different provinces/regions, and the landraces from Guangdong, Fujian, Zhejiang, and Shanghai possessed more distinct alleles than those from the other provinces/regions, while those from southern Anhui possessed the lowest distinct alleles, only counting for 3.28% of the total (Table 4).Table 4 The genetic diversity within eight provinces/regions and groups revealed by 54 SSRsProvince/Region Sample size Allele no.1)Distinct allele no.Gene diversity (expected heterozygosity)Observed heterozygosity Anhui14 4.28 (4.19) 69 (72.4)0.51 (0.54)0.58 (0.58)Fujian17 4.93 (4.58 80 (79.3)0.56 (0.60)0.63 (0.62)Guangdong22 5.48 (4.67) 88 (80.4)0.57 (0.59)0.59 (0.58)Hainan18 4.65 (4.26) 79 (75.9)0.53 (0.57)0.55 (0.59)Jiangsu13 4.24 700.500.55Jiangxi21 4.96 (4.35) 72 (68.7)0.56 (0.60)0.68 (0.68)Shanghai15 5.07 (4.89) 90 (91.4)0.55 (0.60)0.55 (0.55)Zhejiang23 5.04 (4.24) 85 (74)0.53 (0.550.60 (0.61)Total/average1439.571320.610.60GroupGroup 155 6.63 (6.40) 91 (89.5)0.57 (0.58)0.62 (0.62)Group 2887.94 (6.72)110 (104.3)0.57 (0.57)0.59 (0.58)Total/Average1439.571320.610.60Provinces/Regions within a groupGroup 1Total55 6.69 (6.40) 910.57 (0.58)0.62 (0.62)Guangdong22 5.48 (4.99) 86 (90.1)0.57 (0.60)0.59 (0.58)Hainan18 4.65 (4.38) 79 (73.9)0.53 (0.56)0.55 (0.59)Jiangxi15 4.30 680.540.69Group 2Total887.97 (6.72)110 (104.3)0.57 (0.57)0.59 (0.58)Anhui14 4.28 (3.22) 69 (63.2)0.51 (0.54)0.58 (0.57)Fujian17 4.93 (3.58) 78 (76.6)0.56 (0.60)0.63 (0.61)Jiangsu13 4.24 (3.22) 71 (64.3)0.50 (0.54)0.55 (0.54)Jiangxi6 3.07 520.460.65Shanghai15 5.07 (3.20) 91 (84.1)0.55 (0.60)0.55 (0.54)Zhejiang23 5.04 (3.20) 83 (61.7)0.53 (0.54)0.60 (0.58)1258LIU Zhi-zhai et al.Among the 54 loci used in the study, 16 (or 29.63%) were dinucleotide repeat SSRs, which were defined as type class I-I, the other 38 loci were SSRs with a longer repeat motifs, and two with unknown repeat motifs, all these 38 loci were defined as the class of I-II. In addition, 15 were located within certain functional genes (defined as class II-I) and the rest were defined as class II-II. The results of comparison indicated that the av-erage number of alleles per locus captured by class I-I and II-II were 12.88 and 10.05, respectively, which were significantly higher than that by type I-II and II-I (8.18 and 8.38, respectively). The gene diversity re-vealed by class I-I (0.63) and II-I (0.63) were some-what higher than by class I-II (0.60) and II-II (0.60) (Table 5).Genetic relationships of the core landraces Overall, 143 landraces were clustered into two groups by using neighbor-joining (NJ) method based on InSPAD. All the landraces from provinces of Guangdong and Hainan and 15 of 21 from Jiangxi were clustered together to form group 1, and the other 88 landraces from the other provinces/regions formed group 2 (Fig.-B). The geographical origins of all these 143 landraces with the clustering results were schematized in Fig.-D. Revealed by the chi-square test, the phylogenetic results (SSR-clustered groups) of all the 143 landraces from provinces/regions showed a significant correlation with their geographical origin (χ2=124.89, P<0.0001, Table 2).Revealed by the phylogenetic analysis based on the InSPAD, the minimum distance was observed as 0.1671 between two landraces, i.e., Tianhongyumi (JiangX-03) and Hongganshanyumi (JiangX-04) collected from Jiangxi Province, and the maximum was between two landraces of Huangbaosu (FuJ-16) and Hongyumi (HaiN-14) collected from provinces of Fujian and Hainan, respectively, with the distance of 1.3863 (data not shown). Two landraces (JiangX-01 and JiangX-21) collected from the same location of Dexing County (Table 1) possessing the same names as Shanyumi were separated to different groups, i.e., JiangX-01 to group1, while JiangX-21 to group 2 (Table 1). Besides, JiangX-01 and JiangX-21 showed a rather distant distance of 0.9808 (data not shown). These results indicated that JiangX-01 and JiangX-21 possibly had different ances-tral origins.Population structureA Bayesian method was used to detect the number of groups (K value) of the whole set of landraces from SR with a fixed-K clustering procedure implemented in BAPS software ver. 5.1. The result showed that all of the 143 landraces could also be assigned into two groups (Fig.-A). Then, a model-based clustering method was applied to carry out the PGS of all the landraces via Structure ver. 2.2 by setting K=2. This method as-signed individuals to groups based on the membership probability, thus the threshold probability 0.80 was set for the individuals’ assignment (Liu et al. 2003). Accordingly, all of the 143 landraces were divided into two distinct model-based groups (Fig.-C). The landraces from Guangdong, Hainan, and 15 landraces from Jiangxi formed one group, while the rest 6 landraces from the marginal countries of northern Jiangxi and those from the other provinces formed an-other group (Table 1, Fig.-D). The PGS revealed by the model-based approach via Structure was perfectly consistent with the relationships resulted from the phy-logenetic analysis via PowerMarker (Table 1).DISCUSSIONThe SR includes eight provinces, i.e., southern Jiangsu and Anhui, Shanghai, Zhejiang, Fujian, Jiangxi, Guangdong, and Hainan (Fig.-C), with the annual maize growing area of about 1 million ha (less than 5% of theTable 5 The genetic diversity detected with different types of SSR markersType of locus No. of alleles Gene diversity Expected heterozygosity PIC Class I-I12.880.630.650.60 Class I-II8.180.600.580.55 Class II-I8.330.630.630.58。
光化学诱导大鼠脑缺血的定量分析

光化学诱导大鼠脑缺血的定量分析张杰文;索爱琴;卢芬;李玮;朱良付【期刊名称】《医药论坛杂志》【年(卷),期】2006(27)19【摘要】目的研究大鼠脑缺血后损伤体积和水含量的变化。
方法给大鼠尾静脉注射孟加拉玫瑰红,经颅骨用激光黄色连续光束照射鼠脑15min产生部位、大小固定的梗死灶,对梗死灶进行定量分析。
先行独立分组,在脑缺血后选择1、4、24、72、168h共5个不同时间点,检测损伤体积的变化和脑组织的水含量。
结果诱导缺血后在1~24h内损伤体积迅速扩大135.2%,而在24~168h内则缩小,168h时检测发现损伤较1h时缺血体积大的多,而与4h时差不多。
结论组织损害的最大程度在该模型中是在前4h后达到最大,而4h损伤的扩大是与脑的含水量有密切关系。
【总页数】4页(P11-14)【关键词】光化学;脑缺血动物模型;定量分析;大鼠【作者】张杰文;索爱琴;卢芬;李玮;朱良付【作者单位】河南省人民医院神经内科【正文语种】中文【中图分类】R-332【相关文献】1.降纤酶对血栓形成和光化学诱导大鼠脑缺血的影响 [J], 武小玲;王振金;尹岭;刘育英;赵秀梅2.异亚丙基莽草酸对光化学损伤诱导的脑缺血模型大鼠学习记忆能力的影响 [J], 王晶;张硕峰;周宁家;李振;甄诚;高文秀;孙建宁;郭亚健3.脑络通方对光化学诱导脑缺血大鼠脑内bFGF影响的实验研究 [J], 郑一;高玉红;张梅奎;张笑明;汪茜;张学文;尹岭4.一氧化氮与光化学法诱导大鼠脑缺血早期损伤的关系和绞股蓝总皂苷对脑缺血损伤的保护作用 [J], 谢志忠;朱炳阳;唐小卿;廖端芳;余麟因版权原因,仅展示原文概要,查看原文内容请购买。
肿瘤内皮标记物1通过丝裂原活化蛋白激酶途径介导内皮细胞对血管新生及对心力衰竭心肌重塑

肿瘤内皮标记物1通过丝裂原活化蛋白激酶途径介导内皮细胞对血管新生及对心力衰竭心肌重塑徐婷;黄薇;杨力;余浩【期刊名称】《实用医学杂志》【年(卷),期】2024(40)6【摘要】目的基于肿瘤内皮标记物1(TEM1)介导的丝裂原活化蛋白激酶(MAPKs)途径,探讨内皮细胞对血管新生及对心力衰竭心肌重塑的作用。
方法将小鼠随机分成4组,包括假手术组、MI组、MI+sh-NC组和MI+sh-TEM1组。
在心肌梗死(MI)后第7天通过免疫荧光染色检测梗死边缘区EndMT的变化,第28天通过超声心动图评估小鼠的心脏功能。
小鼠主动脉内皮细胞(MAECs)分为3组:对照组、Vector组和rTEM1组。
此外,用MAPK抑制剂SB203580预处理MAECs,用rTEM1处理细胞48 h。
通过Western blot评估内皮细胞中EndMT和MAPKs 信号通路的变化。
结果在梗死边缘区的心肌中,TEM1水平在MI后第1天轻微增加,在第7天显著达到峰值,然后在第28天降低。
与Vector组相比,rTEM1组MAECs中VE-Cadherin蛋白表达显著下降(P <0.05),和α-SMA、波形蛋白蛋白水平、相对迁移距离、侵袭细胞数和形成分支数量显著增加(P <0.05)。
SB203580逆转了由rTEM1诱导MAECs的这些变化。
与MI组相比,MI+sh-TEM1组中的CD31+Vimentin+共染色水平显著降低(P <0.01)。
在第28天,MI+sh-TEM1组小鼠的LVEF和LVFS均较MI组显著增强(P <0.05)。
与MI 组相比,MI+sh-TEM1组小鼠的内皮细胞中p-P38/P38和p-JNK/JNK蛋白表达降低。
结论 TEM1诱导的EndMT和血管生成参与了MI诱导心肌重塑的发病机制,其作用机制与MAPKs信号通路激活有关。
【总页数】7页(P780-786)【作者】徐婷;黄薇;杨力;余浩【作者单位】武汉市第一医院(武汉市中西医结合医院)心血管内科【正文语种】中文【中图分类】R542.22【相关文献】1.血府逐瘀汤促急性心肌缺血大鼠心肌血管新生及对血管内皮细胞生长因子的影响2.肿瘤抑素Tum5对人脐静脉血管内皮细胞血管生成活性以及碱烧伤诱导大鼠角膜新生血管的抑制作用3.可降解材料纤维蛋白胶介导血管内皮细胞生长因子对心肌梗死组织血管再生的影响4.血清血管内皮细胞生长因子C(VEGF-C)是晚期宫颈癌的特异性生物标记物:VEGF-C与胰岛素样生长因子Ⅱ(IGF-Ⅱ)、IGF结合蛋白3(IGF-BP3)及血管内皮细胞生长因子B(VEGF-B)的关系5.吴茱萸碱介导miR-223-3p对心肌微血管内皮细胞增殖、迁移和血管生成的影响因版权原因,仅展示原文概要,查看原文内容请购买。
《高级病理生理学》讲座Ⅰ氧化应激-自由基活性氧与疾病Ⅱ缺血-再灌注损伤 与预适应

• H2O2(hydrogen peroxide)生成
®岐化反应
° 非酶促氧化:
O2·- +O2·- +2H+ SOD H2O2+O2 ·-
®自氧化/加单氧;
• 1O2 (singlet oxygen)生成
®线粒体受损:
®三重态氧→ 1O2(激发态分子氧)
O2 +‧UQ- →‧O2‾ + UQ; FADH+O2→NAD+ + ‧O2‾
■ 线粒体DNA易受损: •原因:代谢转换率高, 自由基来源多;无组 蛋白保护;缺乏损伤 修复机制;缺乏复制 酶无校读功能致错率 高,等。 •方式:碱基缺失多见。
机体抗氧化防御系统
(Antioxidant Defense System in Body)
■抗氧化酶和蛋白系统 •Cu+2,Zn+2/Mn+3 _SOD:抗O·-2 •Fe+3-CAT(catalase) :抗H2O2 •Se - GSH/Px:清除LOOH
图 ROS 和亲电剂诱发启动的保护(抗氧化/适应)和 积累损伤(氧化应激)效应
(Initial & Accumulatory Effects of Chemically induced Superoxide & Electrophiles)
抗氧化剂 Vit,等
活性氧
氧化剂 芳香化合物 UV 重金属,等
《高级病理生理学》讲座
Ⅰ.氧化应激-自由基、活性氧 与疾病
Ⅱ.缺血-再灌注损伤 与预适应
(Part 1.Oxidative Stress-Free Redical ,ROS & Disease
人血管内皮生长因子受体2胞外段在毕赤氏巴斯德酵母中的表达(英文)

人血管内皮生长因子受体2胞外段在毕赤氏巴斯德酵母中的表达(英文)左秋;田聆;侯健梅;王永生;文艳君;李炯;魏于全【期刊名称】《四川大学学报:医学版》【年(卷),期】2006(37)1【摘要】目的探讨在毕赤氏巴斯德酵母(PICHIA PASTORIS)中高效表达有真核蛋白结构的人血管内皮生长因子受体2胞外段(HEVEGFR-2)的可行性。
方法从重组质粒PORF-HEVEGFR-2经PCR获全长HEVEGFR-2 DNA,构建重组毕赤氏巴斯德酵母分泌性表达载体,电转化PICHIA PASTORIS X-33。
用抗药性表型和甲醇诱导筛选出重组HEVEGFR-2蛋白表达阳性的转化子(X-33.HEVEGFR-2)。
结果SDS-PAGE显示。
获分子量约108 KDA的重组HEVEGFR-2蛋白。
约占X-33-HEVEGFR-2分泌性表达蛋白总量的45%。
该重组蛋白在表达上清中的质量浓度达80 MG/L。
其HEVEGFR-2部分分子量约106 KDA。
WESTERNBLOT证实,该蛋白能特异地与大鼠抗小鼠VEGFR-2单克隆抗体结合。
结论毕赤氏巴斯德酵母能高效表达有真核蛋白结构的人血管内皮生长因子受体2胞外段蛋白全段。
【总页数】4页(P1-4)【关键词】人血管内皮生长因子受体2;毕赤氏巴斯德酵母;基因表达【作者】左秋;田聆;侯健梅;王永生;文艳君;李炯;魏于全【作者单位】四川大学人类疾病生物治疗国家重点实验室肿瘤生物治疗研究室【正文语种】中文【中图分类】R818.74;R392【相关文献】1.人血管内皮细胞生长因子受体Flt-1胞外区cDNA在毕赤酵母中的表达和鉴定[J], 马骊;张智清;周小明;曾革非;陈爱君;姚立红;王小宁2.人血管内皮细胞生长抑制因子在巴斯德毕赤酵母中的分泌表达 [J], 刘麟;陈宇光;谈立松;唐亮;张颉3.克氏原螯虾i-型溶菌酶在巴斯德毕赤酵母中的高效胞外表达及其抑菌活性 [J], 水燕; 管政兵; 叶俊贤; 史永红; 刘国锋; 徐增洪4.异种同源表皮生长因子受体EGFR胞外段在毕赤巴斯德酵母中的表达 [J], 方芳;李炯;文艳君;田聆;魏于全5.鹌鹑血管内皮生长因子受体Quek1胞外段第2~4区cDNA在毕赤酵母中的表达和鉴定 [J], 刁鹏;文艳君;王永生;杜小波;周行;魏于全因版权原因,仅展示原文概要,查看原文内容请购买。
溶血性贫血动物模型制作步骤及方法
溶血性贫血动物模型制作步骤及方法溶血性贫血是由于红细胞破坏增多、增速,超过造血代偿能力时所发生的一组贫血。
红细胞的平均寿命为15~20d,红细胞破坏速度远远超过骨髓的代偿潜力时,则出现贫血。
溶血性贫血发病的基本问题是红细胞寿命缩短,易于破坏。
主要通过以下三方面的机制:红细胞膜的异常变化;血红蛋白的异常;机械性因素。
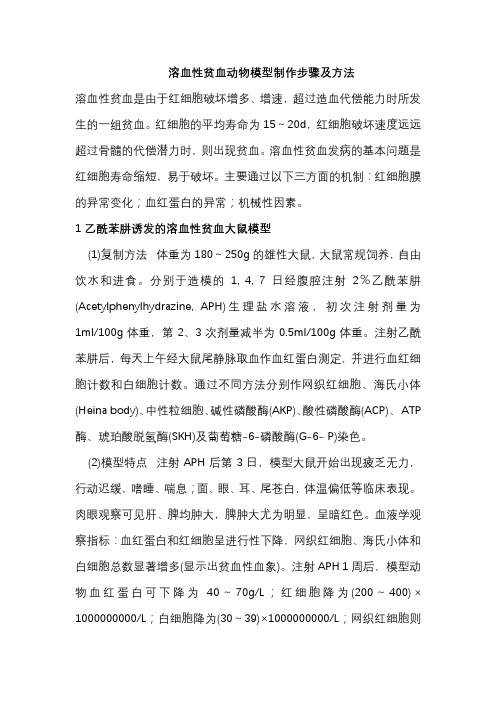
1乙酰苯肼诱发的溶血性贫血大鼠模型(1)复制方法体重为180~250g的雄性大鼠,大鼠常规饲养,自由饮水和进食。
分别于造模的1, 4, 7日经腹腔注射2%乙酰苯肼(Acetylphenylhydrazine, APH)生理盐水溶液,初次注射剂量为1ml/100g体重,第2、3次剂量减半为0.5ml/100g体重。
注射乙酰苯肼后,每天上午经大鼠尾静脉取血作血红蛋白测定,并进行血红细胞计数和白细胞计数。
通过不同方法分别作网织红细胞、海氏小体(Heina body)、中性粒细胞、碱性磷酸酶(AKP)、酸性磷酸酶(ACP)、ATP 酶、琥珀酸脱氢酶(SKH)及葡萄糖-6-磷酸酶(G-6- P)染色。
(2)模型特点注射APH后第3日,模型大鼠开始出现疲乏无力,行动迟缓,嗜睡、喘息;面、眼、耳、尾苍白,体温偏低等临床表现。
肉眼观察可见肝、脾均肿大,脾肿大尤为明显,呈暗红色。
血液学观察指标:血红蛋白和红细胞呈进行性下降,网织红细胞、海氏小体和白细胞总数显著增多(显示出贫血性血象)。
注射APH 1周后,模型动物血红蛋白可下降为40~70g/L;红细胞降为(200~400)×1000000000/L;白细胞降为(30~39)×1000000000/L;网织红细胞则升为85%~95%,海氏小体升至30%~38%(正常为0)。
血细胞组织化学染色观察显示中性粒细胞AKP、ACP、ATP酶、SDH和G-6-P酶均出现不同程度异常。
(3)比较医学乙酰苯肼可引起骨髓造血干细胞生长发生变化,促使其从骨髓向脾脏转移,而在代偿期出现骨髓血细胞增多。
粒细胞集落刺激因子与血管性痴呆大鼠海马凋亡相关蛋白

粒细胞集落刺激因子与血管性痴呆大鼠海马凋亡相关蛋白李肖云;兰希发;王玉琳;刘晶【期刊名称】《中国组织工程研究》【年(卷),期】2012(016)036【摘要】背景:研究表明粒细胞集落刺激因子在保护神经元免受各种因素所致的神经元变性和死亡中发挥重要作用。
目的:观察粒细胞集落刺激因子对血管性痴呆大鼠海马组织神经细胞凋亡及Bcl-2、Bax蛋白表达的影响。
方法:采用永久性双侧颈总动脉结扎法建立SD大鼠血管性痴呆模型,以未进行血管结扎的大鼠作为假手术组。
造模成功后,治疗组大鼠每日皮下注射粒细胞集落刺激因子50μg/kg,假手术组和模型组注射等量的生理盐水。
分别于造模后7,14,28d取大鼠海马组织用于检测。
结果与结论:Morris水迷宫结果显示,模型组大鼠逃避潜伏期明显延长(P 〈0.01),而治疗组各时间点大鼠逃避潜伏期较模型组缩短(P〈0.01);TUNEL及免疫组织化学结果显示,与模型组比较,治疗组各时间点大鼠海马TUNEL及Bax阳性细胞吸光度值明显减小(P〈0.01),Bcl-2阳性细胞吸光度值明显增加(P 〈0.01)。
说明粒细胞集落刺激因子可提高血管性痴呆大鼠海马Bcl-2蛋白的表达,抑制Bax蛋白的表达,减少神经细胞凋亡,改善大鼠的学习记忆功能。
【总页数】7页(P6741-6747)【作者】李肖云;兰希发;王玉琳;刘晶【作者单位】【正文语种】中文【中图分类】R394.2【相关文献】1.自噬对血管性痴呆大鼠海马CA1区生长相关蛋白-43及微管相关蛋白-2表达的影响 [J], 张文彦;刘金霞;刘斌;邓春颖;张晋霞;马原源;毛文静;李世英;吕超男2.血管性痴呆大鼠海马CA1区凋亡相关蛋白Bcl-2和Bax的表达 [J], 袁敏;刘贵江;刘斌3.粒细胞集落刺激因子与血管性痴呆大鼠海马凋亡相关蛋白 [J], 李肖云;兰希发;王玉琳;刘晶4.粒细胞集落刺激因子对血管性痴呆大鼠海马神经细胞凋亡的影响 [J], 李肖云;兰希发5.电针对血管性痴呆大鼠海马神经元凋亡相关蛋白Bcl-2、Bax和HO-1的影响[J], 李敏;徐国峰因版权原因,仅展示原文概要,查看原文内容请购买。
- 1、下载文档前请自行甄别文档内容的完整性,平台不提供额外的编辑、内容补充、找答案等附加服务。
- 2、"仅部分预览"的文档,不可在线预览部分如存在完整性等问题,可反馈申请退款(可完整预览的文档不适用该条件!)。
- 3、如文档侵犯您的权益,请联系客服反馈,我们会尽快为您处理(人工客服工作时间:9:00-18:30)。
郭观七 等:重组的遗传漂移分析 体的表示仍然是一个排列.
1877
采用不同方法确定当前位基因的值,可形成不同的扫描交叉算子.基于基因出现频率的扫描交叉 (occurrence based scanning crossover,简称 OSC),将当前基因的值设置为父代个体相应基因座上出现频率最高 的基因值,当出现频率相同时 ,则随机地取任意父代个体的基因值.均匀扫描交叉 (uniform scanning crossover,简 称 USC) 随机地取任意父代个体的基因值 , 因此 ,r 个父代个体以相同的概率捐献基因 . 基于适应值的扫描交叉 (fitness based scanning crossover, 简称 FSC) 按与父代个体的适应值成比例的方法确定子代个体的基因值 . 可 见,r=2 的 USC 等价于遗传算法的均匀交叉算子;在实数编码情况下,r=µ(µ 表示种群规模)的 USC 等价于进化策 略的全局离散重组.
+ Corresponding author: Phn: 86-730-8844171, Fax: 86-730-8847048, E-mail: guanqi_guo@
Received 2002-10-08; Accepted 2003-03-28 Guo GQ, Yu SY. Genetic drift analysis of recombination. Journal of Software, 2003,14(11):1875~1881. /1000-9825/14/1875.htm Abstract: Genetic drift in evolutionary computation, which results from the selection pressure, sampling error and
Genetic Drift Analysis of Recombination
GUO Guan-Qi1,2+,
Hale Waihona Puke 1 2YU Shou-Yi1
(College of Information Science and Technology, Central South University, Changsha 410083, China) (Department of Mechanical and Electrical Engineering, Hu’nan Institute of Science and Technology, Yueyang 414000, China)
进化计算中存在的遗传漂移现象导致种群均匀地收敛于单一个体 , 产生早熟收敛或丢失可选的全局
(或局部 )最优解.遗传漂移起源于选择压、选择的采样误差和重组算子的作用 .多父代重组算子是多种交叉和重 组算子的广义化 .以多父代重组算子为对象 , 研究重组的遗传漂移现象 .通过基因频率分析 ,严格地证明多父代对 角交叉和均匀扫描交叉不会引起遗传漂移 , 但基于基因出现频率的多父代扫描交叉导致遗传漂移 , 其程度随重 组规模的增加而加剧 . 应用基于基因出现频率的多父代扫描交叉的仿真遗传优化实验的数据表明 , 重组的遗传
1
广义多父代重组
重组被广泛地应用于遗传算法和进化策略中 , 是重要的搜索算子 .除了传统的一点交叉、多点交叉、均匀
交叉、离散重组、中间重组以外,近年来,多父代重组已成为一种常用的重组技术.由 Eiben[9]提出的多父代对角 交叉和扫描交叉是多父代重组技术的典型代表. 对角交叉.将 r(重组规模)个父代个体中每一个个体以完全相同的方式分割成 r 个子段,沿对角线方向从各 个体中选取一个子段构造一个子代个体,r×r 个子段总可以构造 r 个子代个体,为方便起见,将这种交叉称为对称 对角交叉 (symmetric diagonal crossover,简称 SDC). 如果 r 个父代仅构造一个子代 ,则称其为非对称对角交叉 (asymmetric diagonal crossover,简称 ADC).显然,r=2 的 SDC 等价于标准的一点交叉,从某种意义上说,它也是 2 父代多点交叉的广义化. 扫描交叉.设 x1,x2,…,xr 表示父代个体,x 表示新生子代个体,个体的编码长度为 L(实数编码下表示目标变量 的维数),扫描交叉的算法可用下列伪代码描述: Algorithm SC { initialize position markers as i1=i2=,…,=ir=1; for i=1 to L { choose j from 1,…, r; let ith allele of x be the ijth allele of parent j; update position markers; } } 该算法仅定义了扫描交叉的一般框架 ,其实现取决于 j 的选择方法和位置标记的更新方法 . 最简单的实现 可以是 j 取区间[1,r]上的均匀随机整数,并令 ij=(i−1)j+1.扫描交叉不仅适用于二进制、整数和实数编码表示,也 适用于组合优化中的有序表示.例如,如果个体的表示是一个排列,可令 i j = min{k | k > (i − 1) j , xkj ∉ {x1 ,..., x(i −1) j }} , 这样 , 可确保子代个体的当前位基因取第 j 个父代个体的一位尚未在子代个体中出现的基因 ,从而保证子代个
2
基因频率分析
重组的操作对象为基因 . 重组可能导致等位基因座 (locus) 上某基因值 (allele) 出现的频率增加或减少 , 也就
是说 , 重组可能引起基因的漂移 . 一旦某基因值从等位基因座上消失 , 只能依赖变异算子来恢复 , 因此 , 变异是基 因漂移的反作用力 .虽然选择引起个体数量的变化 , 个体数量的变化也意味着基因频率的改变 ,但由选择引起的 遗传漂移已在文献 [8]中有所分析 .为简单起见,本文不考虑选择和变异算子的影响 ,应用基因频率分析方法研究 二进制编码下重组算子的遗传漂移现象.在进行重组算子的漂移分析之前,需要定义下列术语: 多数基因 (dominant allele):某基因座上出现频率最高的基因值 ,其出现频率记为 p,其他基因值则为少数基 因,其出现频率记为 q=1−p. 遗传漂移 (genetic drift):如果重组算子引起子代种群中某基因座上的多数基因频率增加 , 即 pt+1>pt, 则称该 重组算子导致基因漂移或遗传漂移.这里,t 表示进化过程的代序列数. 下面分 3 种情况分析广义多父代重组算子的漂移现象,并研究重组规模对漂移速度的影响. 2.1 对称对角交叉 SDC 虽然对随机选择的多个父代个体的基因段进行重组 ,但由于子代个体的数量与父代个体的数量完全 相同 , 重组后 , 每个父代个体的等位基因一定在某个子代的相同基因座上出现 , 因此 , 重组不改变任何等位基因 的频率,不会导致基因漂移. 2.2 非对称对角交叉和均匀扫描交叉 ADC 虽然重组多个父代个体的基因段创建一个子代个体,但由于父代个体的选取是随机事件,子代个体的 基因段到底取自哪一个父代也是随机事件 , 就子代个体的单个基因座而言 , 多数基因的出现频率完全等价于 USC 的情况,可以用相同的方法进行分析. 定理 1. 在应用 ADC 或 USC 时,对任意基因座上的某个等位基因,t+1 时刻的基因频率 pt+1 等于该基因 t 时 刻的基因频率 pt,ADC 和 USC 不引起遗传漂移. 证明:已知重组规模为 r,那么,基因座上某等位基因 t+1 时刻的基因频率 pt+1 为
∗ Supported by the National Natural Science Foundation of China under Grant Nos.50275170, 59835170 (国家自然科学基金 ); the
Science Research Foundation of Education Office of Hu’nan Province of China under Grant No.2002A052 (湖南省教育厅科学研究 基金 ) 第一作者简介 : 郭观七 (1963- ),男 ,湖南岳阳人 ,博士 ,副教授 ,主要研究领域为进化算法 ,自适应控制 ,人工智能 .
1876
Journal of Software
软件学报 2003,14(11)
漂移不但导致种群多样度的急剧下降,而且降低了进化搜索的收敛速度,从而降低了进化搜索的性能. 关键词: 进化算法;遗传漂移;重组 文献标识码: A 中图法分类号: TP18
有性繁殖是自然生物进化的普遍现象 ,模拟这一自然进化现象 , 进化算法使用重组算子组合不同父代个体 的遗传信息 ( 基因 ) 生成可能的优良个体 . 取决于目标问题的特性和候选解的表示方法 , 研究者们提出了大量的 重组算子,例如,一点交叉、两点或多点交叉、均匀交叉、离散重组、中间重组等.近年来,组合多个父代个体的 遗传信息已成为一种常用的重组技术. 在重组算子的理论研究方面 ,Beyer[1] 针对球函数分析了全局重组算子的收敛速度 , 章珂等人 [2] 针对二进制 编码的遗传算法分析了交叉位置的选取对搜索性能的影响 , 张文修等人 [3] 分析了遗传算法交叉算子的几何性 质 .迄今为止 , 重组算子的作用机制和理论分析仍然是进化算法理论研究的最薄弱环节之一 .遗传算法学派基于 模式定理和积木块假设[4]强调重组算子的优点,进化策略学派则基于遗传修复假设[5]应用重组算子. 遗传漂移是指种群均匀地收敛于单一个体的趋势,其起因来自于选择压、 采样误差和基因重组等因素的影 响 . 近年来 , 进化计算中存在的遗传漂移现象已受到研究者们 [6~8] 的关注 . 由于广义多父代重组算子是多种常用 交叉或重组算子的一般化 , 本文以此为研究对象 , 应用基因频率分析方法解析地分析不同重组算子的遗传漂移 现象 , 应用仿真优化验证重组的遗传漂移对进化搜索性能的影响 , 为重组算子的设计和应用提供理论和实验 依据.
recombination, drives the population to converge to a single individual uniformly, thus causing premature stagnation or losing alternative global or local optima. For multi-parent diagonal crossover and scanning crossover are generalizations of the various conventional crossover and recombination operators, genetic drift from which is analyzed theoretically in this paper. By analyzing the frequency of the dominant allele, it is strictly proved that multi-parent diagonal crossover and uniform scanning crossover do not cause a genetic drift, but multi-parent occurrence-based scanning crossover induces a strong genetic drift that augments with the increasing of the number of parents. The simulant genetic optimization shows that the genetic drift induced by multi-parent occurrence-based scanning crossover reduces both the population diversity and the convergence rate, thus deteriorating the performance of an evolutionary search. Key words: 摘 要: evolutionary algorithm; genetic drift; recombination