投资学精要英语(essenfial of investment )计算分析题
投资学精要(博迪)(第五版)习题答案英文版chapter5综述
Essentials of Investments (BKM 5th Ed.Answers to Selected Problems – Lecture 60 –300Purchase of three shares at $100 each. 1 –208Purchase of two shares at $110 less dividend income on three shares held. 2 110 Dividends on five shares plus sale of one share at price of $90 each. 3 396Dividends on four shares plus sale of four shares at price of $95 each. 396|||110 |Date: 1/1/96 1/1/97 1/1/98 1/1/99| || || || 208300The Dollar-weighted return can be determined by doing an internal rate of return (IRRcalculation. In other words, set the present value of the outflows equal to the presentvalue of the inflows (or the net present value to zero: %1661. 0001661. 01(396 1(110 1(208300321−=−=+++=++R R R3. b.5. We need to distinguish between timing and selection abilities. The intercept of the scatterdiagram is a measure of stock selection ability. If the manager tends to have a positive excess return even when the market’s performance is merely ‘neutral’ (i.e., has zero excess return, then we conclude that the manager has on average made good stock picks – stock selection must be the source of the positive excess returns.Timing ability is indicated by curvature in the plotted line. Lines that become steeper as you move to the right of the graph show good timing ability. An upward curvedrelationship indicates that the portfolio was more sensitive to market moves when the market was doing well and less sensitive to market moves when the market was doingpoorly -- this indicates good market timing skill. A downward curvature would indicate poor market timing skill.We can therefore classify performance ability for the four managers as follows:a. Bad Goodb. Good Goodc. Good Badd. Bad Bad9. The manager’s alpha is:10 - [6 + 0.5(14-6] = 010. a α(A = 24 - [12 + 1.0(21-12] = 3.0%α(B = 30 - [12 + 1.5(21-12] = 4.5%T(A = (24 - 12/1 = 12T(B = (30-12/1.5 = 12As an addition to a passive diversified portfolio, both A and B are candidates because they both have positive alphas.b (i The funds may have been trying to time the market. In that case, the SCL of the funds may be non-linear (curved.(ii One year’s worth of data is too small a sample to make clear conclusions.(iii The funds may have significantly different levels of diversification. If both have the same risk-adjusted return, the fund with the less diversified portfolio has a higher exposure to risk because of its higher firm-specific risk. Since the above measure adjusts only for systematic risk, it does not tell the entire story.11. a Indeed, the one year results were terrible, but one year is a short time period from whichto make clear conclusions. Also, the Board instructed the manager to give priority to long-term results.b The sample pension funds had a much larger share in equities compared to Alpine’s. Equities performed much better than bonds. Also, Alpine was told to hold down risk investing at most 25% in equities. Alpine should not be held responsible for an asset allocation policy dictated by the client.c Alpine’s alpha measures its risk-adjusted performance compared to the market’s:α = 13.3 - [7.5 + 0.9(13.8 - 7.5] = 0.13%, which is actually above zero!d Note that the last five years, especially the last one, have been bad for bonds – and Alpine was encouraged to hold bonds. Within this asset class, Alpine did much better than the index funds. Alpine’s performance within each asset class has been superior on a risk-adjusted basis. Its disappointing performance overall was due to a heavy asset allocation weighting toward bonds, which was the Board’s –not Alpine’s – choice.e A trustee may not care about the time-weighted return, but that return is moreindicative of the manager’s performance. After all, the manager has no control over the cash inflow of the fund.。
投资学精要(博迪)(第五版)习题答案英文版chapter9&10
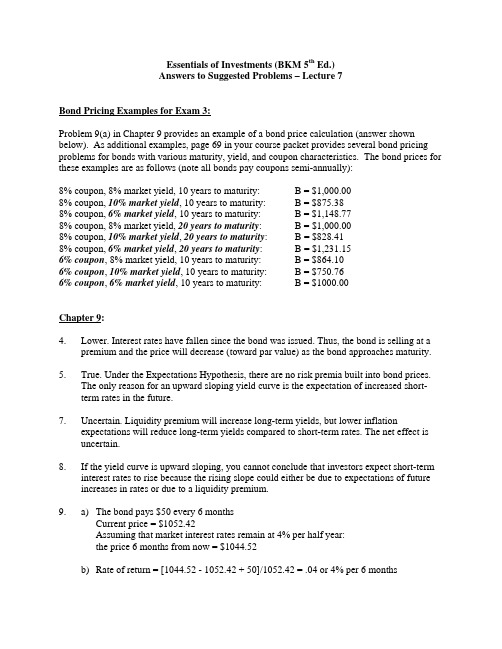
Essentials of Investments (BKM 5th Ed.)Answers to Suggested Problems – Lecture 7Bond Pricing Examples for Exam 3:Problem 9(a) in Chapter 9 provides an example of a bond price calculation (answer shown below). As additional examples, page 69 in your course packet provides several bond pricing problems for bonds with various maturity, yield, and coupon characteristics. The bond prices for these examples are as follows (note all bonds pay coupons semi-annually):8% coupon, 8% market yield, 10 years to maturity: B = $1,000.008% coupon, 10% market yield, 10 years to maturity: B = $875.388% coupon, 6% market yield, 10 years to maturity: B = $1,148.778% coupon, 8% market yield, 20 years to maturity: B = $1,000.008% coupon, 10% market yield, 20 years to maturity: B = $828.418% coupon, 6% market yield, 20 years to maturity: B = $1,231.156% coupon, 8% market yield, 10 years to maturity: B = $864.106% coupon, 10% market yield, 10 years to maturity: B = $750.766% coupon, 6% market yield, 10 years to maturity: B = $1000.00Chapter 9:4. Lower. Interest rates have fallen since the bond was issued. Thus, the bond is selling at apremium and the price will decrease (toward par value) as the bond approaches maturity.5. True. Under the Expectations Hypothesis, there are no risk premia built into bond prices.The only reason for an upward sloping yield curve is the expectation of increased short-term rates in the future.7. Uncertain. Liquidity premium will increase long-term yields, but lower inflationexpectations will reduce long-term yields compared to short-term rates. The net effect is uncertain.8. If the yield curve is upward sloping, you cannot conclude that investors expect short-terminterest rates to rise because the rising slope could either be due to expectations of future increases in rates or due to a liquidity premium.9. a) The bond pays $50 every 6 monthsCurrent price = $1052.42Assuming that market interest rates remain at 4% per half year:the price 6 months from now = $1044.52b) Rate of return = [1044.52 - 1052.42 + 50]/1052.42 = .04 or 4% per 6 months14. Zero 8% coupon 10% coupona) Current prices $463.19 $1,000 $1,134.20b) Price in 1 year $500.25 $1,000 $1,124.94change $37.06 $0.00 $-9.26PriceCouponincome $0.00 $80.00 $100.00$37.06 $80.00 $90.74incomeTotalRate of return 8.00% 8.00% 8.00%33. a) The forward rate, f, is the rate that makes rolling over one-year bonds equally attractiveas investing in the two-year maturity bond and holding until maturity:(1.08)(1 + f) = (1.09)2 which implies that f = 0.1001 or 10.01%b) According to the expectations hypothesis, the forward rate equals the expected shortrate next year, so the best guess would be 10.01%.c) According to the liquidity preference (liquidity premium) hypothesis, the forward rateexceeds the expected short-term rate for next year (by the amount of the liquiditypremium), so the best guess would be less than 10.01%.35. a. We obtain forward rates from the following table:Maturity(years)YTM Forward rate Price (for part c)($1000/1.10)1 10.0% $909.09[(1.112/1.10) – 1] $811.62 ($1000/1.112)12.01%2 11.0%[(1.123/1.112) – 1] $711.78 ($1000/1.123)14.03%3 12.0%b. We obtain next year’s prices and yields by discounting each zero’s face value at theforward rates derived in part (a):Maturity(years)Price YTM1 $892.78 [ = 1000/1.1201] 12.01%2 $782.93 [ = 1000/(1.1201 x 1.1403)] 13.02%Note that this year’s upward sloping yield curve implies, according to theexpectations hypothesis, a shift upward in next year’s curve.c.Next year, the two-year zero will be a one-year zero, and it will therefore sell at: ($1000/1.1201) = $892.78Similarly, the current three-year zero will be a two-year zero, and it will sell for $782.93. Expected total rate of return:two-year bond: %00.101000.0162.811$78.892$==− three-year bond: %00.101000.0178.711$93.782$==−37. d) 2e) 3f) 2g) 4Chapter 10:1. ∆∆B B D y y =−⋅+1 -7.194 * (.005/1.10) = -.03272.If YTM=6%, Duration=2.833 years If YTM=10%, Duration=2.824 years6.a) Bond B has a higher yield since it is selling at a discount. Thus, the duration of bond B is lower (it is less sensitive to interest rate changes).b) Bond B has a lower yield and is callable before maturity. Thus, the duration of bond B is lower (it is less sensitive to interest rate changes).9.a) PV = 10,000/(1.08) + 10,000/((1.08)2) = $17,832.65Duration = (9259.26/17832.65)*1 + (8573.39/17832.65)*2 = 1.4808 yearsb) A zero-coupon bond with 1.4808 years to maturity (duration=1.4808) would immunize the obligation against interest rate risk.c) We need a bond position with a present value of $17,832.65. Thus, the face value of thebond position must be:$17,832.65*(1.08)1.4808 = $19,985.26If interest rates increase to 9%, the value of the bond would be:$19,985.26/((1.09)1.4808) = $17,590.92The tuition obligation would be:10,000/1.09 + 10,000/((1.09)2) = $17,591.11or a net position change of only $0.19.If interest rates decrease to 7%, the value of the bond would be:$19,985.26/((1.07)1.4808) = $18,079.99The tuition obligation would be:10,000/(1.07) + 10,000((1.07)2) = $18,080.18or a net position change of $0.19.**The slight differences result from the fact that duration is only a linear approximationof the true convex relationship between fixed-income values and interest rates.11. a) The duration of the perpetuity is 1.05/.05 = 21 years. Let w be the weight of the zero-coupon bond. Then we find w by solving:w × 5 + (1 – w) × 21 = 1021 – 16w = 10w = 11/16 or .6875Therefore, your portfolio would be 11/16 invested in the zero and 5/16 in theperpetuity.b) The zero-coupon bond now will have a duration of 4 years while the perpetuity willstill have a 21-year duration. To get a portfolio duration of 9 years, which is now theduration of the obligation, we again solve for w:w × 4 + (1 – w) × 21 = 921 – 17w = 9w = 12/17 or .7059So the proportion invested in the zero has to increase to 12/17 and the proportion in theperpetuity has to fall to 5/17.12. a) The duration of the perpetuity is 1.1/.1 = 11 years. The present value of the payments is$1 million/.10 = $10 million. Let w be the weight of the 5-year zero-coupon bond andtherefore (1 – w) will be the weight of the 20-year zero-coupon bond. Then we find wby solving:w × 5 + (1 – w) × 20 = 1120 – 15w = 11w = 9/15 = .60Therefore, 60% of the portfolio will be invested in the 5-year zero-coupon bond and 40%in the 20-year zero-coupon bond.Therefore, the market value of the 5-year zero must be×.60 = $6 million.$10millionSimilarly, the market value of the 20-year zero must be$10× .40 = $4 millionmillionb) Face value of the 5-year zero-coupon bond will be× (1.10)5 = $9.66 million.$6millionFace value of the 20-year zero-coupon bond will be$4 million × (1.10)20 = $26.91 million.18. a) 4b) 4c)42d)21. Note that we did not discuss swaps in detail. For that reason, I would not expect you to beable to answer this type of question on the exam. The question is meant to provide youwith a brief summary of some potential motivations for swaps.a) a. This swap would have been made if the investor anticipated a decline in long-terminterest rates and an increase in long-term bond prices. The deeper discount, lowercoupon 6 3/8% bond would provide more opportunity for capital gains, greater callprotection, and greater protection against declining reinvestment rates at a cost of only amodest drop in yield.b. This swap was probably done by an investor who believed the 24 basis point yield spreadbetween the two bonds was too narrow. The investor anticipated that, if the spreadwidened to a more normal level, either a capital gain would be experienced on theTreasury note or a capital loss would be avoided on the Phone bond, or both. Also, thisswap might have been done by an investor who anticipated a decline in interest rates, andwho also wanted to maintain high current coupon income and have the better callprotection of the Treasury note. The Treasury note would have unlimited potential forprice appreciation, in contrast to the Phone bond which would be restricted by its callprice. Furthermore, if intermediate-term interest rates were to rise, the price decline ofthe higher quality, higher coupon Treasury note would likely be “cushioned” and thereinvestment return from the higher coupons would likely be greater.c. This swap would have been made if the investor were bearish on the bond market. Thezero coupon note would be extremely vulnerable to an increase in interest rates since theyield to maturity, determined by the discount at the time of purchase, is locked in. This isin contrast to the floating rate note, for which interest is adjusted periodically to reflectcurrent returns on debt instruments. The funds received in interest income on the floatingrate notes could be used at a later time to purchase long-term bonds at more attractiveyields.d. These two bonds are similar in most respects other than quality and yield. An investorwho believed the yield spread between Government and Al bonds was too narrow wouldhave made the swap either to take a capital gain on the Government bond or to avoid acapital loss on the Al bond. The increase in call protection after the swap would not be afactor except under the most bullish interest rate scenarios. The swap does, however,extend maturity another 8 years and yield to maturity sacrifice is 169 basis points.e. The principal differences between these two bonds are the convertible feature of the Zmart bond and the yield and coupon advantage, and the longer maturity of the LuckyDucks debentures. The swap would have been made if the investor believed somecombination of the following: First, that the appreciation potential of the Z martconvertible, based primarily on the intrinsic value of Z mart common stock, was nolonger as attractive as it had been. Second, that the yields on long-term bonds were at acyclical high, causing bond portfolio managers who could take A2-risk bonds to reach forhigh yields and long maturities either to lock them in or take a capital gain when ratessubsequently declined. Third, while waiting for rates to decline, the investor will enjoyan increase in coupon income. Basically, the investor is swapping an equity-equivalentfor a long- term corporate bond.23. Choose the longer-duration bond to benefit from a rate decrease.a) The Aaa-rated bond will have the lower yield to maturity and the longer duration.b) The lower-coupon bond will have the longer duration and more de facto call protection.c) Choose the lower coupon bond for its longer duration.30. The price of the 7% bond in 5 years is:PVA(C=$70, N=25, r=8%) + PV($1000, N=25, r=8%) = $893.25You also get five $70 coupon payments four of which can be reinvested at 6% for a total of $394.59 in coupon income.HPR = ($893.25 - 867.42 + 394.59)/867.42 = 48.47%The price of the 6.5% bond in 5 years is:PVA(C=$65, N=15, r=7.5%) + PV($1000, N=15, r=7.5%) = $911.73You also get five $65 coupon payments four of which can be reinvested at 6% for a total of $366.41 in coupon income.HPR = ($911.73 - 879.50 + 366.41)/879.50 = 45.33%**The 7% bond has a higher 5-year holding period return.。
Essentials_Of_Investments_8th_Ed_Bodie_投资学精要(第八版)课后习题答案 Chapter 7
2 32 2.00 5 20
3.5 14 0.70 5 20
b. With the two scenarios equal likely, the expected rate of return is an average of the two possible outcomes: E(rA) = 0.5 (2% + 32%) = 17% E(rB) = 0.5 (3.5% + 14%) = 8.75% c. The SML is determined by the following: T-bill rate = 8% with a beta equal to zero, beta for the market is 1.0, and the expected rate of return for the market is: 0.5 (20% + 5%) = 12.5% See the following graph.
P = (0.75 1) + (0.25 0) = 0.75
8. a. The beta is the sensitivity of the stock's return to the market return. Call the aggressive stock A and the defensive stock D. Then beta is the change in the stock return per unit change in the market return. We compute each stock's beta by calculating the difference in its return across the two scenarios divided by the difference in market return. A
投资学精要习题答案

投资学精要习题答案投资学精要习题答案投资学是研究资本市场和投资决策的学科,是金融学的重要分支之一。
在学习投资学过程中,习题是巩固知识和提高能力的重要途径。
下面是一些投资学精要习题的答案,希望对你的学习有所帮助。
一、基本概念题1. 什么是投资学?投资学是研究资本市场和投资决策的学科,通过分析投资者的行为和市场的运作,帮助投资者做出理性的投资决策。
2. 什么是资本市场?资本市场是指进行长期融资和证券交易的市场,包括股票市场和债券市场。
3. 什么是投资组合?投资组合是指将不同的资产按照一定比例组合在一起,以实现风险和收益的最优平衡。
4. 什么是投资回报率?投资回报率是指投资所获得的收益与投资成本之比,是衡量投资绩效的指标。
5. 什么是风险和收益?风险是指投资可能面临的损失或波动性,收益是指投资所能获得的回报。
二、计算题1. 计算投资回报率投资回报率=(投资收益-投资成本)/投资成本2. 计算资本资产定价模型(CAPM)的预期回报率预期回报率=无风险利率+β×(市场回报率-无风险利率)3. 计算夏普比率夏普比率=(投资组合回报率-无风险利率)/投资组合的波动性4. 计算投资组合的方差投资组合的方差=∑(Wi×σi)^2其中,Wi为资产i的权重,σi为资产i的标准差。
5. 计算投资组合的预期回报率预期回报率=∑(Wi×E(Ri))其中,Wi为资产i的权重,E(Ri)为资产i的预期回报率。
三、案例分析题1. 根据给定的资产预期回报率和标准差,构建一个投资组合,使得预期回报率最大,同时风险最小。
解:可以使用马科维茨投资组合理论来解决这个问题。
根据理论,投资者可以通过调整不同资产的权重来构建一个最佳的投资组合。
具体的计算方法可以使用线性规划等数学方法来求解。
2. 假设你有100万的投资资金,你打算将其分配到不同的资产上,如股票、债券、房地产等。
请给出一个合理的资产配置方案,并解释你的选择。
(完整word版)投资学investment_题库Chap016

Multiple Choice Questions1。
The duration of a bond is a function of the bond'sA) coupon rate.B)yield to maturity。
C)time to maturity.D) all of the above。
E)none of the above.Answer: D Difficulty: EasyRationale: Duration is calculated by discounting the bond's cash flows at thebond’s yield to maturity and, except for zero—coupon bonds, is always less than time to maturity.2. Ceteris paribus, the duration of a bond is positively correlated with the bond'sA)time to maturity。
B)coupon rate.C) yield to maturity.D) all of the above。
E)none of the above.Answer: A Difficulty: ModerateRationale: Duration is negatively correlated with coupon rate and yield tomaturity.3. Holding other factors constant, the interest—rate risk of a coupon bond is higherwhen the bond's:A)term—to—maturity is lower。
B) coupon rate is higher.C)yield to maturity is lower.D)current yield is higher。
Essentials Of Investments 8th Ed Bodie 投资学精要(第八版)课后习题答案Chap007
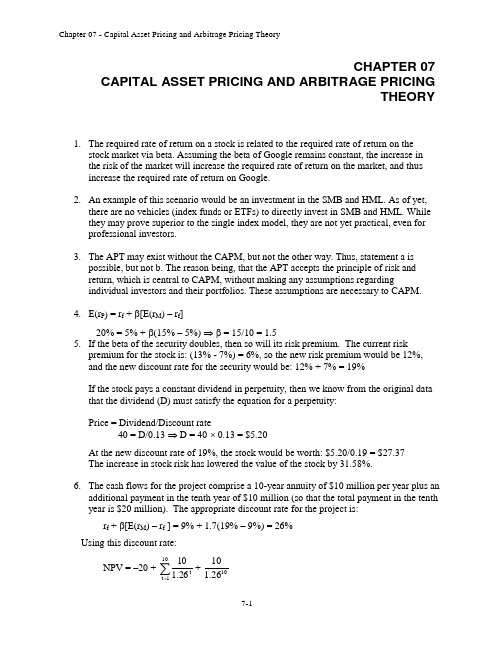
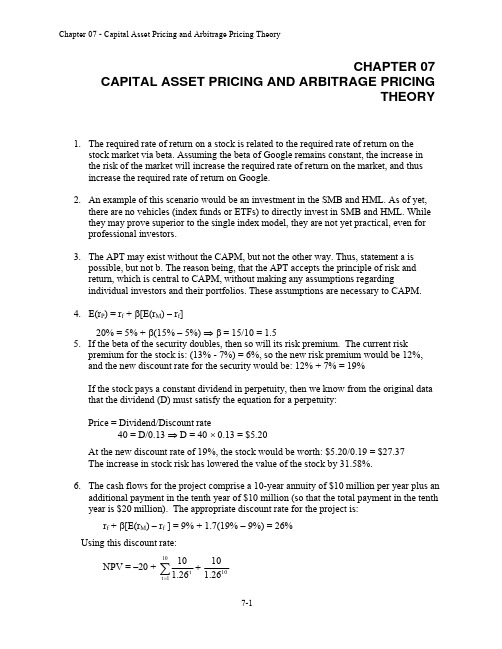
CHAPTER 07CAPITAL ASSET PRICING AND ARBITRAGE PRICINGTHEORY1. The required rate of return on a stock is related to the required rate of return on thestock market via beta. Assuming the beta of Google remains constant, the increase in the risk of the market will increase the required rate of return on the market, and thus increase the required rate of return on Google.2. An example of this scenario would be an investment in the SMB and HML. As of yet,there are no vehicles (index funds or ETFs) to directly invest in SMB and HML. While they may prove superior to the single index model, they are not yet practical, even for professional investors.3. The APT may exist without the CAPM, but not the other way. Thus, statement a ispossible, but not b. The reason being, that the APT accepts the principle of risk and return, which is central to CAPM, without making any assumptions regardingindividual investors and their portfolios. These assumptions are necessary to CAPM.4. E(r P ) = r f + β[E(r M ) – r f ]20% = 5% + β(15% – 5%) ⇒ β = 15/10 = 1.55. If the beta of the security doubles, then so will its risk premium. The current riskpremium for the stock is: (13% - 7%) = 6%, so the new risk premium would be 12%, and the new discount rate for the security would be: 12% + 7% = 19%If the stock pays a constant dividend in perpetuity, then we know from the original data that the dividend (D) must satisfy the equation for a perpetuity:Price = Dividend/Discount rate 40 = D/0.13 ⇒ D = 40 ⨯ 0.13 = $5.20 At the new discount rate of 19%, the stock would be worth: $5.20/0.19 = $27.37The increase in stock risk has lowered the value of the stock by 31.58%.6. The cash flows for the project comprise a 10-year annuity of $10 million per year plus anadditional payment in the tenth year of $10 million (so that the total payment in the tenth year is $20 million). The appropriate discount rate for the project is:r f + β[E(r M ) – r f ] = 9% + 1.7(19% – 9%) = 26% Using this discount rate:NPV = –20 + +∑=101t t26.1101026.110= –20 + [10 ⨯ Annuity factor (26%, 10 years)] + [10 ⨯ PV factor (26%, 10 years)] = 15.64The internal rate of return on the project is 49.55%. The highest value that beta can take before the hurdle rate exceeds the IRR is determined by:49.55% = 9% + β(19% – 9%) ⇒ β = 40.55/10 = 4.055 7. a. False. β = 0 implies E(r) = r f , not zero.b. False. Investors require a risk premium for bearing systematic (i.e., market orundiversifiable) risk.c. False. You should invest 0.75 of your portfolio in the market portfolio, and theremainder in T-bills. Then: βP = (0.75 ⨯ 1) + (0.25 ⨯ 0) = 0.758.a. The beta is the sensitivity of the stock's return to the market return. Call theaggressive stock A and the defensive stock D . Then beta is the change in the stock return per unit change in the market return. We compute each stock's beta by calculating the difference in its return across the two scenarios divided by the difference in market return.00.2205322A =--=β70.0205145.3D =--=βb. With the two scenarios equal likely, the expected rate of return is an average ofthe two possible outcomes: E(r A ) = 0.5 ⨯ (2% + 32%) = 17%E(r B ) = 0.5 ⨯ (3.5% + 14%) = 8.75%c. The SML is determined by the following: T-bill rate = 8% with a beta equal tozero, beta for the market is 1.0, and the expected rate of return for the market is:0.5 ⨯ (20% + 5%) = 12.5%See the following graph.812.5%S M LThe equation for the security market line is: E(r) = 8% + β(12.5% – 8%) d. The aggressive stock has a fair expected rate of return of:E(r A ) = 8% + 2.0(12.5% – 8%) = 17%The security analyst’s estimate of the expected rate of return is also 17%.Thus the alpha for the aggressive stock is zero. Similarly, the required return for the defensive stock is:E(r D ) = 8% + 0.7(12.5% – 8%) = 11.15%The security analyst’s estimate of the expected return for D is only 8.75%, and hence:αD = actual expected return – required return predicted by CAPM= 8.75% – 11.15% = –2.4%The points for each stock are plotted on the graph above.e. The hurdle rate is determined by the project beta (i.e., 0.7), not by the firm’sbeta. The correct discount rate is therefore 11.15%, the fair rate of return on stock D.9. Not possible. Portfolio A has a higher beta than Portfolio B, but the expected returnfor Portfolio A is lower.10. Possible. If the CAPM is valid, the expected rate of return compensates only forsystematic (market) risk as measured by beta, rather than the standard deviation, which includes nonsystematic risk. Thus, Portfolio A's lower expected rate of return can be paired with a higher standard deviation, as long as Portfolio A's beta is lower than that of Portfolio B.11. Not possible. The reward-to-variability ratio for Portfolio A is better than that of themarket, which is not possible according to the CAPM, since the CAPM predicts that the market portfolio is the most efficient portfolio. Using the numbers supplied:S A =5.0121016=- S M =33.0241018=-These figures imply that Portfolio A provides a better risk-reward tradeoff than the market portfolio.12. Not possible. Portfolio A clearly dominates the market portfolio. It has a lowerstandard deviation with a higher expected return.13. Not possible. Given these data, the SML is: E(r) = 10% + β(18% – 10%)A portfolio with beta of 1.5 should have an expected return of: E(r) = 10% + 1.5 ⨯ (18% – 10%) = 22%The expected return for Portfolio A is 16% so that Portfolio A plots below the SML (i.e., has an alpha of –6%), and hence is an overpriced portfolio. This is inconsistent with the CAPM.14. Not possible. The SML is the same as in Problem 12. Here, the required expectedreturn for Portfolio A is: 10% + (0.9 ⨯ 8%) = 17.2%This is still higher than 16%. Portfolio A is overpriced, with alpha equal to: –1.2%15. Possible. Portfolio A's ratio of risk premium to standard deviation is less attractivethan the market's. This situation is consistent with the CAPM. The market portfolio should provide the highest reward-to-variability ratio.16.a.b.As a first pass we note that large standard deviation of the beta estimates. None of the subperiod estimates deviate from the overall period estimate by more than two standard deviations. That is, the t-statistic of the deviation from the overall period is not significant for any of the subperiod beta estimates. Looking beyond the aforementioned observation, the differences can be attributed to different alpha values during the subperiods. The case of Toyota is most revealing: The alpha estimate for the first two years is positive and for the last two years negative (both large). Following a good performance in the "normal" years prior to the crisis, Toyota surprised investors with a negative performance, beyond what could be expected from the index. This suggests that a beta of around 0.5 is more reliable. The shift of the intercepts from positive to negative when the index moved to largely negative returns, explains why the line is steeper when estimated for the overall period. Draw a line in the positive quadrant for the index with a slope of 0.5 and positive intercept. Then draw a line with similar slope in the negative quadrant of the index with a negative intercept. You can see that a line that reconciles the observations for both quadrants will be steeper. The same logic explains part of the behavior of subperiod betas for Ford and GM.17. Since the stock's beta is equal to 1.0, its expected rate of return should be equal to thatof the market, that is, 18%. E(r) =01P P P D -+0.18 =100100P 91-+⇒ P 1 = $10918. If beta is zero, the cash flow should be discounted at the risk-free rate, 8%:PV = $1,000/0.08 = $12,500If, however, beta is actually equal to 1, the investment should yield 18%, and the price paid for the firm should be:PV = $1,000/0.18 = $5,555.56The difference ($6944.44) is the amount you will overpay if you erroneously assume that beta is zero rather than 1.ing the SML: 6% = 8% + β(18% – 8%) ⇒β = –2/10 = –0.220.r1 = 19%; r2 = 16%; β1 = 1.5; β2 = 1.0a.In order to determine which investor was a better selector of individual stockswe look at the abnormal return, which is the ex-post alpha; that is, the abnormalreturn is the difference between the actual return and that predicted by the SML.Without information about the parameters of this equation (i.e., the risk-free rateand the market rate of return) we cannot determine which investment adviser isthe better selector of individual stocks.b.If r f = 6% and r M = 14%, then (using alpha for the abnormal return):α1 = 19% – [6% + 1.5(14% – 6%)] = 19% – 18% = 1%α2 = 16% – [6% + 1.0(14% – 6%)] = 16% – 14% = 2%Here, the second investment adviser has the larger abnormal return and thusappears to be the better selector of individual stocks. By making betterpredictions, the second adviser appears to have tilted his portfolio toward under-priced stocks.c.If r f = 3% and r M = 15%, then:α1 =19% – [3% + 1.5(15% – 3%)] = 19% – 21% = –2%α2 = 16% – [3%+ 1.0(15% – 3%)] = 16% – 15% = 1%Here, not only does the second investment adviser appear to be a better stockselector, but the first adviser's selections appear valueless (or worse).21.a.Since the market portfolio, by definition, has a beta of 1.0, its expected rate ofreturn is 12%.b.β = 0 means the stock has no systematic risk. Hence, the portfolio's expectedrate of return is the risk-free rate, 4%.ing the SML, the fair rate of return for a stock with β= –0.5 is:E(r) = 4% + (–0.5)(12% – 4%) = 0.0%The expected rate of return, using the expected price and dividend for next year: E(r) = ($44/$40) – 1 = 0.10 = 10%Because the expected return exceeds the fair return, the stock must be under-priced.22.The data can be summarized as follows:ing the SML, the expected rate of return for any portfolio P is:E(r P) = r f + β[E(r M) – r f ]Substituting for portfolios A and B:E(r A) = 6% + 0.8 ⨯ (12% – 6%) = 10.8%E(r B) = 6% + 1.5 ⨯ (12% – 6%) = 15.0%Hence, Portfolio A is desirable and Portfolio B is not.b.The slope of the CAL supported by a portfolio P is given by:S =P fP σr)E(r-Computing this slope for each of the three alternative portfolios, we have:S (S&P 500) = 6/20S (A) = 5/10S (B) = 8/31Hence, portfolio A would be a good substitute for the S&P 500.23.Since the beta for Portfolio F is zero, the expected return for Portfolio F equals therisk-free rate.For Portfolio A, the ratio of risk premium to beta is: (10% - 4%)/1 = 6%The ratio for Portfolio E is higher: (9% - 4%)/(2/3) = 7.5%This implies that an arbitrage opportunity exists. For instance, you can create aPortfolio G with beta equal to 1.0 (the same as the beta for Portfolio A) by taking a long position in Portfolio E and a short position in Portfolio F (that is, borrowing at the risk-free rate and investing the proceeds in Portfolio E). For the beta of G to equal 1.0, theproportion (w) of funds invested in E must be: 3/2 = 1.5The expected return of G is then:E(r G) = [(-0.50) ⨯ 4%] + (1.5 ⨯ 9%) = 11.5%βG = 1.5 ⨯ (2/3) = 1.0Comparing Portfolio G to Portfolio A, G has the same beta and a higher expected return.Now, consider Portfolio H, which is a short position in Portfolio A with the proceedsinvested in Portfolio G:βH = 1βG + (-1)βA = (1 ⨯ 1) + [(-1) ⨯ 1] = 0E(r H) = (1 ⨯ r G) + [(-1) ⨯ r A] = (1 ⨯ 11.5%) + [(- 1) ⨯ 10%] = 1.5%The result is a zero investment portfolio (all proceeds from the short sale of Portfolio Aare invested in Portfolio G) with zero risk (because β = 0 and the portfolios are welldiversified), and a positive return of 1.5%. Portfolio H is an arbitrage portfolio.24.Substituting the portfolio returns and betas in the expected return-beta relationship, weobtain two equations in the unknowns, the risk-free rate (r f ) and the factor return (F):14.0% = r f + 1 ⨯ (F – r f )14.8% = r f + 1.1 ⨯ (F – r f )From the first equation we find that F = 14%. Substituting this value for F into the second equation, we get:14.8% = r f + 1.1 ⨯ (14% – r f ) ⇒ r f = 6%25.a.Shorting equal amounts of the 10 negative-alpha stocks and investing the proceedsequally in the 10 positive-alpha stocks eliminates the market exposure and creates azero-investment portfolio. Using equation 7.5, and denoting the market factor as R M,the expected dollar return is [noting that the expectation of residual risk (e) inequation 7.8 is zero]:$1,000,000 ⨯ [0.03 + (1.0 ⨯ R M)] – $1,000,000 ⨯ [(–0.03) + (1.0 ⨯ R M)]= $1,000,000 ⨯ 0.06 = $60,000The sensitivity of the payoff of this portfolio to the market factor is zero because theexposures of the positive alpha and negative alpha stocks cancel out. (Notice thatthe terms involving R M sum to zero.) Thus, the systematic component of total riskalso is zero. The variance of the analyst's profit is not zero, however, since thisportfolio is not well diversified.For n = 20 stocks (i.e., long 10 stocks and short 10 stocks) the investor will have a$100,000 position (either long or short) in each stock. Net market exposure is zero,but firm-specific risk has not been fully diversified. The variance of dollar returnsfrom the positions in the 20 firms is:20 ⨯ [(100,000 ⨯ 0.30)2] = 18,000,000,000The standard deviation of dollar returns is $134,164.b.If n = 50 stocks (i.e., 25 long and 25 short), $40,000 is placed in each position,and the variance of dollar returns is:50 ⨯ [(40,000 ⨯ 0.30)2] = 7,200,000,000The standard deviation of dollar returns is $84,853.Similarly, if n = 100 stocks (i.e., 50 long and 50 short), $20,000 is placed ineach position, and the variance of dollar returns is:100 ⨯ [(20,000 ⨯ 0.30)2] = 3,600,000,000The standard deviation of dollar returns is $60,000.Notice that when the number of stocks increases by a factor of 5 (from 20 to 100),standard deviation falls by a factor of 5= 2.236, from $134,164 to $60,000. 26.Any pattern of returns can be "explained" if we are free to choose an indefinitely largenumber of explanatory factors. If a theory of asset pricing is to have value, it mustexplain returns using a reasonably limited number of explanatory variables (i.e.,systematic factors).27.The APT factors must correlate with major sources of uncertainty, i.e., sources ofuncertainty that are of concern to many investors. Researchers should investigatefactors that correlate with uncertainty in consumption and investment opportunities.GDP, the inflation rate and interest rates are among the factors that can be expected to determine risk premiums. In particular, industrial production (IP) is a good indicator of changes in the business cycle. Thus, IP is a candidate for a factor that is highlycorrelated with uncertainties related to investment and consumption opportunities in the economy.28.The revised estimate of the expected rate of return of the stock would be the oldestimate plus the sum of the unexpected changes in the factors times the sensitivitycoefficients, as follows:Revised estimate = 14% + [(1 ⨯ 1) + (0.4 ⨯ 1)] = 15.4%29.Equation 7.11 applies here:E(r P) = r f + βP1[E(r1) - r f] + βP2[E(r2) – r f]We need to find the risk premium for these two factors:γ1 = [E(r1) - r f] andγ2 = [E(r2) - r f]To find these values, we solve the following two equations with two unknowns: 40% = 7% + 1.8γ1 + 2.1γ210% = 7% + 2.0γ1 + (-0.5)γ2The solutions are: γ1 = 4.47% and γ2 = 11.86%Thus, the expected return-beta relationship is:E(r P) = 7% + 4.47βP1 + 11.86βP230.The first two factors (the return on a broad-based index and the level of interest rates)are most promising with respect to the likely impa ct on Jennifer’s firm’s cost of capital.These are both macro factors (as opposed to firm-specific factors) that can not bediversified away; consequently, we would expect that there is a risk premiumassociated with these factors. On the other hand, the risk of changes in the price ofhogs, while important to some firms and industries, is likely to be diversifiable, andtherefore is not a promising factor in terms of its impact on the firm’s cost of capital.31.Since the risk free rate is not given, we assume a risk free rate of 0%. The APT required(i.e., equilibrium) rate of return on the stock based on Rf and the factor betas is:Required E(r) = 0 + (1 x 6) + (0.5 x 2) + (0.75 x 4) = 10%According to the equation for the return on the stock, the actually expected return onthe stock is 6 % (because the expected surprises on all factors are zero by definition).Because the actually expected return based on risk is less than the equilibrium return,we conclude that the stock is overpriced.CFA 1a, c and dCFA 2a.E(r X) = 5% + 0.8(14% – 5%) = 12.2%αX = 14% – 12.2% = 1.8%E(r Y) = 5% + 1.5(14% – 5%) = 18.5%αY = 17% – 18.5% = –1.5%b.(i)For an investor who wants to add this stock to a well-diversified equityportfolio, Kay should recommend Stock X because of its positivealpha, while Stock Y has a negative alpha. In graphical terms, StockX’s expected return/risk profile plots above the SML, while Stock Y’sprofile plots below the SML. Also, depending on the individual riskpreferences of Kay’s clients, Stock X’s lower beta may have abeneficial impact on overall portfolio risk.(ii)For an investor who wants to hold this stock as a single-stock portfolio,Kay should recommend Stock Y, because it has higher forecastedreturn and lower standard deviation than S tock X. Stock Y’s Sharperatio is:(0.17 – 0.05)/0.25 = 0.48Stock X’s Sharpe ratio is only:(0.14 – 0.05)/0.36 = 0.25The market index has an even more attractive Sharpe ratio:(0.14 – 0.05)/0.15 = 0.60However, given the choice between Stock X and Y, Y is superior.When a stock is held in isolation, standard deviation is the relevantrisk measure. For assets held in isolation, beta as a measure of risk isirrelevant. Although holding a single asset in isolation is not typicallya recommended investment strategy, some investors may hold what isessentially a single-asset portfolio (e.g., the stock of their employercompany). For such investors, the relevance of standard deviationversus beta is an important issue.CFA 3a.McKay should borrow funds and i nvest those funds proportionally in Murray’sexisting portfolio (i.e., buy more risky assets on margin). In addition toincreased expected return, the alternative portfolio on the capital market line(CML) will also have increased variability (risk), which is caused by the higherproportion of risky assets in the total portfolio.b.McKay should substitute low beta stocks for high beta stocks in order to reducethe overall beta of York’s portfolio. By reducing the overall portfolio beta,McKay will reduce the systematic risk of the portfolio and therefore theportfolio’s volatility relative to the market. The security market line (SML)suggests such action (moving down the SML), even though reducing beta mayresult in a slight loss of portfolio efficiency unless full diversification ismaintained. York’s primary objective, however, is not to maintain efficiencybut to reduce risk exposure; reducing portfolio beta meets that objective.Because York does not permit borrowing or lending, McKay cannot reduce riskby selling equities and using the proceeds to buy risk free assets (i.e., by lendingpart of the portfolio).CFA 4c.“Both the CAPM and APT require a mean-variance efficient market portfolio.”This statement is incorrect. The CAPM requires the mean-variance efficientportfolio, but APT does not.d.“The CAPM assumes that one specific factor explains security returns but APTdoes not.” This statement is c orrect.CFA 5aCFA 6dCFA 7d You need to know the risk-free rate.CFA 8d You need to know the risk-free rate.CFA 9Under the CAPM, the only risk that investors are compensated for bearing is the riskthat cannot be diversified away (i.e., systematic risk). Because systematic risk(measured by beta) is equal to 1.0 for each of the two portfolios, an investor wouldexpect the same rate of return from each portfolio. Moreover, since both portfolios are well diversified, it does not matter whether the specific risk of the individual securities is high or low. The firm-specific risk has been diversified away from both portfolios. CFA 10b r f = 8% and E(r M) = 16%E(r X) = r f + βX[E(r M) – r f] = 8% + 1.0(16% - 8%) = 16%E(r Y) = r f + βY[E(r M) – r f] = 8% + 0.25(16% - 8%) = 10%Therefore, there is an arbitrage opportunity.CFA 11cCFA 12dCFA 13cInvestors will take on as large a position as possible only if the mis-pricingopportunity is an arbitrage. Otherwise, considerations of risk anddiversification will limit the position they attempt to take in the mis-pricedsecurity.CFA 14d。
投资学精要(博迪)(第五版)习题答案英文版chapter7
投资学精要(博迪)(第五版)习题答案英文版chapter7Essentials of Investments (BKM 5th Ed.)Answers to Selected Problems – Lecture 4Note: The solutions to Example 6.4 and the concept checks are provided in the text.Chapter 6:23. In the regression of the excess return of Stock ABC on the market, the square of thecorrelation coefficient is 0.296, which indicates that 29.6% of the variance of the excesss return of ABC is explained by the market (systematic risk).Chapter 7:3. E(R p) = R f + βp[E(R M) - R f]0.20 = 0.05 + β(0.15 - 0.05)β = 0.15/0.10 = 1.5β=0 implies E(R)=R f, not zero.6. a) False:b) False: Investors of a diversified portfolio require a risk premium for systematic risk. Only thesystematic portion of total risk is compensated.c) False: 75% of the portfolio should be in the market and 25% in T-bills.βp=(0.75 * 1) + (0.25 * 0) = 0.758. Not possible. Portfolio A has a higher beta than B, but a lower expected return.9. Possible. If the CAPM is valid, the expected rate of return compensates only for market risk (beta),rather than for nonsystematic risk. Part of A’s risk may be nonsystematic.10. Not possible. If the CAPM is valid, the market portfolio is the most efficient and a higher reward-to-variability ratio than any other security. In other words, the CML must be better than the CAL for any other security. Here, the slope of the CAL for A is 0.5 while the slope of the CML is 0.33.11. Not possible. Portfolio A clearly dominates the market portfolio with a lower standard deviationand a higher expected return. The CML must be better than the CAL for security A.12. Not possible. Security A has an expected return of 22% based on CAPM and an actual return of16%. Security A is below the SML and is therefore overpriced. It is also clear that security A has a higher beta than the market, but a lower return which is not consistent with CAPM.13. Not possible. Security A has an expected return of 17.2% and an actual return of 16%. Security A isbelow the SML and is therefore overpriced.14. Possible. Portfolio A has a lower expected return and lower standard deviation than the market andthus plots below the CML.17. Using the SML: 6 = 8 + β(18 – 8)β = –2/10 = –.221. The expected return of portfolio F equals the risk-free rate since its beta equals 0. Portfolio A’sratio of risk premium to beta is: (10-4)/1 = 6.0%. You can think of this as the slope of the pricing line for Security A. Portfolio E’s ratio of risk premium to beta is: (9-4)/(2/3) = 7.5%, suggesting that Portfolio E is not on the same pricing line as security A. In other words, there is an arbitrage opportunity here.For example, if you created a new portfolio by investing 1/3in the risk-free security and 2/3 insecurity A, you would have a portfolio with a beta of 2/3 and an expected return equal to (1/3)*4% + (2/3)*10% = 8%. Since this new portfolio has the same beta as security E (2/3) but a lowerexpected return (8% vs. 9%) there is clearly an arbitrage opportunity.26. The APT factors must correlate with major sources of uncertainty in the economy. These factorswould correlate with unexpected changes in consumption and investment opportunities. DNP, the rate of inflation, and interest rates are candidates for factors that can be expected to determine risk premia. Industrial production varies with the business cycle, and thus is a candidate for a factor that is correlated with uncertainties related to investment opportunities in the economy.27. A revised estimate of the rate of return on this stock would be the old estimate plus the sum of the expected changes in the factors multiplied by the sensitivity coefficients to each factor:revised R i = 14% + 1.0(1%) + 0.4(1%) = 15.4%28. E(R P) = r f + βP1[E(R1) - R f] + βP2[E(R2) - R f]Use each security’s sensitivity to the factors to solve for the risk premia on the factors:Portfolio A: 40% = 7% + 1.8γ1 + 2.1γ2Portfolio B: 10% = 7% + 2.0γ1 + (-0.5)γ2Solving these two equations simultaneously gives γ1 = 4.47 and γ2 = 11.88.This gives the following expected return beta relationship for the economy:E(R P) = 0.07 + 4.47βP1 + 11.88βP230. d. From the CAPM, the fair expected return = 8% + 1.25 (15% - 8%) = 16.75%Actually expected return = 17%α = 17% - 16.75% = 0.25%31. d. The risk-free rate34. d. You need to know the risk-free rate. For example, if we assume a risk-free rate of 4%, then the alphaof security R is 2.0% and it lies above the SML. If we assume a risk-free rate of 8%, then the alpha ofsecurity R is zero and it lies on the SML.40. d.。
投资学精要(博迪)(第五版)习题答案英文版chapter3
Essentials of Investments (BKM 5th Ed.)Answers to Selected Problems – Lecture 2Chapter 3:1. a) In addition to the explicit fees of $70,000, FBN appears to have paid an implicit pricein underpricing of the IPO. The underpricing is $3/share or $300,000 total, implyingtotal costs of $370,000.b) No. The underwriters do not capture the part of the costs corresponding to theunderpricing. The underpricing may be a rational marketing strategy. Without it, theunderwriters would need to spend more resources to place the issue with the public.They would then need to charge higher explicit fees to the issuing firm. The issuingfirm may be just as well off paying the implicit issuance cost represented by theunderpricing.2. Potential losses are unlimited due to the fact that, theoretically, there is no limit on the priceincrease of a stock.The stop-buy order limits the losses from the short position. If the stop-buy order can be filled at $128, the maximum possible loss is $8 per share. One should keep in mind, however, that while the stop-buy order is triggered when the stock price hits $128, the order may not be filled at exactly $128.6. a) The market buy order is filled at $50.25 (the best limit-sell order) due to pricepriority.b) The next market buy order would be filled at $51.50 since this is the next best price.c) You should increase your position. There is considerable buying pressure just below $50,meaning that downside risk is limited. In contrast, limit sell orders are sparse,meaning that a moderate buy order could result in a substantial price increase.7. a) Buy 200 shares of Telecom at $50/share = $10,000.Sell 200 shares of Telecom at $50*(1.1) = $11,000.Pay interest of $5,000 * .08 = $400.Your Holding Period Return (HPR) = ($11,000 - 10,000 - 400)/$5,000 = 12%b) Ignoring the interest payment,Margin = (Value of Securities - Loan)/Value of Securities0.30 = (200*P - $5,000)/200*P or P = $35.719. Cost of purchase is $40 x 500 = $20,000. You borrow $5000 from your broker, and invest $15,000of your own funds. Your margin account starts out with a net worth of $15,000.a. (i) Net worth rises by $2,000 from $15,000 to $44 × 500 – $5,000 = $17,000.Percentage gain = $2,000/$15,000 = .133 = 13.3%(ii) With unchanged price, net worth remains unchanged.Percentage gain = zero(iii) Net worth falls to $36 × 500 – $5,000 = $13,000.Percentage gain = –$2,000/$15,000 = –.133 = –13.3%The relationship between the percentage change in the price of the stock and the investor’s percentage gain is given by:% gain = % change in price × Total investment investor's initial equity = % change in price × 1.33For example, when the stock price rises from 40 to 44, the percentage change in price is 10%, while the percentage gain for the investor is 1.33 times as large, 13.3%:% gain = 10% × $20,000$15,000 = 13.3%b. The value of the 500 shares is 500P. Equity is 500P – 5000. You will receive a margin call when500P-5000500P = .25 or when P = $13.33.c. The value of the 500 shares is 500P. But now you have borrowed $10,000 instead of $5,000. Therefore, equity is only 500P – $10,000. You will receive a margin call when500P-10,000500P = .25 or when P = $26.67.With less equity in the account, you are far more vulnerable to a margin call.d. The margin loan with accumulated interest after one year is $5,000 x 1.08 = $5,400. Therefore, equity in your account is 500P – $5,400. Initial equity was $15,000. Therefore, your rate of return after one year is as follows:(i) (500 × $44 – $5400) – $15,00015,000= .1067, or 10.67%.(ii) (500 × $40 – $5400) – $15,00015,000= –.0267, or –2.67%.(iii) (500 × $36 – $5400) – $15,00015,000= –.160, or –16.0%.The relationship between the percentage change in the price of Intel and investor’s percentage return is given by:% gain = % change in price x Total investment investor's initial equity – 8% x Funds borrowed Initial net worthFor example, when the stock price rises from 40 to 44, the percentage change in price is 10%, while the percentage gain for the investor is10% × 20,00015,000 – 8% × 500015,000 = 10.67%e. The value of the 500 shares is 500P. Equity is 500P – 5,400. You will receive a margin call when500P – 5400500P= .25 or when P = $14.4010. a)The gain or loss on the short position is –500 x ∆P. Invested funds are $15,000.Therefore the rate of return = (-500 x ∆P)/15,000. The returns in each of the threescenarios are:(i) (-500 x 4)/15000 = -13.3%(ii) (-500 x 0)/15000 = 0%(iii) (-500 x (–4))/15000 = 13.3%b)Total assets in the margin account are $20,000 (from the sale of stock) plus $15,000(the initial margin) = $35,000. Liabilities are 500P (the price of buying back theshares). A margin call will be issued when:(20,000 + 15,000 – 500P)/500P = 0.25 or P=$56c)With a $1 dividend, the short position must also pay $1 per share or $500 ($1 x 500)on the borrowed shares. The rate of return will be (-500 x ∆P – 500)/15,000.(i) [(-500 x 4) – 500]/15000 = -16.7%(ii) [(-500 x 0) – 500]/15000 = -3.33%(iii) [(-500 x (–4)) – 500]/15000 = 10.0%Liabilities are now (500P + 500). A margin call will be issued when:(20,000 + 15,000 – 500P - 500)/500P = 0.25 or P=$55.2013. a)55 ½ b)55 ¼ c)The trade will not be executed since the price on the limit sell order is higher than the quotedbid price (and the quoted ask price). d) In a purely dealer market, the trade will not be executed since the price on the limit buy orderis lower than the quoted ask price and all buy orders must be executed against the dealer’s ask quote.However, even on the Nasdaq market, customer limit orders now get priority over dealerquotes when they offer a better price than the quotes. In addition, the order could besubmitted to an ECN where it would set the inside quote. As a result, the Nasdaq dealermarket is looking more and more like an exchange market (see 14(b) below). Since this limitbuy order is offering to pay a higher price than the dealer (whose bid quote is 55¼), the limitorder would be executed against the next incoming market sell order.14. a) There can be price improvement for the two market orders. Brokers for each of themarket orders (i.e., the buy and the sell orders) can agree to do a trade inside thequoted spread. For example, they can trade at $55 3/8, thus improving the price forboth customers by $1/8 relative to the quoted bid and ask prices. The buyer gets thestock for $1/8 less than the quoted ask price and the seller receives $1/8 more for thestock than the quoted bid price.b) Whereas the limit buy order at $55 3/8 would not be executed in a purely dealer market(since the ask price is $55 ½), it could be executed in an exchange market. A brokerfor another customer with an order to sell at the market price would view the limitbuy order as the best bid price. The two brokers could agree to the trade and bring itto the specialist who would then execute the trade.19. d) Your order will be triggered at a price of $55. However, when the stock price dropsbelow your stop-loss price of $55, your stop-loss order immediately becomes amarket order and is executed at the prevailing market price. Thus, you could get $55per share, but you could also get a little bit more or a little bit less.。
- 1、下载文档前请自行甄别文档内容的完整性,平台不提供额外的编辑、内容补充、找答案等附加服务。
- 2、"仅部分预览"的文档,不可在线预览部分如存在完整性等问题,可反馈申请退款(可完整预览的文档不适用该条件!)。
- 3、如文档侵犯您的权益,请联系客服反馈,我们会尽快为您处理(人工客服工作时间:9:00-18:30)。
1. Consider the three stocks in the following table. P represents prices at time t ,and Q represents shares outstanding at time t. STOCK C splits two-for-one in the last period.a.calculate the rate of return on a price-weighted index of the three stocks for the firstperiod(t=0 to t=1).答案:At t = 0, the value of the index is: (90 + 50 + 100)/3 = 80At t = 1, the value of the index is: (95 + 45 + 110)/3 = 83.3333The rate of return is: (83.3333/80) – 1 = 4.167%b.What must happen to the divisor for the price-weight index in year 2?答案:In the absence of a split, stock C would sell for 110, and the value of the index would be: (95 + 45 + 110)/3 = 83.3333After the split, stock C sells at 55. Therefore, we need to set the divisor (d) such that:83.3333 = (95 + 45 + 55)/d…..d = 2.340c.Calculate the rate of return of the price-weighted index for the second period (t=1 tot=2).答案:The rate of return is zero. The index remains unchanged, as it should, since the return on each stock separately equals zero.2. using the data in the precious problem, calculate the first period rates of return on the following indexes of the three stocks:a. a market value-weight index.答案:Total market value at t = 0 is: (9,000 + 10,000 + 20,000) = 39,000Total market value at t = 1 is: (9,500 + 9,000 + 22,000) = 40,500Rate of return = (40,500/39,000) – 1 = 3.85%b. an equally weighted index.答案:The return on each stock is as follows:R a = (95/90) – 1 = 0.0556R b = (45/50) – 1 = –0.10 R c = (110/100) – 1 = 0.10The equally-weighted average is: [0.0556 + (-0.10) + 0.10]/3 = 0.0185 = 1.85%3. suppose you short sell 100 shares of IBM, now selling at $120 per share.a. what is your maximum possible loss?答案:In principle, potential losses are unbounded, growing directly with increases in the price of IBM.b. what happens to the maximum loss if you simultaneously place a stop-buy order at $128.答案:If the stop-buy order can be filled at $128, the maximum possible loss per share is $8. If the price of IBM shares go above $128, then the stop-buy order would be executed, limiting the losses from the short sale.4. DRK, inc., has just sold 100,000 shares in an initial public offering. The underwriter’s explicit fees were $60,000. the offering price for the shares was $40, but immediately upone issue, the share price jumped to $44.a. what is your best guess as to the total cost to DRK of the equity issue?答案:In addition to the explicit fees of $60,000, DRK appears to have paid an implicit price inunderpricing of the IPO. The underpricing is $4 per share, or a total of $400,000, implying total costs of $460,000.b. is the entire cost of the underwriting a source of profit to the underwriters?答案:No. The underwriters do not capture the part of the costs corresponding to theunderpricing. The underpricing may be a rational marketing strategy. Without it, the underwriters would need to spend more resources in order to place the issue with the public. The underwriters would then need to charge higher explicit fees to the issuing firm. The issuing firm may be just as well off paying the implicit issuance cost represented by the underpricing.5. suppose that Intel currently is selling at $40 per share. You buy 500 sharesusing $15000 of your own money, borrowing the remainder of the purchase from your broker. The rate on the margin loan is 8%.a. what is the percentage increase in the net worth of your brokerage account if the price ofIntel immediately changes to :(i)$44; (ii)$40; (iii)$36? What is the relationship between your percentage return and the percentage change in the price of Intel?答案:(i) Net worth increases to: ($44 x 500) – $5,000 = $17,000Percentage gain = $2,000/$15,000 = 0.1333 = 13.33%(ii) With price unchanged, net worth is unchanged. Percentage gain = zero.(iii) Net worth falls to ($36 x 500) – $5,000 = $13,000 Percentage gain =(–$2,000/$15,000) = –0.1333 = –13.33%The relationship between the percentage return and the percentage change in the price of the stock is given by: % return = % change in price x equityinitial s Investor'investment Total = % change in price x 1.333 For example, when the stock price rises from $40 to $44, the percentage change in price is 10%, while the percentage gain for the investor is: % return = 10% x 000,15$000,20$ = 13.33% b. If the maintenance margin is 25%, how low can Intel ’ s price fall before you get amargin call?答案: The value of the 500 shares is 500P. Equity is (500P – $5,000). You will receive a margin call when:P500000,5$P 500 = 0.25 when P = $13.33 or lower c. How would your answer to (b)change if you had financed the initial purchase with only$10,000 of your own money?答案:The value of the 500 shares is 500P. But now you have borrowed $10,000 instead of$5,000. Therefore, equity is (500P – $10,000). You will receive a margin callwhen:P500000,10$P 500- = 0.25 when P = $26.67 With less equity in the account, you are far more vulnerable to a margin call.d. What is the rate of return on your margined position (assuming again that you invest$15,000 of your own money) if Intel is selling after on year at : (i) $44.; (ii) $40; (iii) $36? What is the relationship between your percentage return and the percentage change in the price of Intel? Assume that Intel pays no dividends.答案: By the end of the year, the amount of the loan owed to the broker grows to:$5,000 x1.08 = $5,400The equity in your account is (500P – $5,400). Initial equity was $15,000. Therefore, your rate of return after one year is as follows:(i )000,15$000,15$400,5$)44$500(--⨯= 0.1067 = 10.67% (ii) 000,15$000,15$400,5$)40$500(--⨯= –0.0267 = –2.67% (iii)000,15$000,15$400,5$)36$500(--⨯= –0.1600 = –16.00% The relationship between the percentage return and the percentage change in the price of Intel is given by:% return = ⎪⎪⎭⎫ ⎝⎛⨯equity initial s Investor'investment Total price in change %⎪⎪⎭⎫ ⎝⎛⨯-equity initial s Investor'borrowed Funds %8 For example, when the stock price rises from $40 to $44, the percentage change in price is 10%, while the percentage gain for the investor is:⎪⎭⎫ ⎝⎛⨯000,15$000,20$%10⎪⎭⎫ ⎝⎛⨯-000,15$000,5$%8=10.67% e. Continue to assume that a year has passed. How low can Intel ’s price fall before you geta margin call?答案:The value of the 500 shares is 500P. Equity is (500P – $5,400). You will receive a margin call when:P500400,5$P 500- = 0.25 when P = $14.40 or lower . 6. suppose that you sell short 500 shares of intel , currently selling for $40 pershare, and give your broker $ 15,000 to establish your margin account. a. if you earn no interest on the funds in your margin account , what will be your rate ofreturn after one year if Intel stock is selling at: (i) $44.; (ii) $40; (iii) $36? Assume that Intel pays no dividends.答案:The gain or loss on the short position is: (–500 P)Invested funds = $15,000Therefore: rate of return = (–500 P)/15,000The rate of return in each of the three scenarios is:(i) rate of return = (–500 $)/$15,000 = –0.1333 = –13.33%(ii) rate of return = (–500$)/$15,000 = 0%(iii) rate of return = [–500 (–$4)]/$15,000 = +0.1333 = +13.33%Total assets in the margin account are $20,000 (from the sale of the stock) + $15,000 (the initial margin) = $35,000. Liabilities are 500P. A margin call will be issued when:= 0.25 when P = $56 or higherb.If the maintenance margin is 25%, how high can Intel’s price rise before you get amargin call?答案:With a $1 dividend, the short position must now pay on the borrowed shares: ($1/share 500 shares) = $500. Rate of return is now:[(–500P) – 500]/15,000(i) rate of return =[(–500 $4) – $500]/$15,000 = –0.1667 = –16.67%(ii) rate of return = [(–500 $0) – $500]/$15,000 = –0.0333 = –3.33%(iii) rate of return = [(–500) (–$4) – $500]/$15,000 = +0.1000 = +10.00%Total assets are $35,000, and liabilities are (500P + 500). A margin call will be issued when: = 0.25 when P = $55.20 or higher7.waht are some differences between hedge funds and mutual funds?答案:Hedge funds have much less regulation since they are part of private partnerships and free from mist SEC regulation. They permit investors to take on many risks unavailable to mutual funds. Hedge funds, however, may require higher fees and provide less transparency to investors. This offers significant counter party risk and hedge fund investors need to be more careful about the firm the invest with.8.city street fund has a portfolio of $ 450 million , and liabilities of $ 10 millon.a.if there are 44 million shares outstanding, what is net asset value?答案:(450,000,000 – 10,000,000) / 44,000,000 = $10 per shareb.If a large investor redeems 1 million shares, what happens to the portfolio value, toshares outstanding, and to NA V?答案:(440,000,000 – 10,000,000) / 43,000,000 = $10 per share9. a. Impressive fund had excellent investment performance last year, with portfolio returns that placed it in the top 10% of all funds with the same investment policy. Do you expect it to be a top performer next year? Why or why not?答案:Empirical research indicates that past performance of mutual funds is not highly predictive of future performance, especially for better-performing funds. While theremay be some tendency for the fund to be an above average performer next year, it isunlikely to once again be a top 10% performer.b. Suppose instead that the fund was among the poorest performers in its comparison group. Would you be more or less likely to believe its relative performance will persist into the following year? Why ?答案:On the other hand, the evidence is more suggestive of a tendency for poor performance to persist. This tendency is probably related to fund costs and turnover rates. Thusif the fund is among the poorest performers, investors would be concerned that thepoor performance will persist.10. Unlike other investors, you believe the Fed is going to dramatically loosenmonetary policy. What would be your recommendations about investments in the following industries ? a. gold mining b. construction答案:a. Gold Mining. Gold is traditionally viewed as a hedge against inflation.Expansionary monetary policy may lead to increased inflation, and could thusenhance the value of gold mining stocks.b. Construction. Expansionary monetary policy will lead to lower interest rates whichought to stimulate housing demand. The construction industry should benefit. 11. here are four industries and four forecasts for the macroeconomy. Choosethe industry that you would expect to perform best in each scenario.Industries: housing construction , health care , gold mining,, steel production.Economic Forecasts: Deep recession: Falling inflation, falling interest rates, falling GDP. Superheated economy: Rapidly rising GDP, increasing inflation and interest rates.Healthy expansion: Rising GDP, mild inflation, low unemployment. Stagflation: Falling GDP, high inflation.答案:Deep recession Health care (non-cyclical)Superheated economy Steel production (cyclical)Healthy expansion Housing construction (cyclical, but interest rate sensitive) Stagflation Gold mining (counter cyclical)最后那两个大题的大表格什么的我就不打了,这个答案直接复制上来了,那么明显的大表格一下就能知道哪道题了哈!第十二章课后CFA Problems中的2。